Plotting
The library supports Line Plots and Scatter Plots.
This step basically creates a LinePlot object and initialises an empty chart with the parameters provided.
- title: Title of the Plot
- x_axis: Title on the X-axis
- y_axis: Title on the Y-axis
- width: Width of the plot
- Height: Height of the plot
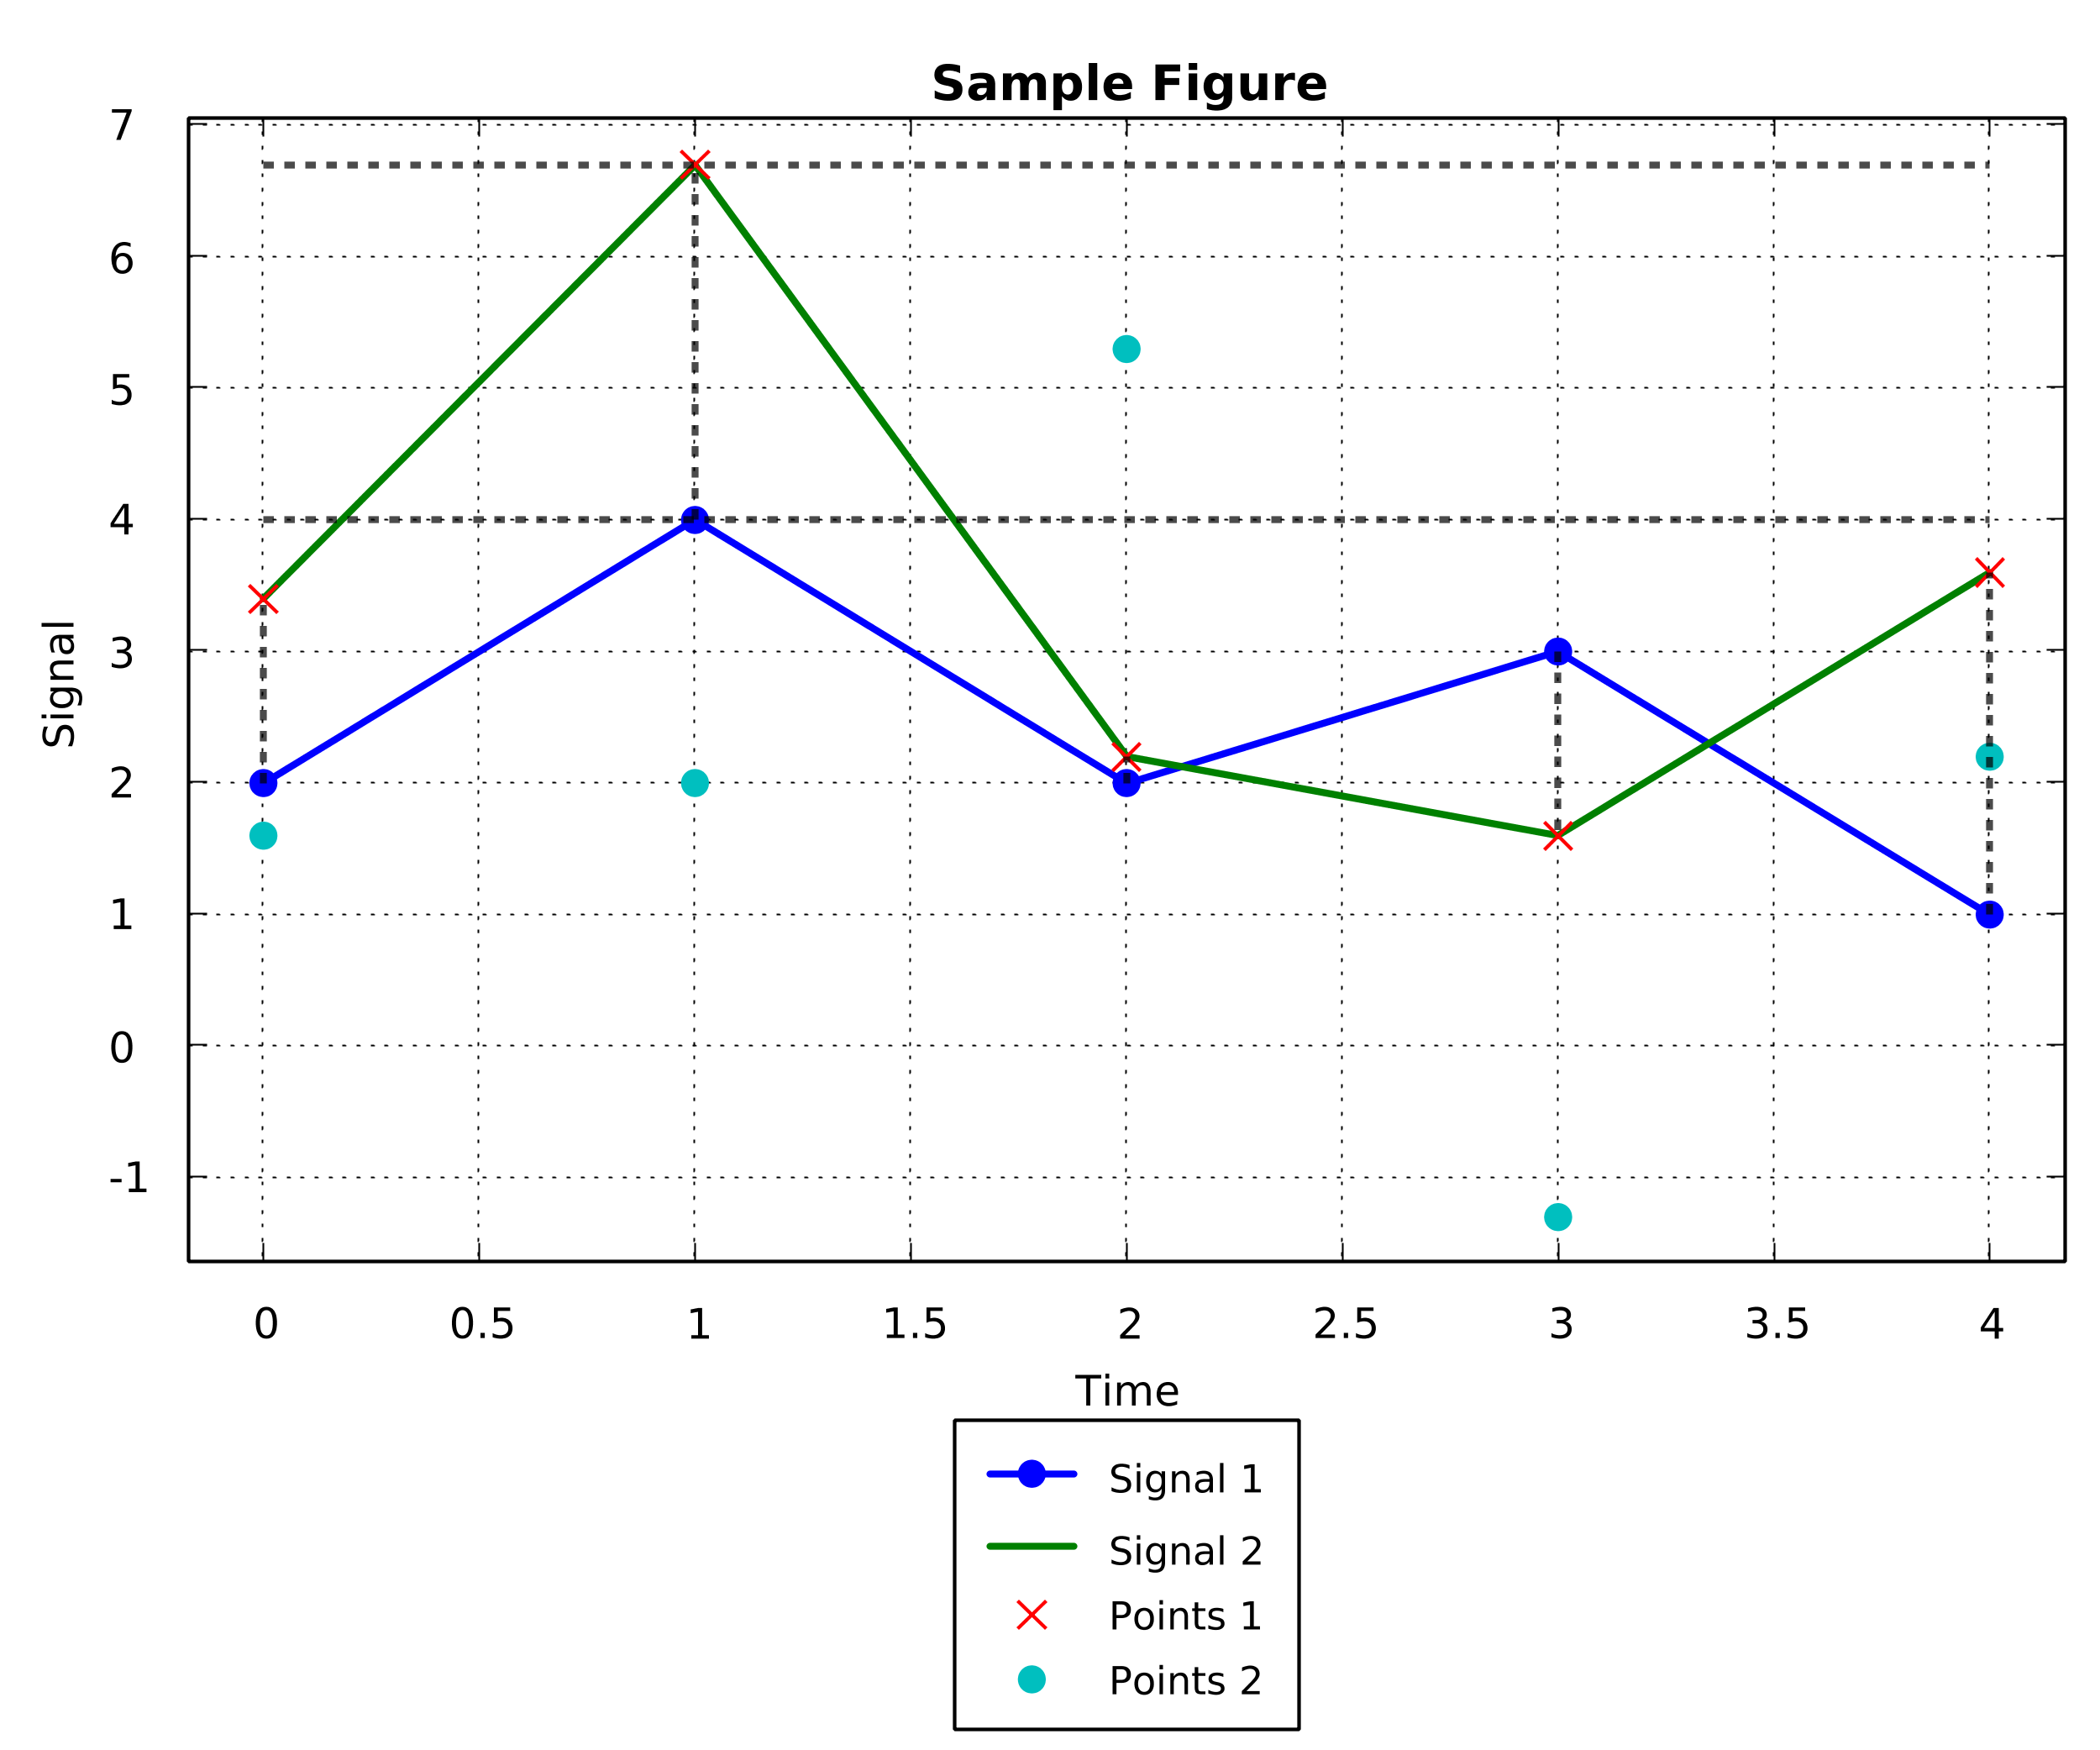
Plotting fig = new Plotting(600, 500, "Sample Figure", "Time", "Signal");
fig.initialisePlot();
- name: Name of the Signal used in the Legend
- x: Array to be plotted on the X-axis (optional)
- y: Array to be plotted on the Y-axis
- marker: Whether markers are to be plotted on the chart
double[] signal1 = {2.0, 4.0, 2.0, 3.0, 1.0};
double[] signal2 = {3.4, 6.7, 2.2, 1.6, 3.6};
double[] time = {0.0, 1.0, 2.0, 3.0, 4.0};

fig.addSignal("Signal 1", time, signal1, true);
fig.addSignal("Signal 2", time, signal2, true);
- name: Name of the Signal used in the Legend
- x: Array to be plotted on the X-axis (optional)
- y: Array to be plotted on the Y-axis
- marker: Marker to be used. Can be 'x', 'o', '+', '#', '^'.
final double[] points1 = {3.4, 6.7, 2.2, 1.6, 3.6};
final double[] points2 = {1.6, 2.0, 5.3, -1.3, 2.2};

fig.addPoints("Points 1", time, points1, 'x');
fig.addPoints("Points 2", time, points2);
For Horizontal:
- x_min: Starting point of the line
- x_max: Stopping point of the line
- y: Position where the line is drawn on y-axis
For Vertical:
- x: Position where the line is drawn on x-axis
- y_min: Top point of the line
- y_max: Bottom point of the line
// For vertical lines
double[][] verLines = {{0.0, 2.0, 3.4}, {1.0, 4.0, 6.7}, {2.0, 2.0, 2.2}, {3.0, 3.0, 1.6}, {4.0, 1.0, 3.6}};

for (int i=0; i<verLines.length; i++) {
    fig.vline(verLines[i][0], verLines[i][1], verLines[i][2]);
}

// For horizontal lines
fig.hline(0.0, 4.0, 4.0);
fig.hline(0.0, 4.0, 6.7);
The image is saved as a PNG image.
- name: Filename to be saved as (extension is required)
String outputFileName = "signal.png";
// To plot on a window
fig.plot();
// TO save as an image
fig.saveAsPNG(outputFileName);