Monitoring LibreQOS #6
Comments
|
Hello. I can definitely try my hand at it. Perhaps an SNMP interface so LibreNMS can graph it? What stats would you like to see on the monitoring? Thanks, Robert |
|
One very useful report would be what IPs are passing through under what HTB. And also if there are any IPs that haven’t been “provisioned” into a service level Sort of like a mapping of the Shaper.yaml against life traffic. Showing which IPs are “live” (passing traffic), and under which Site/AP they’re configuredBrian Longwe | CEO | Converged Technology Networks+265999708883 | https://www.ctnmw.net | Twitter: blongweOn Sat, 22 Jan 2022 at 2:19 AM Robert wrote:
Hello. I can definitely try my hand at it. Perhaps an SNMP interface so LibreNMS can graph it? What stats would you like to see on the monitoring? Thanks, Robert
—Reply to this email directly, view it on GitHub, or unsubscribe.You are receiving this because you authored the thread.Message ID: ***@***.***>
[
{
***@***.***": "http:https://schema.org",
***@***.***": "EmailMessage",
"potentialAction": {
***@***.***": "ViewAction",
"target": "#6 (comment)",
"url": "#6 (comment)",
"name": "View Issue"
},
"description": "View this Issue on GitHub",
"publisher": {
***@***.***": "Organization",
"name": "GitHub",
"url": "https://github.com"
}
}
]
|
|
What would be great is to extract the latency details (direct blow at preseem's measurements) to see TCP stats for customers. throughput per site, per AP, per customer, per customer IP. I would rather see this exported to a time series db like influx or promethius than via SNMP. That would expose the data to native and existing integrations with grafana and chart.js etc. |
Here is a sneak preview of v1.1. |
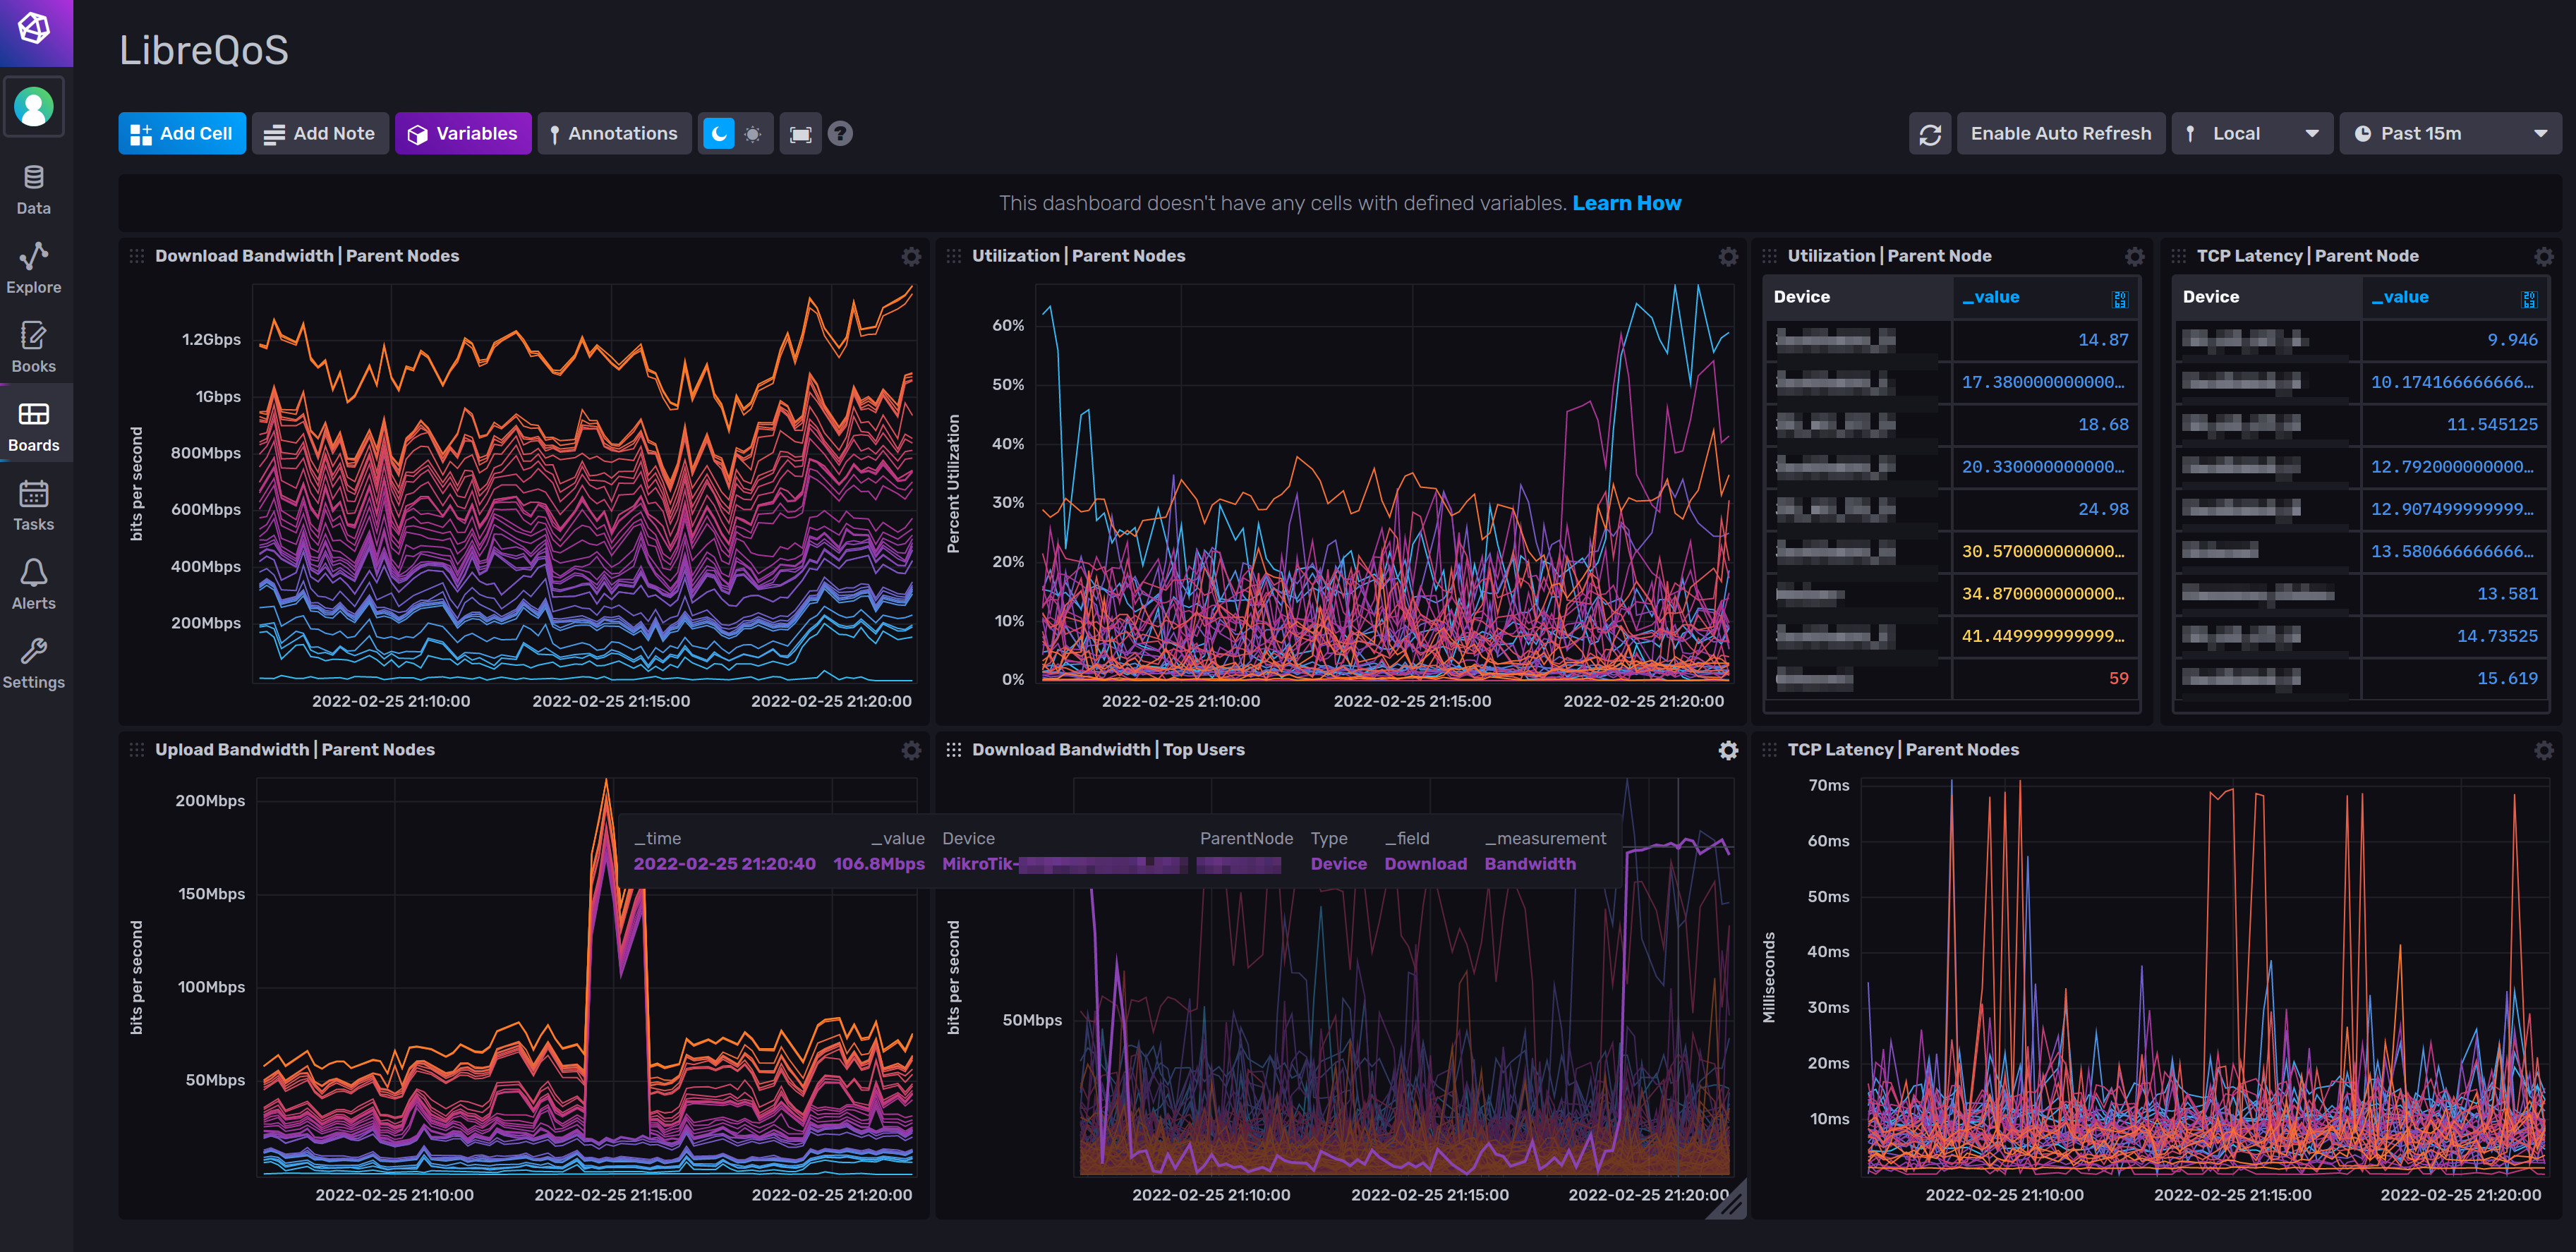
|
wha?!?!?!?! dude, this is incredible. |
|
my other comment brought this to mind. having throughput broken out into sites and APs would be fantastic If we're overselling the peak speeds out, what matters to us is seeing mountains not plateaus and this really matters down to the AP level, but the site level would tell us if our backhaul setup was underperforming. |
|
Thank you for the suggestion. Right now it breaks it down by AP (lowest level parent node) but I will think up how to display graphs by sites so tracking backhaul utilization is easier. |
|
since you're using influx, you could just put the AP name as an attribute so it could be grouped by in grafana. |
|
excuse me... SITE NAME... |
|
#75 <--- I didn't find this issue earlier so I made duplicate and I describe there how I see this case. |
|
I would like us to use this quote in the press release: "wha?!?!?!?! dude, this is incredible." |
|
otherwise, closing. |
Please advise if there is a way to monitor LibreQOS via a tool like LibreNMS or CheckMK? We have it nicely running inside our network and now I'd like to get our NOC to keep an eye on it...
The text was updated successfully, but these errors were encountered: