Allow data collecting from LibreQoS into monitoring tools #75
Comments
|
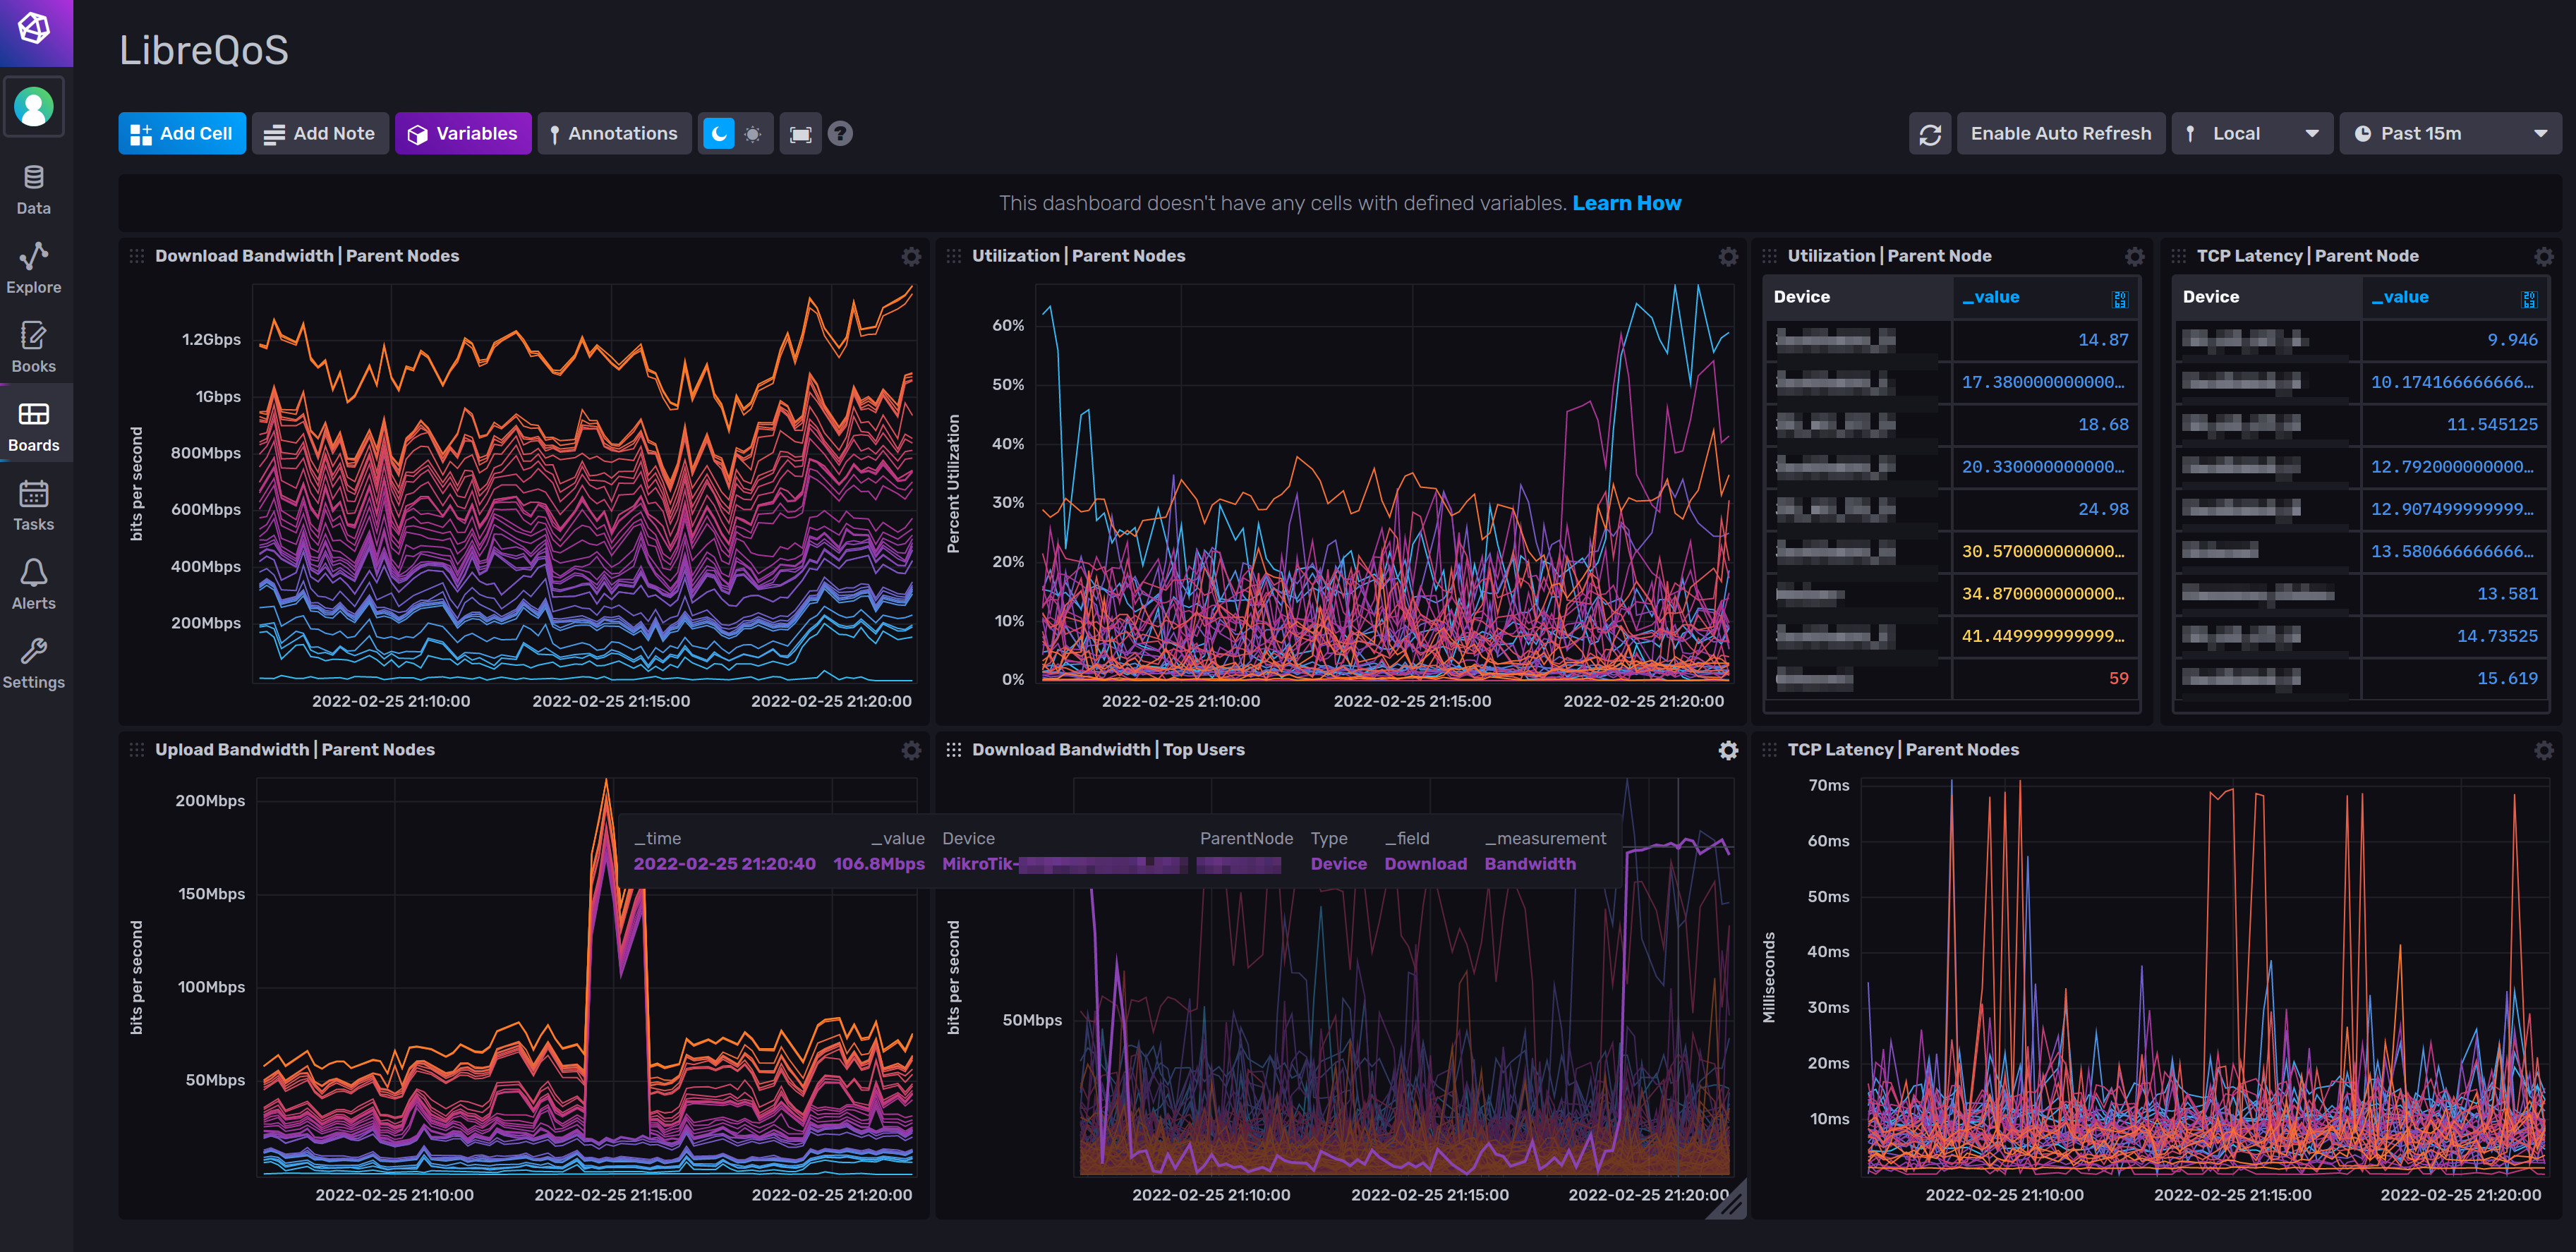
I'd recommend to have some script or something to pull stats from InfluxDB, which LibreQoS stores bandwidth data to. It stores data over time so you can neatly graph it easily. |
|
Is it possible to retrieve InfluxDB subscriber data by API? If Yes I would make code for generating graphs on CRM side. |
|
@rchac what software do You use to make graphs of retrieved data from API? Or is it possible to retrieve graph image by API? |
|
InfluxDB has a UI built-in, so there is often no need to use the API. You can use the influxDBdashboardTemplate.json file included with v1.2 for a pre-configured dashboard. |
|
Yes I know but I would like to show graphs inside customer tab in CRM. |
|
Ah ok gotcha. That is a very good idea for debugging! |
|
I dont see option for exporting graphs as an images in influxdb and i think that it would be better to generate graphs in our CRM from retrieved data (because of zooming and other features or things that could be done in future with them). |
|
I think that the influxdb (here on QoS Engine) is a bit overfeature (it should be marked as optional) This would generates more problems, many thoughts like #74 or at least much work to do with some ram usage / disk space monitoring. (more cons than pros in total). In my opinion we should get opportunity to share circuit traffic data to zabbix/librenms/cacti/sth_else_monitoring_tool and there do the magic (graphing, counting). For this we need some constant identifier when adding customer - that would not change after reloading, adding, removing customers from beggining of ShapedDevices.csv (not the classid could change when we mix customers in rows, or customer changes it plan). Then we could prepare gathering data whitch could be used after with:
This is good by design (graping is getting CPU ussage so the latency would not be touched in any circumstance). Maybe it's a good way to teach: lqTools.py --get-all-circuits-stats with the output of JSON/CSV with: |
|
I see |
|
There would be also helpful if we got only error: instead of: |
|
I'm punting this to 1.4. I would like to be able to do detailed offline analysis via classic postgres SQL and related tooling myself, and SNMP is useful, as is xabbix, but... |
|
The main thing is that we should go out with influx and use external tools for big instances for CPU savings. |
(every stats read from counters need to just add lines and not replace whole file - If zabbix would be unavaiable then the file will have all missing values from stats and there we would not have a holes in LibreQoS generated graphs. After error code 0 in ealier command we could delete this file.)
|
|
Current Solution: LTS |
I would like to show graphs provided by LibreQoS in our CRM.
@rchac what metod do You prefer to do things like that?
The text was updated successfully, but these errors were encountered: