Making .NET code less allocatey - Allocations and the Garbage Collector
Edit on GitHubThe .NET Garbage Collector (GC) is quite cool. In combination with the runtime’s virtual memory, it helps providing our applications with virtually unlimited memory, by reclaiming memory that is no longer in use and making it available to our code again. By doing so, it also takes away the burden of having to allocate and free memory explicitly. But sometimes, it still matters to understand when and where memory is allocated. The reason for that is simple: if we can use efficient coding to help our GC spend less CPU time allocating and freeing memory we can make our applications faster and less “allocatey”.
In this series:
- Making .NET code less allocatey - Allocations and the Garbage Collector
- Exploring .NET managed heap with ClrMD
- Exploring memory allocation and strings
The Garbage Collector and Generations
When running a .NET application, the runtime allocates a big chunk of memory in which it manages (de)allocations of objects. Allocations are done whenever a new object instance is created, deallocations are handled by the Garbage Collector (GC).
To be fast and efficient, the GC was made “generational” - new objects are allocated in the first generation (gen0). Whenever the GC runs, it typically tries to clean up as many object instances from this gen0 by looking at references pointing to our object. No longer in use? Free up its memory. Still in use? The objects are moved to gen1. A similar process is run on gen1, where surviving objects are moved into the long-lived generation, gen2, if they still can not be collected.
The GC runs very often on gen0, as short-lived objects usually have few other objects pointing to them and making cleanup quite fast - think objects used within the scope of a method, or a web request that allocates some objects that are obsolete once the response is rendered. The longer an object remains in memory, the more difficult it tends to become to cleanup the object, so the garbage collector runs less on gen1, and even less on gen2. Objects in these generations may live longer, so it makes no sense to check them all every time the GC runs. Running the GC means consuming CPU and freezing your application. Usually very short, but I’ve seen GC cycles of several seconds on big server applications - blocking incoming requests.
Another way of preventing objects from moving into further heap generations is by making use of IDisposable (to free resources) and making sure Dispose() is called whenever the object is no longer needed (e.g. using a using statement). This ensures the GC has no reason to believe our objects’ referenced objects can not be reclaimed. Be careful with finalizers: when the GC comes along and finds an object that is ready to be collected, it is moved into the finalizer queue (and thus promoted a generation as cleanup is postponed a cycle). Also remember finalizers are not guaranteed to run and it’s better to write no finalizer than a wrong finalizer.
To avoid long GC cycles, it makes sense to optimize allocations and make sure they can be collected quickly, preferrably while on gen0, or not allocating at all. Let’s see if we can find out when allocations are made.
When is memory from the heap allocated?
Memory from the heap is allocated when you new an object. Executing var person = new Person(); will allocate a Person object on the heap, consuming memory. So consuming less memory and making GC cycles faster is easy: don’t instantiate new Person objects! Creating a string also allocates memory. Of course, we’re writing an application that has to do things, so we need to allocate these objects. Just make sure they are created for the least amount of time possible.
No memory is allocated when making use of value types, such as int or bool, a custom struct, and a few others. The garbage collector never has to collect these, as they are not “pointers towards a value elsewhere in memory”, like objects. They just contain the value directly.
There are a lot of other situations though, where allocations do occur. For example, when boxing these value types. Consider the following example:
int i = 42;

// boxing - wraps the value type in an "object box"
// (allocating a System.Object)
object o = i;

// unboxing - unpacking the "object box" into an int again
// (CPU effort to unwrap)
int j = (int)o;
Boxing creates a new System.Object and places the value inside, then stores it on the managed heap. Now the GC has to clean up this mess!
There are some other interesting cases where you would not expect allocations. Let’s see how we can detect them…
Method 1 - Staring at Intermediate Language
I’ll use ReSharper’s IL viewer to view the Intermediate Language (IL) generated by the compiler. The nice thing with this IL viewer is that it lets us click C# code in the editor and shows us the IL for that statement (and vice-versa). If you’re not familiar with IL, this makes it easier to understand what is going on when running compiled code.
Brave souls could make use of ildasm.exe, .NET’s IL disassembler. It’s a bit more Spartan, but you can always use it to impress friends and colleagues!
Quick note: When using any IL viewer to look at allocations, make sure to build using the Release build configuration. Debug builds usually do not run any/all compiler optimizations, making for different IL code from what you would see with a Release build.
So here goes. How about this line of code?
Console.WriteLine(string.Concat("Answer", 42, true));
In IL, this is compiled to:
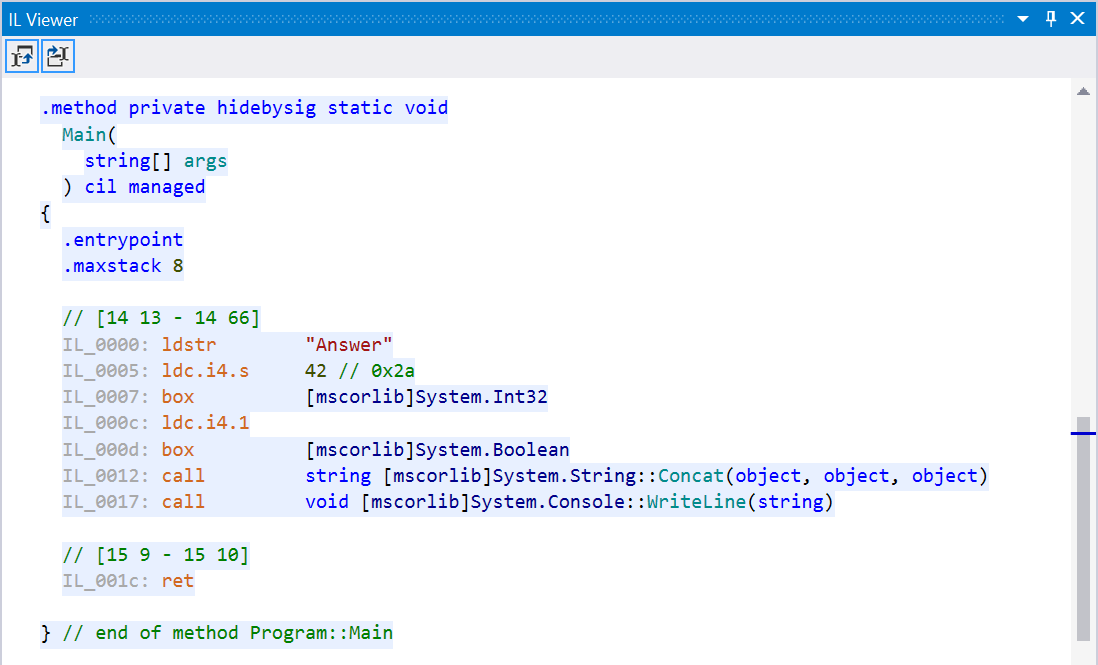
As you can see, the value types 42 and true are boxed here (the box IL statement makes that very clear). Not much we can optimize here, but I wanted to show you this one as a simple example of looking at boxing statements in IL.
Next up: working with params arrays in methods. Have a look at this code:
private static void ParamsArray()
{
    ParamsArrayImpl();
}

private static void ParamsArrayImpl(params string[] data)
{
    foreach (var x in data)
    {
        Console.WriteLine(x);
    }
}
There’s a hidden allocation in here… The call to ParamsArrayImpl() looks like this in IL:
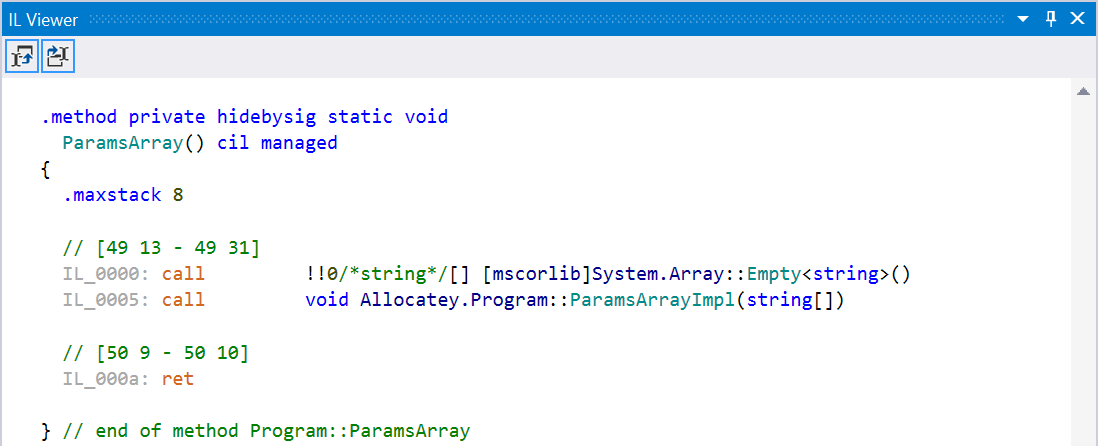
Essentially, we are allocating an empty array of strings, and then passing that to our ParamsArrayImpl() method. This empty array has to be cleaned up by the GC. Better would be to create an overload that takes no arguments, or one argument, or two. This allocation is the reason string.Format has a few overloads - fewer required allocations of that array.
Quick note: Starting with .NET 4.6, no empty array will be allocated. Instead, Array.Empty<T> will be passed which is a cached, empty array.
Next up: using LINQ and anonymous functions. Have a look at this snippet and try to spot the hidden allocation:
private static double AverageWithinBounds(int[] inputs, int min, int max)
{
    var filtered = from x in inputs
        where (x >= min) && (x <= max)
        select x;

    return filtered.Average();
}
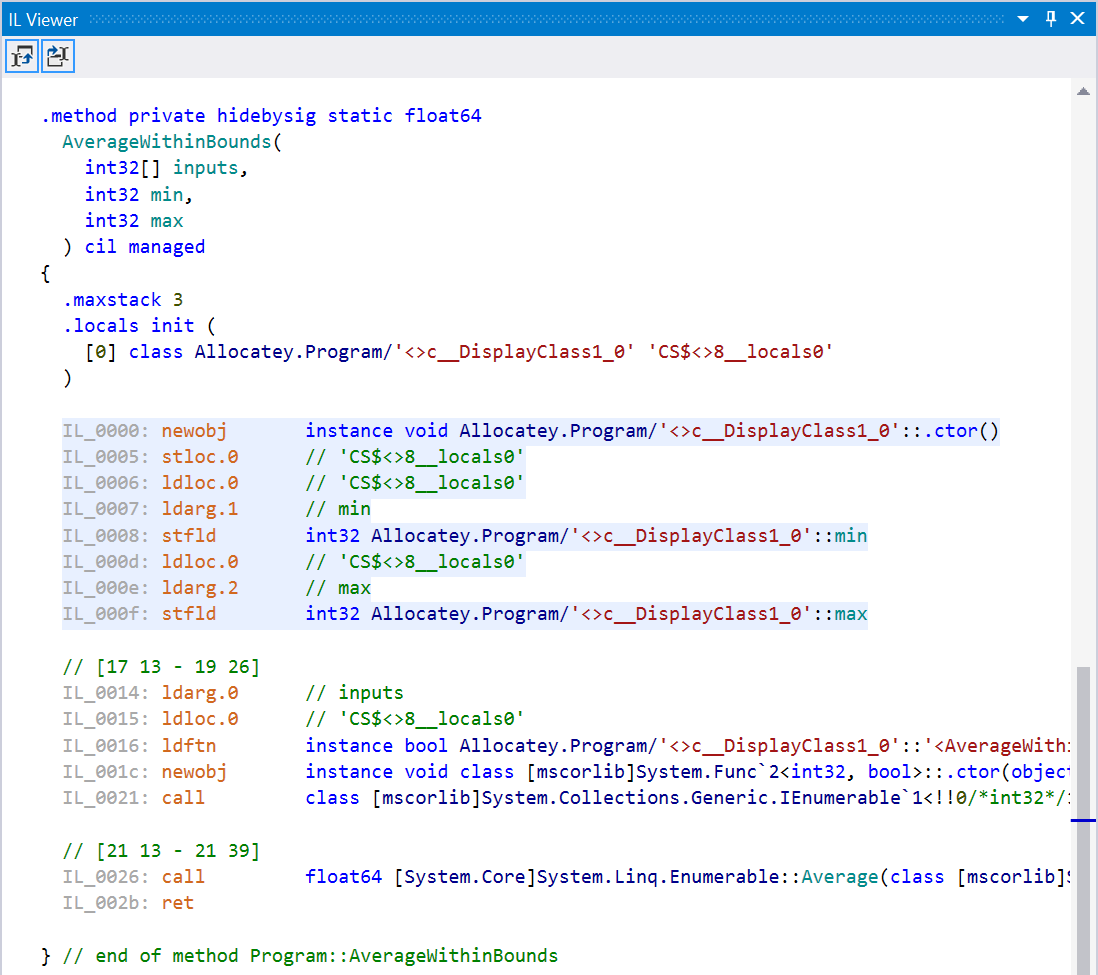
In this example, we need to store the values of min and max for use in our LINQ statement. If you look at the IL, we’re actually creating a new instance of <>c__DisplayClass1_0, a compiler-generated class, for further use. That’s an allocation right there!
Quick note: Matt Warren has a nice overview of LINQ-specific cases. Also, roslyn-linq-rewrite is something to keep an eye on. It's a tool that changes C# compilation in such a way that syntax trees of LINQ expressions are rewritten using plain procedural code, minimizing allocations and dynamic dispatching.
There are many more examples, try looking at this piece of code’s IL:
var strings = new string[] { "x", "y"};
foreach (var s in strings)
{
    Task.Run(() => Console.WriteLine(s));
}
(spoiler alert: a new <>c__DisplayClass0_0 will be allocated, capturing s for use in the System.Action)
Method 2 - Using plugins for Visual Studio and/or ReSharper
We’ve now looked at IL code. By now, most readers will have severely bleeding eyes. Luckily for us, there are plugins for Visual Studio and/or ReSharper that can help us spot hidden allocations!
Both the ReSharper Heap Allocations Viewer plugin as well as Roslyn’s Heap Allocation Analyzer can tell us when we are allocating memory. Here’s that last example from the previous section:

That’s way easier, no?
Method 3 - Profiling
The above methods help us tell when allocations are made, but it doesn’t tell us how many or how frequently this will happen when our application is running. Looking at the code, it’s also very difficult to analyze which heap generation our objects will end up.
The solution? Using a memory profiler. I’m a big fan of dotMemory, but there are others too. Using a memory profiler is a good practice anyway, as it tells us when and where things are being allocated and how many times.
As an example, I generated a big JSON document from RateBeer’s list of beers. The document contains a JSON array of beer objects, similar to this:
[
    {
        "name": "Westmalle Tripel",
	    "brewery": "Brouwerij der Trappisten van Westmalle",
	    "rating": 99.9,
	    "votes": 256974
	},
	...
]
In our production application, we want to read this file into a multi-dimensional dictionary that contains breweries, beers, and their rating. A Dictionary<string, Dictionary<string, double>>, to be precise. We also want to reload this dictionary every couple of minutes, as the ratings may change and we want to reflect that in our application.
Loading this into .NET poco’s is a bit silly, as we need a different object model. So instead, let’s loop through our beer JSON and load all beers into that dictionary:
public static void LoadBeers()
{
    Beers = new Dictionary<string, Dictionary<string, double>>();

    using (var reader = new JsonTextReader(
        new StreamReader(File.OpenRead("beers.json"))))
    {
        while (reader.Read())
        {
            if (reader.TokenType == JsonToken.StartObject)
            {
                // Load object from the stream
                var beer = JObject.Load(reader);

                var breweryName = beer.Value<string>("brewery");
                var beerName = beer.Value<string>("name");
                var rating = beer.Value<double>("rating");

                // Add beers per brewery dictionary if it does not exist
                Dictionary<string, double> beersPerBrewery;
                if (!Beers.TryGetValue(breweryName, out beersPerBrewery))
                {
                    beersPerBrewery = new Dictionary<string, double>();
                    Beers.Add(breweryName, beersPerBrewery);
                }

                // Add beer
                if (!beersPerBrewery.ContainsKey(beerName))
                {
                    beersPerBrewery.Add(beerName, rating);
                }
            }
        }
    }
}
This code is pretty fast: it loads the beer list into memory in about a second on my machine, and memory consumption should be okay as we’re not loading the entire file as a string and using JObject.Parse() on it. That would be insane as we’d need our full JSON file in memory as a string, again as a tree of JToken and once more in our final dictionary. So yes, the above is cool! It’s fast and only stores everything in memory once (plus some casual allocations for temporary values).
But is it? Let’s do some memory profiling, loading this a couple of times just like we will do in our final application.
for (var i = 0; i < 10; i++)
{
    BeerLoader.LoadBeers();
    Console.ReadLine();
}
Here’s an overview of taking a couple of memory snapshots:
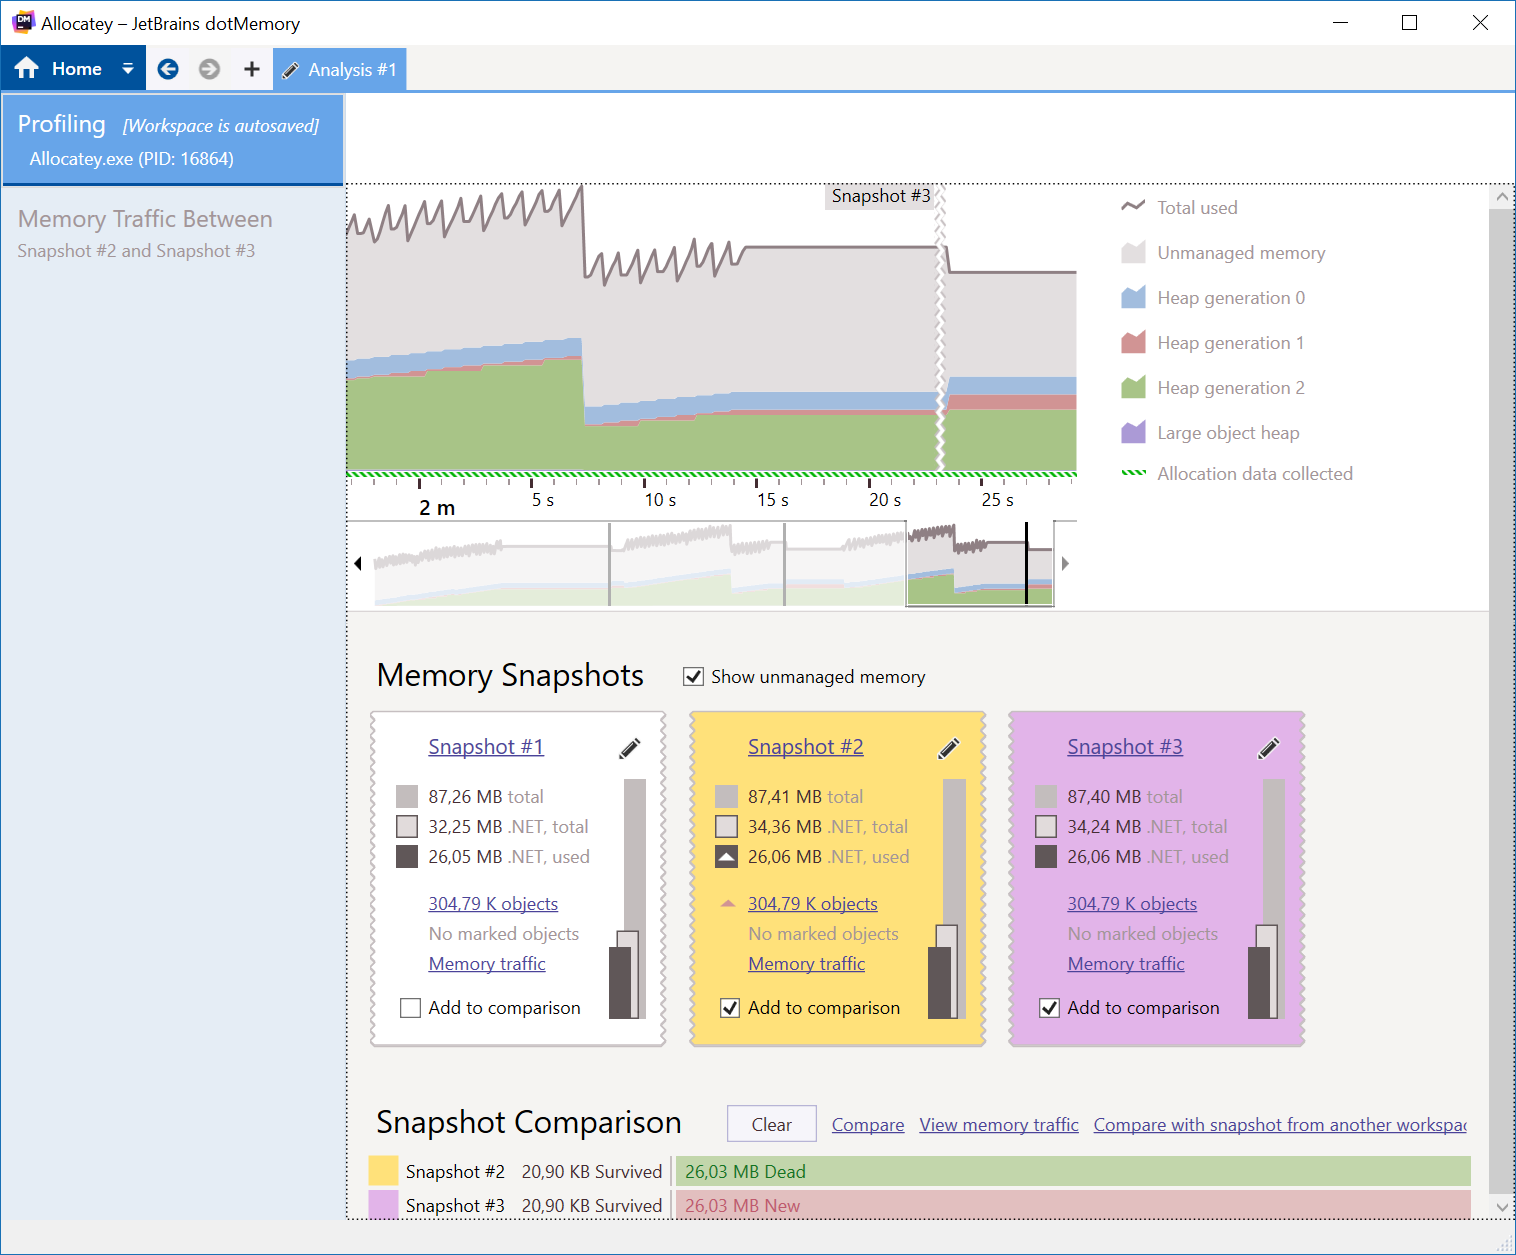
There are a couple of interesting things. First, we can see the GC in action. Memory all of a sudden drops, which means the GC did its job. We can see memory is mostly allocated in gen2, which is logical as we are keeping our dictionary around. gen0 and gen1 also incur quite some allocations. If we look at memory traffic between two snapshots at the bottom (make sure to collect allocations in the profiler), we can see almost the same amount of memory is allocated and reclaimed.
Looking at the details (and ignoring the fact that the one line of JObject.Parse() also does quite some string allocations and could also be rewritten using JsonTextReader), we can see that every time we reload our data, we are re-allocating our dictionaries over and over again!
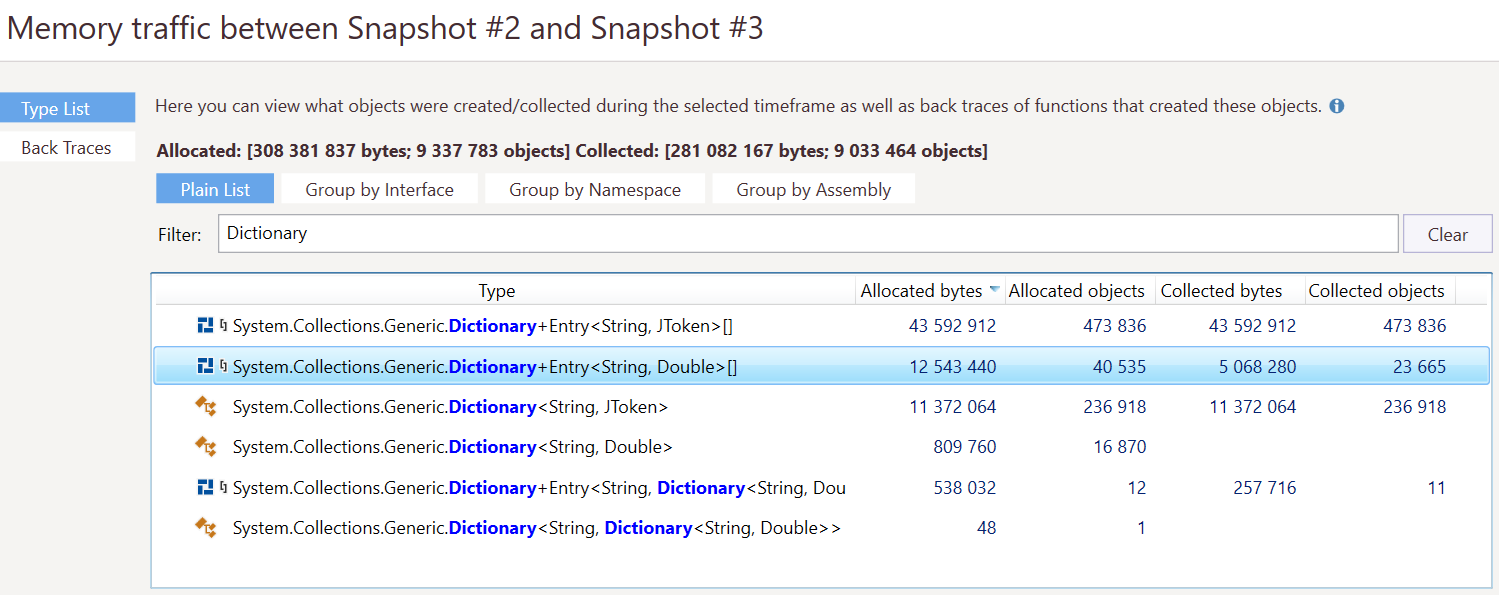
What if we optimized our code, and instead of recreating all dictionaries all the time we’d just re-use the existing dictionary and update the ratings?
public static void LoadBeers()
{
    using (var reader = new JsonTextReader(
        new StreamReader(File.OpenRead("beers.json"))))
    {
        while (reader.Read())
        {
            if (reader.TokenType == JsonToken.StartObject)
            {
                // Load object from the stream
                var beer = JObject.Load(reader);

                var breweryName = beer.Value<string>("brewery");
                var beerName = beer.Value<string>("name");
                var rating = beer.Value<double>("rating");

                // Add beers per brewery dictionary if it does not exist
                Dictionary<string, double> beersPerBrewery;
                if (!Beers.TryGetValue(breweryName, out beersPerBrewery))
                {
                    beersPerBrewery = new Dictionary<string, double>();
                    Beers.Add(breweryName, beersPerBrewery);
                }

                // Add beer
                if (!beersPerBrewery.ContainsKey(beerName))
                {
                    beersPerBrewery.Add(beerName, rating);
                }
                else
                {
                    beersPerBrewery[beerName] = rating;
                }
            }
        }
    }
}
Here’s what dotMemory tells us:
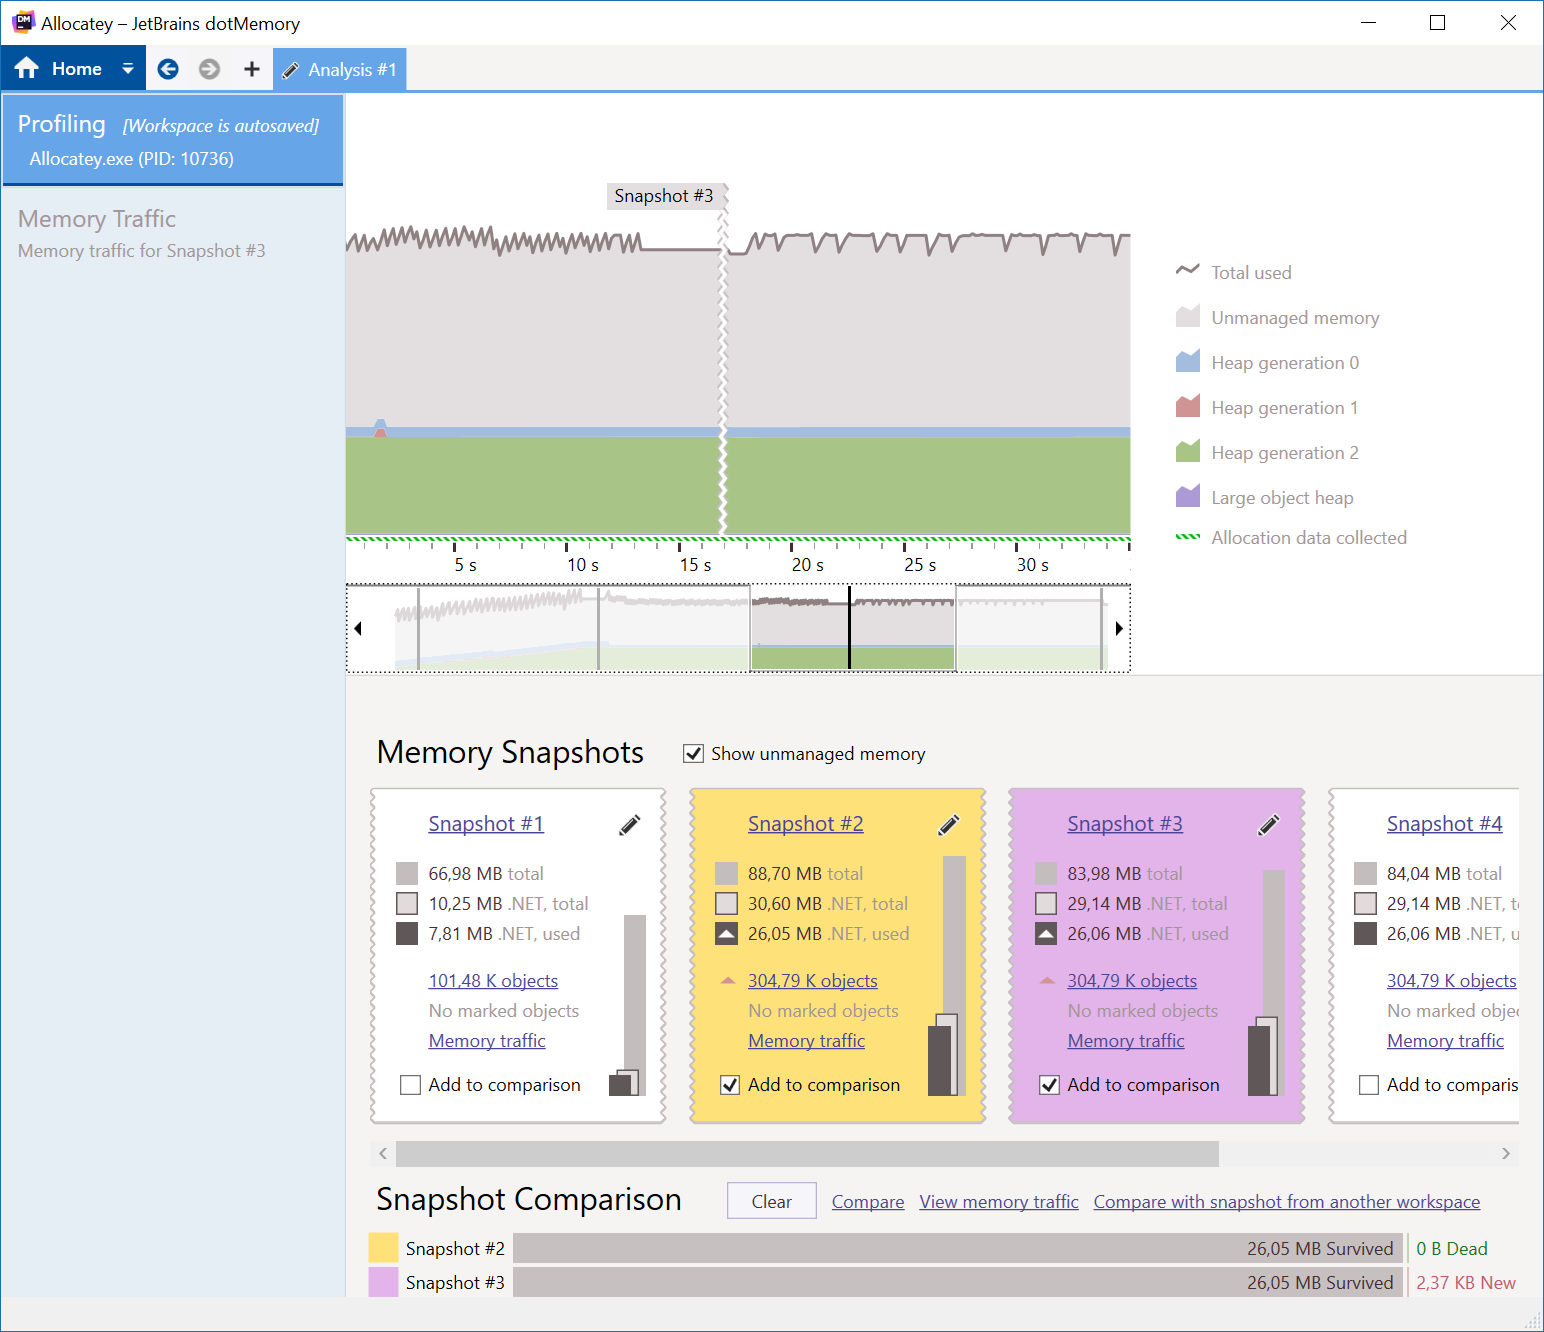
Less allocations on gen0 and gen1. Almost no memory traffic (allocations and GC) happening between snapshots. Victory! This will definitely help out a busy production application, as the GC has less work do do in this case. There are some more optimizations that can be done (allocating less strings in parsing the JSON), but this is a good improvement. Our code looked fine at first, but runing it and profiling it uncovered some allocations that could be avoided and benefit our running application.
On a side note, re-using objects is often a good way of optimizing allocations. Re-using objects that were already allocated reduces the number of objects the GC has to scan. The object pool pattern is one that can be used as well. The folks building ASP.NET Core are using similar ideas.
Don’t optimize what should not be optimized
There is an old adage in IT that says “don’t do premature optimization”. In other words: maybe some allocations are okay to have, as the GC will take care of cleaning them up anyway. While some do not agree with this, I believe in the middle ground.
The garbage collector is optimized for high memory traffic in short-lived objects, and I think it’s okay to make use of what the .NET runtime has to offer us here. If it’s in a critical path of a production application, fewer allocations are better, but we can’t write software with zero allocations - it’s what our high-level programming language uses to make our developer life easier. It’s not okay to have objects go to gen2 and stay there when in fact they should be gone from memory.
Learn where allocations happen, using any of the above methods, and profile your production applications frequently to see if there are large objects in higher generations of the heap that don’t belong there.


11 responses