Airbnb, Inc. is an American company that operates an online marketplace for lodging, with a primary focus on homestays for vacation rentals and tourism activities. Headquartered in San Francisco, California, the platform is accessible through both a website and a mobile app. Our project delves into the large dataset provided by the company to extract important references that significantly impact business metrics.
In this project we use Python to explore data and statistical measures to communicate data concepts.
- Get the dataset from Kaggle.
- Examine the data information.
- There are total:
- 102599 listings
- 5 neighborhood groups: Manhattan, Brooklyn, Queens, Bronx, Staten Island.
- 4 room types: Private room, Entire home/Apartments, Shared room, Hotel room.
- Perform basic data cleaning, such as handling missing values and data type conversions.
Afterwards, we create the following plots using Plotly and Matplotlib.
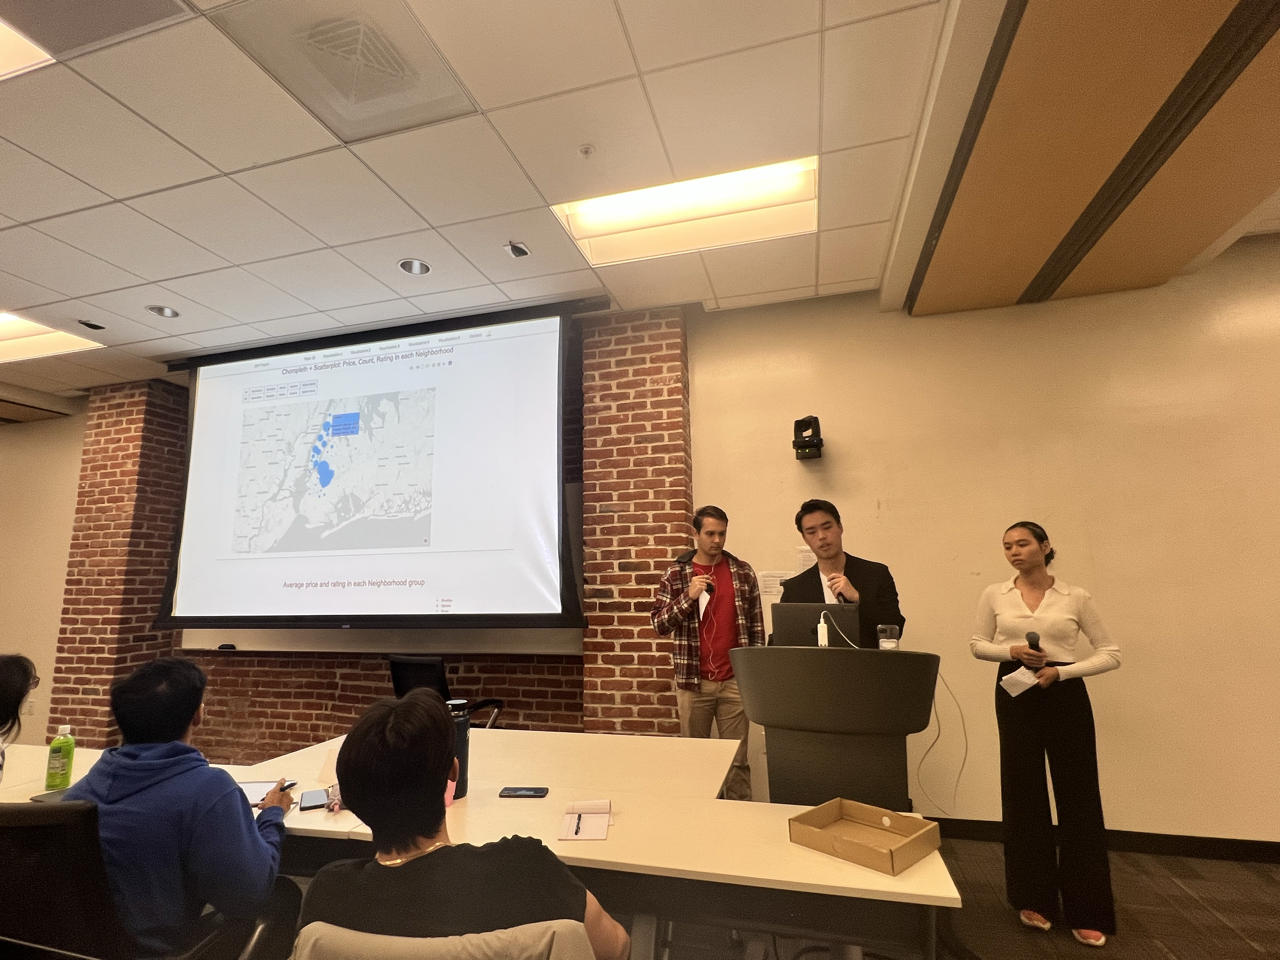
 Visualize the distribution of Airbnb listings across a geographic area using a choropleth map.
 Visualize the distribution of Airbnb price and rating in each neighborhood.
 Generate a word cloud from the names of listings.
 Create a bar graph to visualize the average price of room types (private room, entire home, shared room, hotel) in each neighborhood group. Implement Gestalt Principles: Law of Focal Point + Connectedness + Similarity to highlight insights.
- Although Private rooms and Entire homes/Apartments dominate the number of listings on Airbnb (almost 98%), they generally have lower price and ratings compared to Shared rooms and Hotels. Given their prevalence, it can be inferred that a significant portion of Airbnb's revenue is generated from commissions on these signature room types.
This exploratory data analysis shows that there is not much of a correlation between price and customer satisfaction; it really depends on customers' budget and past experience. However, there are a lot of potential for private rooms and entire homes/apartments to be improved.
The visualization demonstrates a strong contrast and captures the interest of the audience. Please visit our website for an interactive and responsive experience!
 |
 |
 |
 |
|---|
- assets - a directory contains all images and visualization files.
- notebooks - a directory contains all Jupiter Notebook files.
- README.md - project description
- index.html - main template for homepage when users go to the website.
- script.js
- style.css
- white.html - white template for homepage when users click the lightbulb.
- Fork this repository.
- Update assets and notebooks.
- Update index.html and white.html with your own assets.
- Deploy with Github Pages or using your own domains.
- Visualization: Arios Tong, John Bailey, Zoe Le
- Website: Zoe Le
- Git Repository
