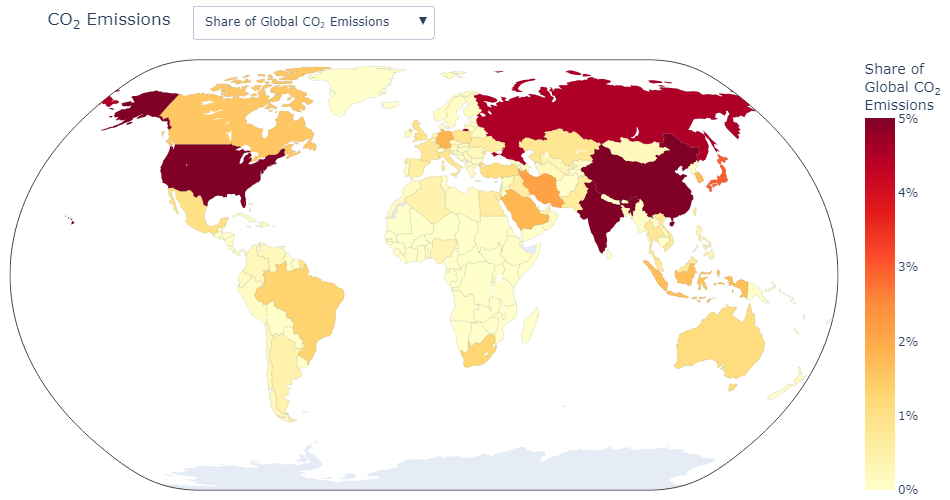
This project takes a deep dive into some of the factors that contribute to climate change and some relief efforts in different countries. It looks into emissions, energy consumption, renewable energy usage, and the climate change protection index by generating interactive world maps that show how countries are contributing to and working to reduce climate change.
climate_protection.ipynb will generate all visualizations and can be run using a Jupyter Notebook-like interpreter.
If you are just interested in exploring the maps themselves without messing with the code, the html_maps directory contains HTML files for all of the maps. Opening the files in a web browser will allow you to view and fully interact with them.
This project looks into many different aspects of climate change and there are plans to cover more. Currently, there are maps for the following:
- Climate Change Protection Index (https://en.wikipedia.org/wiki/Climate_Change_Performance_Index)
- Greenhouse Gas Emissions per Capita
- Methane Emissions per Capita
- Nitrous Oxide Emissions per Capita
- CO2 Emissions per Capita
- Share of Global CO2 Emissions
- Percent Growth of CO2 Emissions
- Primary Source of CO2 Emissions
- Share of Energy Consumption from Renewable Sources
- Energy Consumption per Capita
- Share of Energy Consumption from Nuclear Power
- Share of Energy Consumption from Hydropower
- Share of Energy Consumption from Solar Power
- Share of Energy Consumption from Wind Power
- Share of Energy Consumption from Biofuel
- Share of Energy Consumption from Other Renewables
Climate Change Protection Index

Greenhouse Gas Emissions per Capita

Share of Energy Consumption that comes from Renewable Sources

- Python
- Jupyter Notebook
- Plotly
- Pandas
Climate Change Protection Index data from https://en.wikipedia.org/wiki/Climate_Change_Performance_Index#2022_results
Emission data from https://www.kaggle.com/datasets/danielrpdias/co2-and-greenhouse-gas-emissions (originally from https://github.com/owid/co2-data)
Energy data from https://github.com/owid/energy-data
