This repository is the official implementation of "Optimizing Large-Scale Fleet Management on a Road Network using Multi-Agent Deep Reinforcement Learning with Graph Neural Network" by Juhyeon Kim and Kihyun Kim (ITSC 2021).
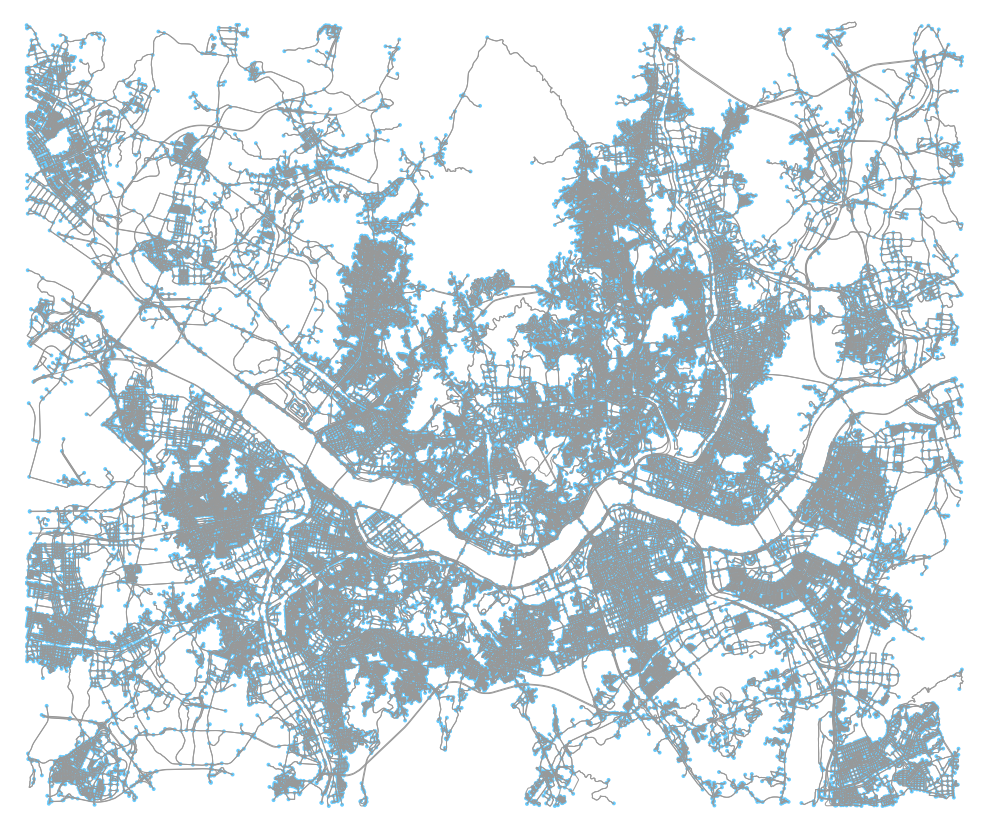
We use Deep Graph Library (DGL) and OSMnx to handle road network. For backend of DGL, we use PyTorch.
To install all of the requirements:
conda config --prepend channels conda-forge
conda create -n roadnetwork --strict-channel-priority osmnx==0.14.1 python=3.7
conda activate roadnetwork
conda install pytorch torchvision torchaudio cudatoolkit=10.2 -c pytorch
conda install -c anaconda ipykernel
python -m ipykernel install --user --name=roadnetwork
pip install dgl-cu102==0.4.3.post2
Tutorial_10by10GridCity.ipynb runs a simulation on simple 10 by 10 grid-shaped city.
For real city data, following notebook tutorials are available.
(1) Preprocessing
Tutorial_GraphSimplification.ipynbperforms graph simplification which is required to run simulation with large real data.Tutorial_SpeedInfoGenerator.ipynbgenerates speed information data at each road from raw speed data.
(2) Run Simulation
Tutorial_RealCity.ipynbruns simulation (both train and evaluate) in Seoul with real call data.Tutorial_RealCity_Multiprocessing.ipynbruns simulation (both train and evaluate) using multiprocessing. You need multi-GPU environment to run this code.
The data was provided from Kakao mobility, South Korea.
We upload example data in data_example folder to just check data format.
Full data will not be uploaded.
You should use your own data.
Public data (osmnx road data / speed data) is fully uploaded.
Please read README_data.md in data_example folder for the details.
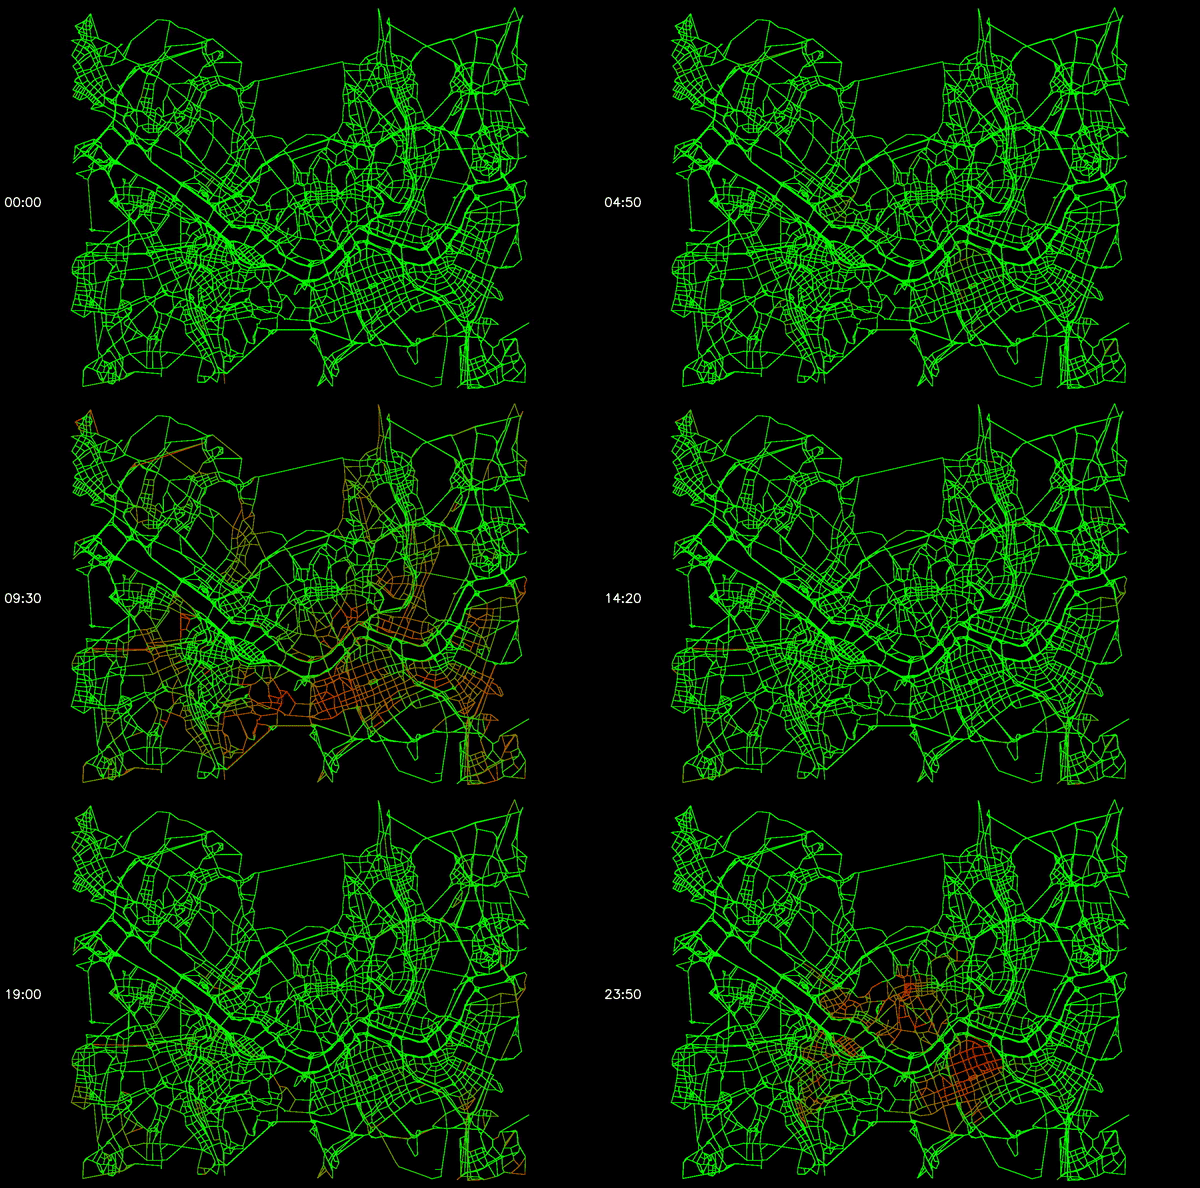
You can export Q value of the road at each time stamp to SVG file by enabling export_q_value_image option in evaluation function.
Following is the video that shows Q values of roads in Seoul at each time stamp in a single day.
Note that red means higher value and green means lower value.
If you find this useful for your research, please please consider to cite:
@inproceedings{kim2021optimizing,
  title={Optimizing large-scale fleet management on a road network using multi-agent deep reinforcement learning with graph neural network},
  author={Kim, Juhyeon and Kim, Kihyun},
  booktitle={2021 IEEE International Intelligent Transportation Systems Conference (ITSC)},
  pages={990--995},
  year={2021},
  organization={IEEE}
}

