(R Language)
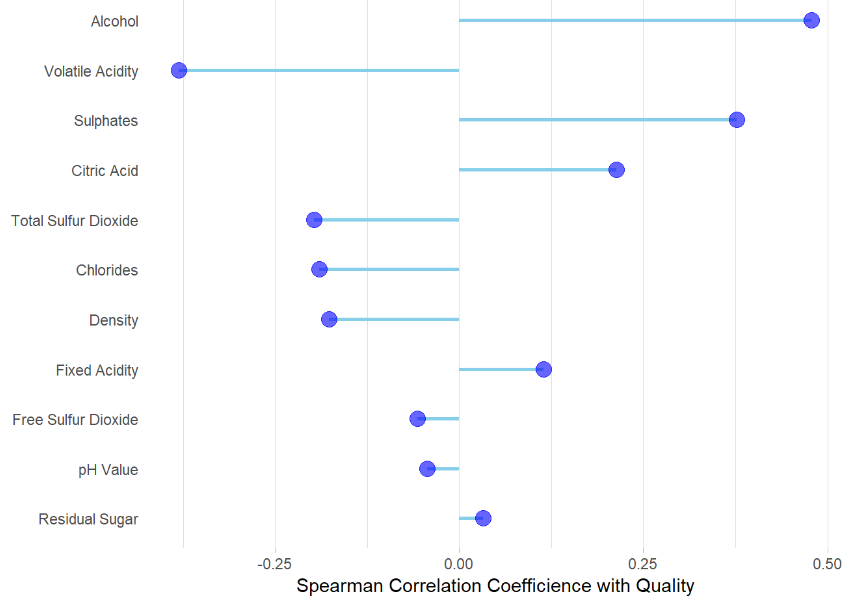
Which chemical properties influence the quality of red wines?
In this project, I investigated a tidy data set which contains 1,599 records of red wines.
There are 11 variables on the chemical properties of the wine. Besides, the quality of each wine was ranked by at least 3 wine experts with a rating between 0 (very bad) and 10 (very excellent).
- 1599 records
- 11 chemical properties
- quality rating: 0 - 10
The relationship between the quality score and the chemicals were explored by various kinds of plots, including:
- Scatter plot,
- Ridge Line Plot,
- Violin Plot,
- Lollipop Plot, etc.
R language was used in this project.
The report is shown in both RMD and HTML documents.
library(GGally)
library(ggplot2)
library(gridExtra)
library(RColorBrewer)
library(dplyr)
library(tidyr)
library(memisc)
library(corrplot)
library(ggridges)
library(kableExtra)
library(tibble)
library(car)
library(corrplot)
library(ellipse)
library(RColorBrewer)
library(ggpubr)