Prometheus is a powerful, open-source monitoring solution. This integration to xMatters extends the alerting capabilities of AlertManager to notify the right people at the right time.

An updated version of this integration is available. You can install the new one-way version right from the Workflow Templates directory within your xMatters instance. Learn more.
- Prometheus with AlertManager set up and running.
- An application to monitor
- xMatters account - If you don't have one, get one!
- An xMatters Agent or an open port to AlertManager that xMatters can access from the cloud.
- Prometheus.zip - Workflow for the integration builder script and notification form templates.
Alerting rules are defined in Prometheus and sent to AlertManager for further processing. The AlertManager config file defines what happens after the alerts are sent to AlertManager. A webhook points to an HTTP trigger in xMatters. Once the alert reaches xMatters, the integration builder script transforms the content and builds the event, sets the recipient to the receiver and creates the event.
- Login to the xMatters UI and navigate to the Workflows page.
- Click the Import Workflow and select the Prometheus.zip file.
- Update the Alert Manager Endpoint to the address of your alertmanager, i.e.
http:https://localhost:9093/api/v2/ - Edit the Run Location for the two silence steps to point to an agent, or the open port for AlertManager.
Steps:

Run Location:

- Open the
alertmanager.ymlfile and navigate to thereceiverssection. The location of the file and the section will depend on the details of the installation. - Add a new receiver. The name of the receiver will be the recipients of the event. The webhook url is found in the Inbound from Alertmanager step in your xMatters workflow. For example, to target the
Databasegroup:
- name: 'Database'
  webhook_configs:
    - url: 'https://acme.xmatters.com/api/integration/1/functions/UUID/triggers?apiKey=KEY'
Note: By storing the API Key in the URL it is visible in the UI. If you would like to keep the API Key out of the UI, use http_config and basic authentication to connect with xMatters.
- Edit the route that should target the new receiver. For example, to notifiy this
Databasereceiver for theoctoappservice:
  routes:
  - match_re:
      service: ^(octoapp)$
receiver: Database-
Repeat as needed for new routes and new receivers.
-
Edit any alert rules (referenced in the file(s) defined in the
rule_filessection of theprometheus.ymlfile) to include a priority annotation, or to include any additional fields required for processing. For example:
groups:
- name: alert.rules
  rules:
  - alert: octo_alert
    expr: some_gauge > 30
    for: 20s
    labels:
      service: octoapp
      severity: page_octo
    annotations:
      description: The description goes here
      summary: The summary goes here
      recipient: bob
The fields inside the ANNOTATIONS section are put inside the annotation_contents output.
Include an annotation called recipient for xMatters to know who to alert
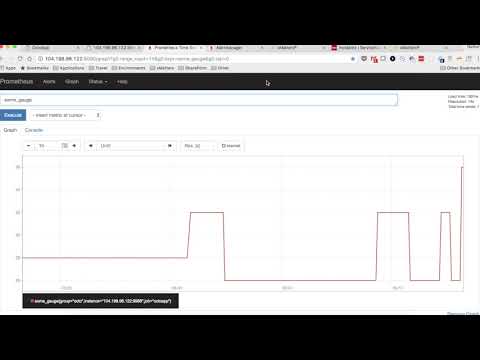
Create or edit an Alert Rule in the alert rules file (defined in the prometheus.yml file) that is easy to fire. For example, to fire when the widget_gauge is greater than 30 for 1 minute:
groups:
- name: alert.rules
  rules:
  - alert: octo_alert
    expr: some_gauge > 30
    for: 20s
    labels:
      service: octoapp
      severity: page_octo
    annotations:
      description: The description goes here
      summary: The summary goes here
      recipient: bob
Then in the monitored application, get the some_gauge value above 30 for 1 minute. This will trigger an alert in AlertManager, and then will be fired off to xMatters. Make sure you have a Database group with a user.
A notification will be sent out targeting the Database group:

Check the AlertManager log (This depends on installation details) for any errors making the call to xMatters. Then check the Activity Stream in the Inbound from Prometheus section for errors.
Make sure a recipient annotation is set in the alert rule that is triggered.
Check that the HTTP trigger in xMatters is associated with the receiver in your alertmanager.yml file.
This is the example flow provided in the Prometheus.zip Workflow file.
