This utility was written by FittedCloud
For more information about the software, see the blog post:
A Simple Open Source Tool for EC2 RightSizing Analysis
This tool collects AWS EC2 Cloudwatch stats of all EC2 instances in selected regions for the last two weeks and save them to a compressed json file with a name such as ec2stats-2018-02-15.json.gz.
python e2stats.py -k YOUR_ACCESS_KEY -s YOUR_SECRET_ACCESS_KEY
Or specify the directory of the aws credential file, otherwise it will look for .botoconfig in current directory.
python e2stats.py -c C:\Users\Bezos\.aws
It calls REST API to analyze the logs and the result will be printed on screen and saved as a json file with a name such as ec2summary-2018-02-15.
-----------------------------------Average CPU Utilization-----------------------------------
                    Distribution                    |                Summary
CPU%     : 10  20  30  40  50  60  70  80  90  100  | Min    Max    Mean   <=5%   <=10%  <=30%
Instances: 10  1   0   0   0   0   0   0   0   0    | 0.0%   11.0%  2.7%   9      10     11

-----------------------------------Maximum CPU Utilization-----------------------------------
                    Distribution                    |                Summary
CPU%     : 10  20  30  40  50  60  70  80  90  100  | Min    Max    Mean   <=5%   <=10%  <=30%
Instances: 2   1   0   2   0   0   0   0   0   6    | 3.0%   100.0% 62.5%  1      2      3

--------------------------------Distribution of Instance Types-------------------------------
t2.micro  :   3 | t2.small  :   3 | m5.large  :   2 | t2.large  :   1 | t2.medium :   1
t2.nano   :   1 |

-----------------------------------Distribution of Regions-----------------------------------
us-west-2 :   9 | us-east-2 :   2 |

-----------   Efficiency Compared to Users with Monthy Spending Around $1000      -----------
Your Efficiency     :      32 | Average             :      53 | Efficient Users     :      65

-------------------------Under-Utilized Instances: Avg<=5%, Max<=30%------------------------
i-04a85e6c382d29353 :us-west-2
i-0ba2f26b635b910e3 :us-west-2
i-04617102e11910453 :us-west-2
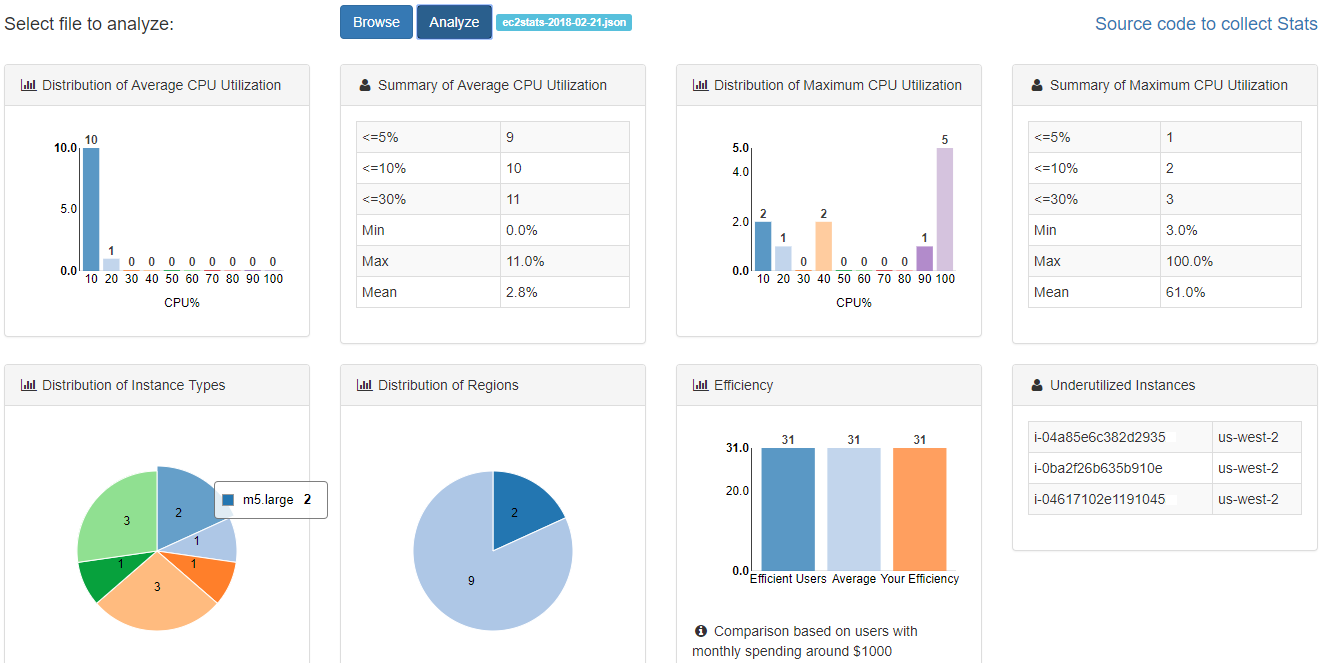
A better way to view the result is to visit https://customer.fittedcloud.com/v1/ec2stats and upload the ec2stats-xxxx-xx-xx.json file.
Other options:
-a False: Skip analysis
-v False: Turn off printing on screen
-l fileName: Load existing stats file instead of collecting from Cloudwatch
-t 5 10: Return under-utilized instance with Average CPU <= 5% and Maximum CPU <= 10%
-c C:\Users\Bezos\.aws: Parent directory of aws config
-p dev: profile
--govcloud: Flag to enable AWS GovCloud support
Here is example of the result of the analysis:
- Average: Analysis of average CPU utilization. It includes the number of instances with CPU less than 5%, 10%, and 30%. And the distribution of average CPU utilization.
- Maximum: Analysis of maximum CPU utilization. Similar to above.
- Efficiency: Efficiency score compared to other users.
- InstanceTypes: Instance types distribution.
- Regions: Distribution of instances across regions.
- UnderUtilized: List of under-utilized instances.
- Threshold: Threshold for Avg and Max CPU utilization for under-utilized instances.
    "Summary": {
      "Average": {
        "U5%": 10,
        "U10%": 13,
        "U30%": 14,
        "Min": 0,
        "Max": 15,
        "Mean": 3,
        "Histogram": [
          [
            10,
            13
          ],
          ...
          [
            100,
            0
          ]
        ]
      },
      "Maximum": {
        "U5%": 1,
        "U10%": 2,
        "U30%": 7
        "Min": 3,
        "Max": 100,
        "Mean": 54,
        "Histogram": [
          [
            10,
            2
          ],
          ...
          [
            100,
            6
          ]
        ]
      },
      "Efficiency": [
        "Average": 49,
        "Efficient": 60,
        "Efficiency": 35,
        "CostLevel": 1000
      ],
      "InstanceTypes": [
        [
          "m4.xlarge",
          "1"
        ],
        ...
      ],
      "Regions": [
        [
          "us-west-2",
          "3"
        ]
        ...
      ],
      "UnderUtilized": [
        [
          "i-04a85e6c382d29353",
          "us-west-2"
        ]
        ...
      ],
      "Threshold": [
        {
          "Avg": 5,
          "Max": 30
        }
      ]
    }
This tool was written in python2.X, and therefore, must be run with python2.X.
It is recommended that you run this tool and install it's requirements under a virtual environment. To do this, use the following commands:
pip install -U virtualenv
virtualenv -p python2.7 venv
. ./venv/bin/activate
pip install -r requirements.txt
