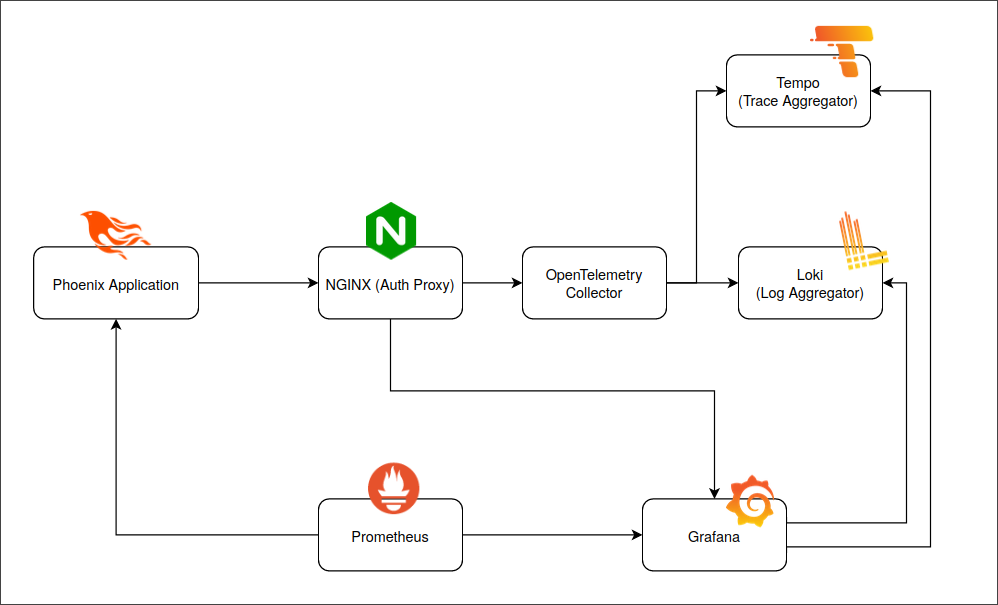
This project showcases an observable Phoenix application using:
- Loki for logs
- PromEx and Prometheus for metrics
- OpenTelemetry and Tempo for traces
- Grafana for data visualization and querying
- An optional NGINX proxy for securing access to the OpenTelemetry Collector
It aims to provide a solid start point for adding observability to an existing/new Phoenix application.
This project uses Docker containers and docker-compose to setup its environment, so if you want to try it, make sure you have Docker and docker-compose installed.
In order to see/interact with the application and the generated metrics, run the following command:
docker-compose upIf everything went well, you should now have everything running locally in your machine.
Head to https://localhost:4001/users and do some operations: create, show, list users, etc...
After doing some operations, check Grafana at https://localhost:3000 (default credentials are admin:admin)
You will find the dashboards generated by PromEx showing metrics on different subjects, such as the BEAM, Phoenix Endpoints or Ecto repositories:
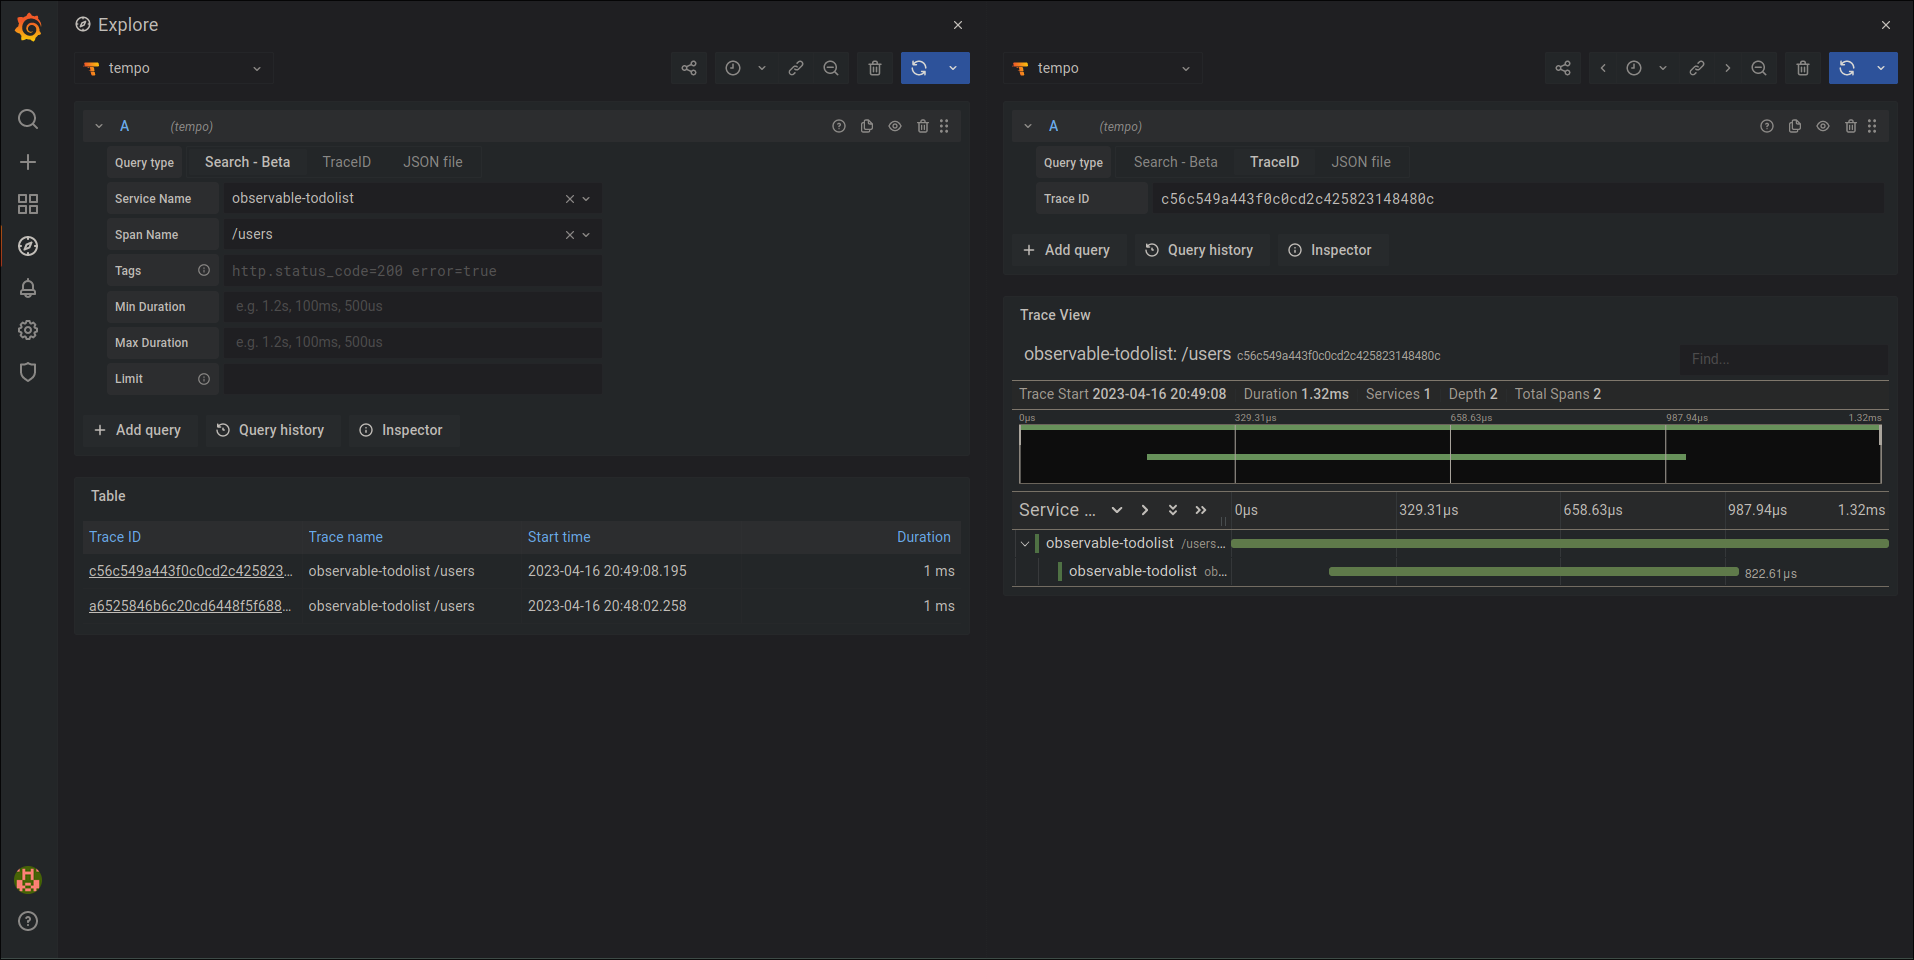
You can also go to the Explore tab and query for specific logs or traces:


