The Denote package by Protesilaos (Prot) Stavropol provides extensive functionality to create, retrieve, manage and link notes in plain text, Markdown and Org Mode. The most redeeming qualities of this package are its filename convention and modular simplicity. The Denote package provides many entry points to extend functionality and use your computer how you want to instead of the other way around.
The denote-explore package provides some convenience functions to manage your file collection.
This package currently provides three groups of interactive Emacs functions:
- Summary statistics: Count and visualise keywords and note types
- Random walks: Generate new ideas using serendipity
- Network visualisation: Visualise your Denote network of links
This package distinguishes between Denote files and attachments. Denote files are either Org Mode, Markdown or Plan Text. All other files are attachments, e.g., photographs, PDFs, media files, and any other binary and text files.
After a day of working hard on your digital knowledge garden, you should know how many Denote files you have written and the number of keywords you use. Two functions can help you answer these questions:
denote-explore-count-notes: Count the number of notes and attachments.denote-explore-count-keywords: Count the number of distinct keywords (file tags).
These two functions display the result of the count in the minibuffer.
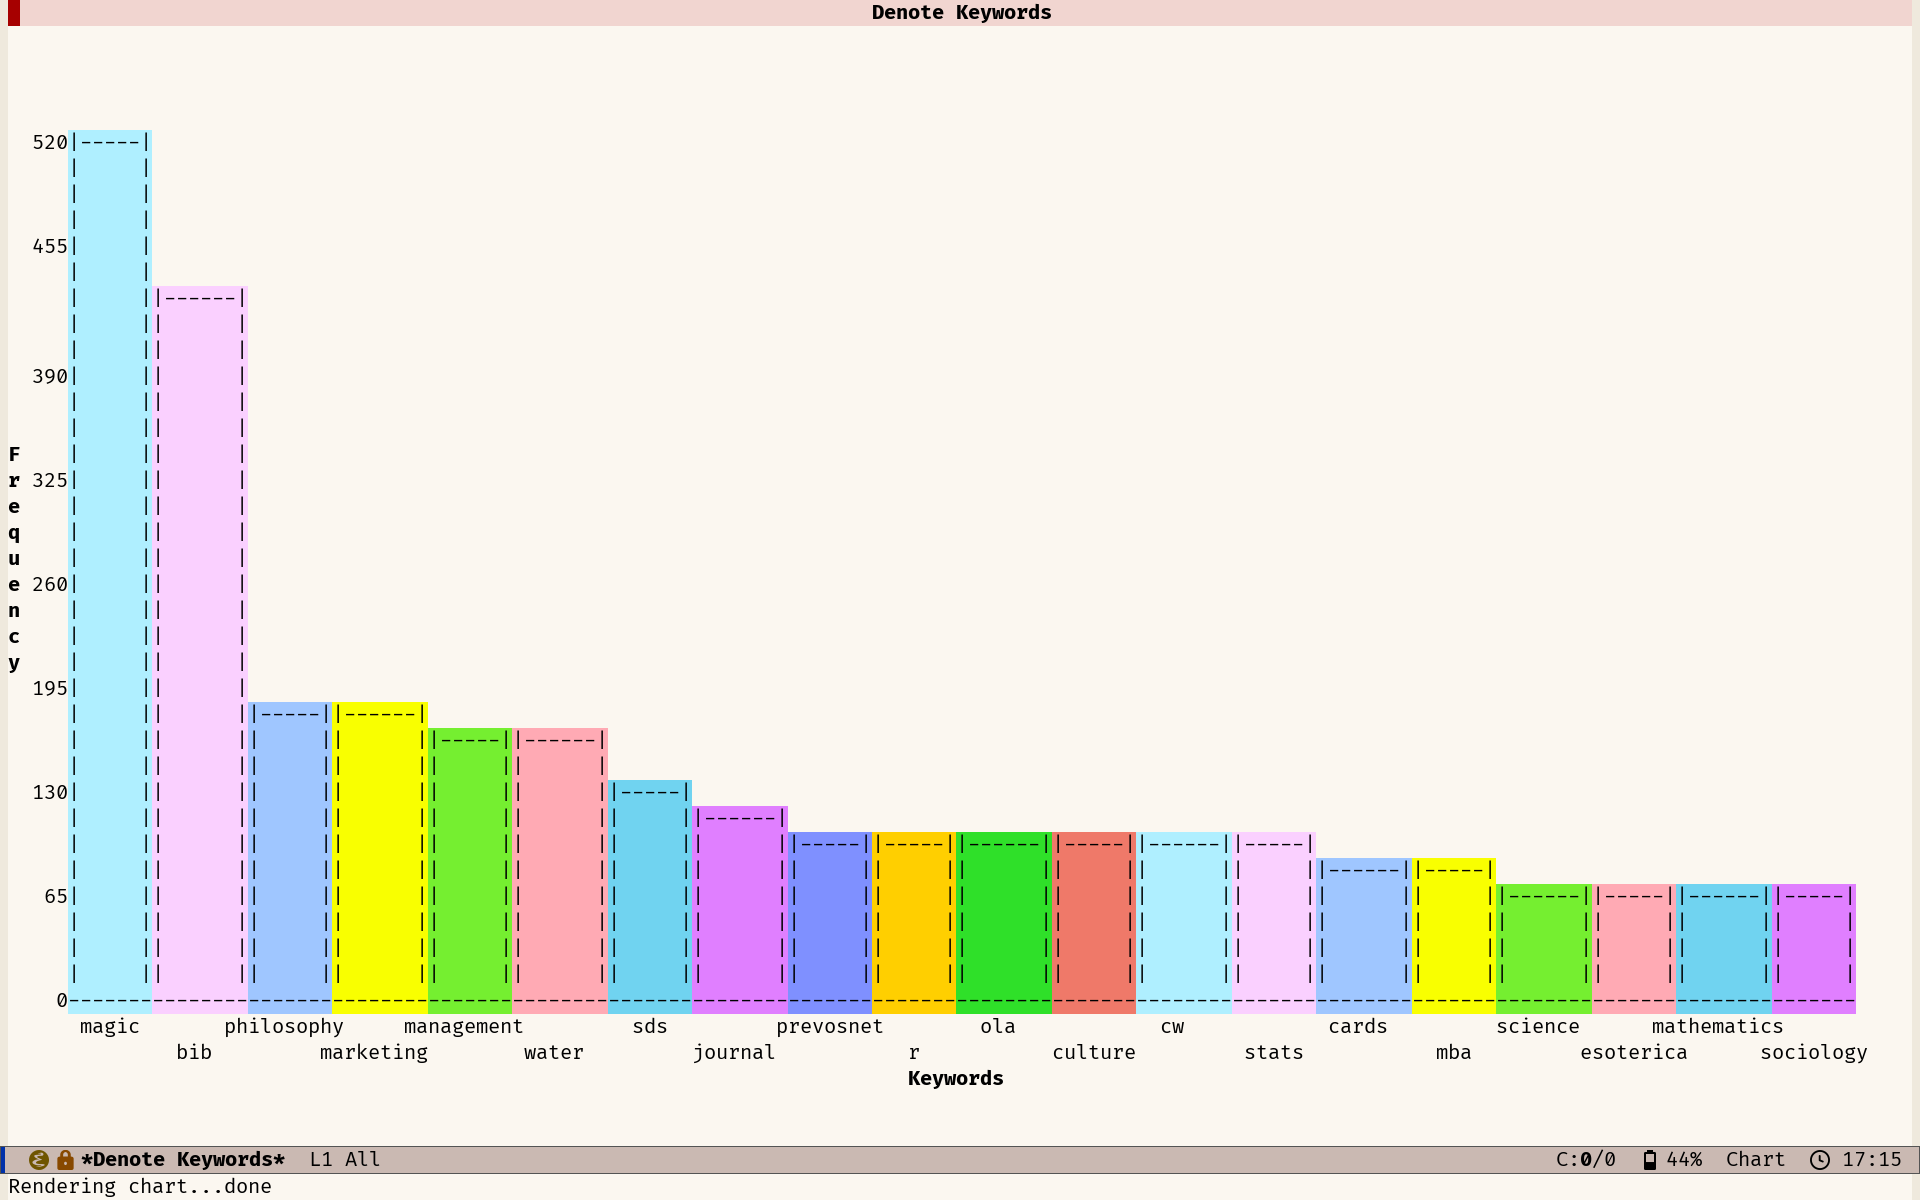
You can also visualise the most commonly used keywords and file types. The built-in chart.el package by Eric M. Ludlam is a quaint tool to create bar charts in plain text. Two commands visualise the number of keywords and file types:
denote-explore-keywords-barchart: Visualise the top n keywords.denote-explore-extensions-barchart: Visualise used file extensions.
You can also integrate these statistics with the Emacs Dashboard by Rakan Al-Hneiti and others.
The denote-explore-activate-dashboard function adds a widget to your dashboard. It displays the number of notes, attachments, and unique keywords.
The denote-explore-deactivate-dashboard function removes these widgets from the dashboard.
The answer is often vague and even mystical when asking creative people where they get their inspiration. The honest answer is, more often than not, inspiration arises by connecting random bits of information.
Serendipity provides a starting point for idea generation. Introducing random elements into the creative process generates ideas you might not have thought otherwise. This can be especially useful when you’re stuck in a rut and need help developing new ideas.
A random walk is a random sequence of events that follow each other. You can take a random walk by jumping to another note, either connected or unconnected to the current buffer. Another word for jumping to randomly linked notes is ‘snowball sampling’, as if you are rolling a snowball of information.
The package provides three functions to inject some randomness into your work:
denote-explore-random-note: Jump to a random note or attachment.denote-explore-random-keyword: Jump to a random note or attachment with the same selected tag as the current buffer. The user can choose any keyword when launched from a non-Denote buffer or a note without keywords.denote-explore-random-link: Jump to a random linked note (either forward or backwards).
The default state is that these functions jump to any Denote file. The universal argument (C-u) includes attachments as candidates for a random jump.
I am experimenting with visualising Denote using the R language, which is my weapon of choice for analysing and visualising data.
The denote-explore-network.R script contains a first attempt to visualise the links between Denote files with the D3 visualisation engine.
The denotes-explore-network-r function runs the R script and opens the resulting HTML file in your system browser. You must install the R language on your system for this to run. R will install some libraries when you run this code for the first time.
The network is stored in ~/denote-network.html, configurable only from within the R script.
- For Emacs to run the R code, you need to install the R language and the ESS (Emacs Speaks Statistics) package. Within Emacs, use
ess-eval-buffer(C-c C-b) to generate the network and save an HTML file to disk. - If you don’t use ESS, run this script in a shell with
Rscript denote-explore-network.R.
This visualisation is only rudimentary, and I need some help from D3 experts to provide more functionality and a configurable visualisation.
I am also looking at a plain text method to visualise the network neighbourhood. The hierarchy package can display information in a tree format, which might be helpful to visualise the local community of a Denote buffer, e.g. two links backwards and forwards.
Download or clone the files in this package and store them in your favourite location and activate it, e.g.:
(add-to-list 'load-path "~/denote-explore/")
(require 'denote-explore)
