This tutorial is designed to walk customers through adding tracing to AWS Lambda functions and monitoring their execution. At the outset, we will have a single APM service dashboard with linked tracing, execution metrics, and logs.
flowchart TB
    subgraph Elastic
    IngestPipeline[Ingest Pipelines; add service.name]
    APMServer[APM Server]
    Elasticsearch
    end

    subgraph AWS
    subgraph Lambda
    subgraph AutoInstrumentation[ADOT Auto Instrumentation Layer]
    Function[Lambda Function]
    end
    ADOTc[ADOT OTel Collector Layer]
    end
    CloudWatch[CloudWatch Logs]
    subgraph EC2
    ElasticAgent[Elastic Agent]
    end

    Lambda == metric API (pull) ==> ElasticAgent
    Function == logs (push) ==> CloudWatch
    CloudWatch == log API (pull) ==> ElasticAgent

    AutoInstrumentation == OTLP traces (push) ==> ADOTc
    ADOTc == OTLP traces (push) ==> APMServer
    ElasticAgent == logs+metrics (push) ==> IngestPipeline
    APMServer ==> Elasticsearch
    IngestPipeline ==> Elasticsearch
    end
Select an existing Lambda function, or create a new one. If creating a new Lambda function for exemplary purposes, consider the following code:
import json

import json
import boto3
from decimal import Decimal

client = boto3.client('dynamodb')
dynamodb = boto3.resource("dynamodb")

tableName = 'HelloWorld'
table = dynamodb.Table(tableName)

def lambda_handler(event, context):
    print(f"received event: {event}")

    body = {}
    statusCode = 200
    headers = {
        "Content-Type": "application/json"
    }

    if event['routeKey'] == "GET /":
        body = 'GET'
    elif event['routeKey'] == "PUT /items":
        requestJSON = json.loads(event['body'])
        table.put_item(
                    Item={
                        'key': requestJSON['id'],
                        'price': Decimal(str(requestJSON['price'])),
                        'name': requestJSON['name']
                    })
        body = 'POST item ' + requestJSON['id']

    body = json.dumps(body)
    res = {
        "statusCode": statusCode,
        "headers": {
            "Content-Type": "application/json"
        },
        "body": body
    }
    return res
This Lambda function terminates a trivial GET and PUT RESTful endpoint (themselves hosted by an AWS API Gateway). Further, it demonstrates dependent tracing into AWS DynamoDB.
In keeping with our best practice to use OTel when available, let's use OTel-based APM! It is well supported for AWS Lambda, and AWS has produced a singular layer comprising both the Python OTel Agent as well as an OTel Collector. I used this blog for reference.
From your Lambda function page,
- Select
Layers>Add layer - Select
Choose a layer>Specify an ARN - Use ARN
arn:aws:lambda:us-east-2:901920570463:layer:aws-otel-python-amd64-ver-1-24-0:1- you can find the latest release for your target language here
You will need to set certain environmental variables for your Lambda execution environment:
From your Lambda function page,
- Select
Configuration - Select
Environment variables - Select
Edit
And then select Add environment variable for each of the following:
AWS_LAMBDA_EXEC_WRAPPER=/opt/otel-instrument- tells Lambda to wrap execution using the OTel auto-instrumentation Agent
OPENTELEMETRY_COLLECTOR_CONFIG_FILE=/var/task/collector.yaml- tells ADOT where to find the OTel Collector configuration file (we will be creating this shortly)
- Select
Configuration - Select
General configuration - Select
Edit - Set
Timeoutto9seconds (to allow ADOT layer time to flush trace data)
- Note: for external tracing, there is no not need to turn on Active Tracing (X-Ray)
To export OTel telemetry to Elastic, we need to configure the OTel Collector which is part of ADOT.
First, you will need to obtain your Elasticsearch endpoint and APM secret token. You can do this by:
- Login to Elasticsearch/Kibana
- Navigate to
Observability>APM - Select
Add data(upper right) - Select
OpenTelemetry
From here, make note of the values of:
OTEL_EXPORTER_OTLP_ENDPOINTOTEL_EXPORTER_OTLP_HEADERS
We now need to create an OTel Collector configuration file in AWS Lambda.
- Select
Code(You should be in the directory of your Lambda function) - Select Menu
File>New File
Paste the following into the editor:
# collector.yaml in the root directory
# Set an environemnt variable 'OPENTELEMETRY_COLLECTOR_CONFIG_FILE' to
# '/var/task/collector.yaml'

receivers:
  otlp:
    protocols:
      grpc:
      http:

exporters:
  logging:
    verbosity: detailed
  otlp/elastic:
    # Elastic APM server https endpoint without the "https://" prefix
    endpoint: "abc123.apm.us-central1.gcp.cloud.es.io:443"
    headers:
      # Elastic APM Server secret token
      Authorization: "Bearer xyz123"

service:
  pipelines:
    traces:
      receivers: [otlp]
      exporters: [otlp/elastic]
    metrics:
      receivers: [otlp]
      exporters: [otlp/elastic]
    logs:
      receivers: [otlp]
      exporters: [otlp/elastic]
- where
endpoint:should be the value ofOTEL_EXPORTER_OTLP_ENDPOINT(copied above), but WITHOUT thehttps://prefix - where
headers/Authorization:should be theBearer xyz123portion ofOTEL_EXPORTER_OTLP_HEADERS(copied above); do not includeAuthorization=
Now save the file:
- Select Menu
File>Save - Name the file
collector.yaml
Assuming you have provisioned an appropriate API Gateway endpoint (with attachment to this Lambda function), you can manually invoke it via something like:
curl -X "PUT" -H "Content-Type: application/json" -d "{\"id\": \"123\", \"price\": 12345, \"name\": \"myitem\"}" https://abc123.execute-api.us-east-2.amazonaws.com/items
To export Lambda metrics (and metrics from other supporting services, like API Gateway), we will need an Elastic Agent. The Agent needn't run within AWS/EC2, although doing so allows you to use IAM authentication rather than API secrets.
Create an appropriately sized EC2 instance to host Elastic Agent. Depending on the volume of data, you can use anything from an e2.micro on up. For this PoC, I used a t2.small instance.
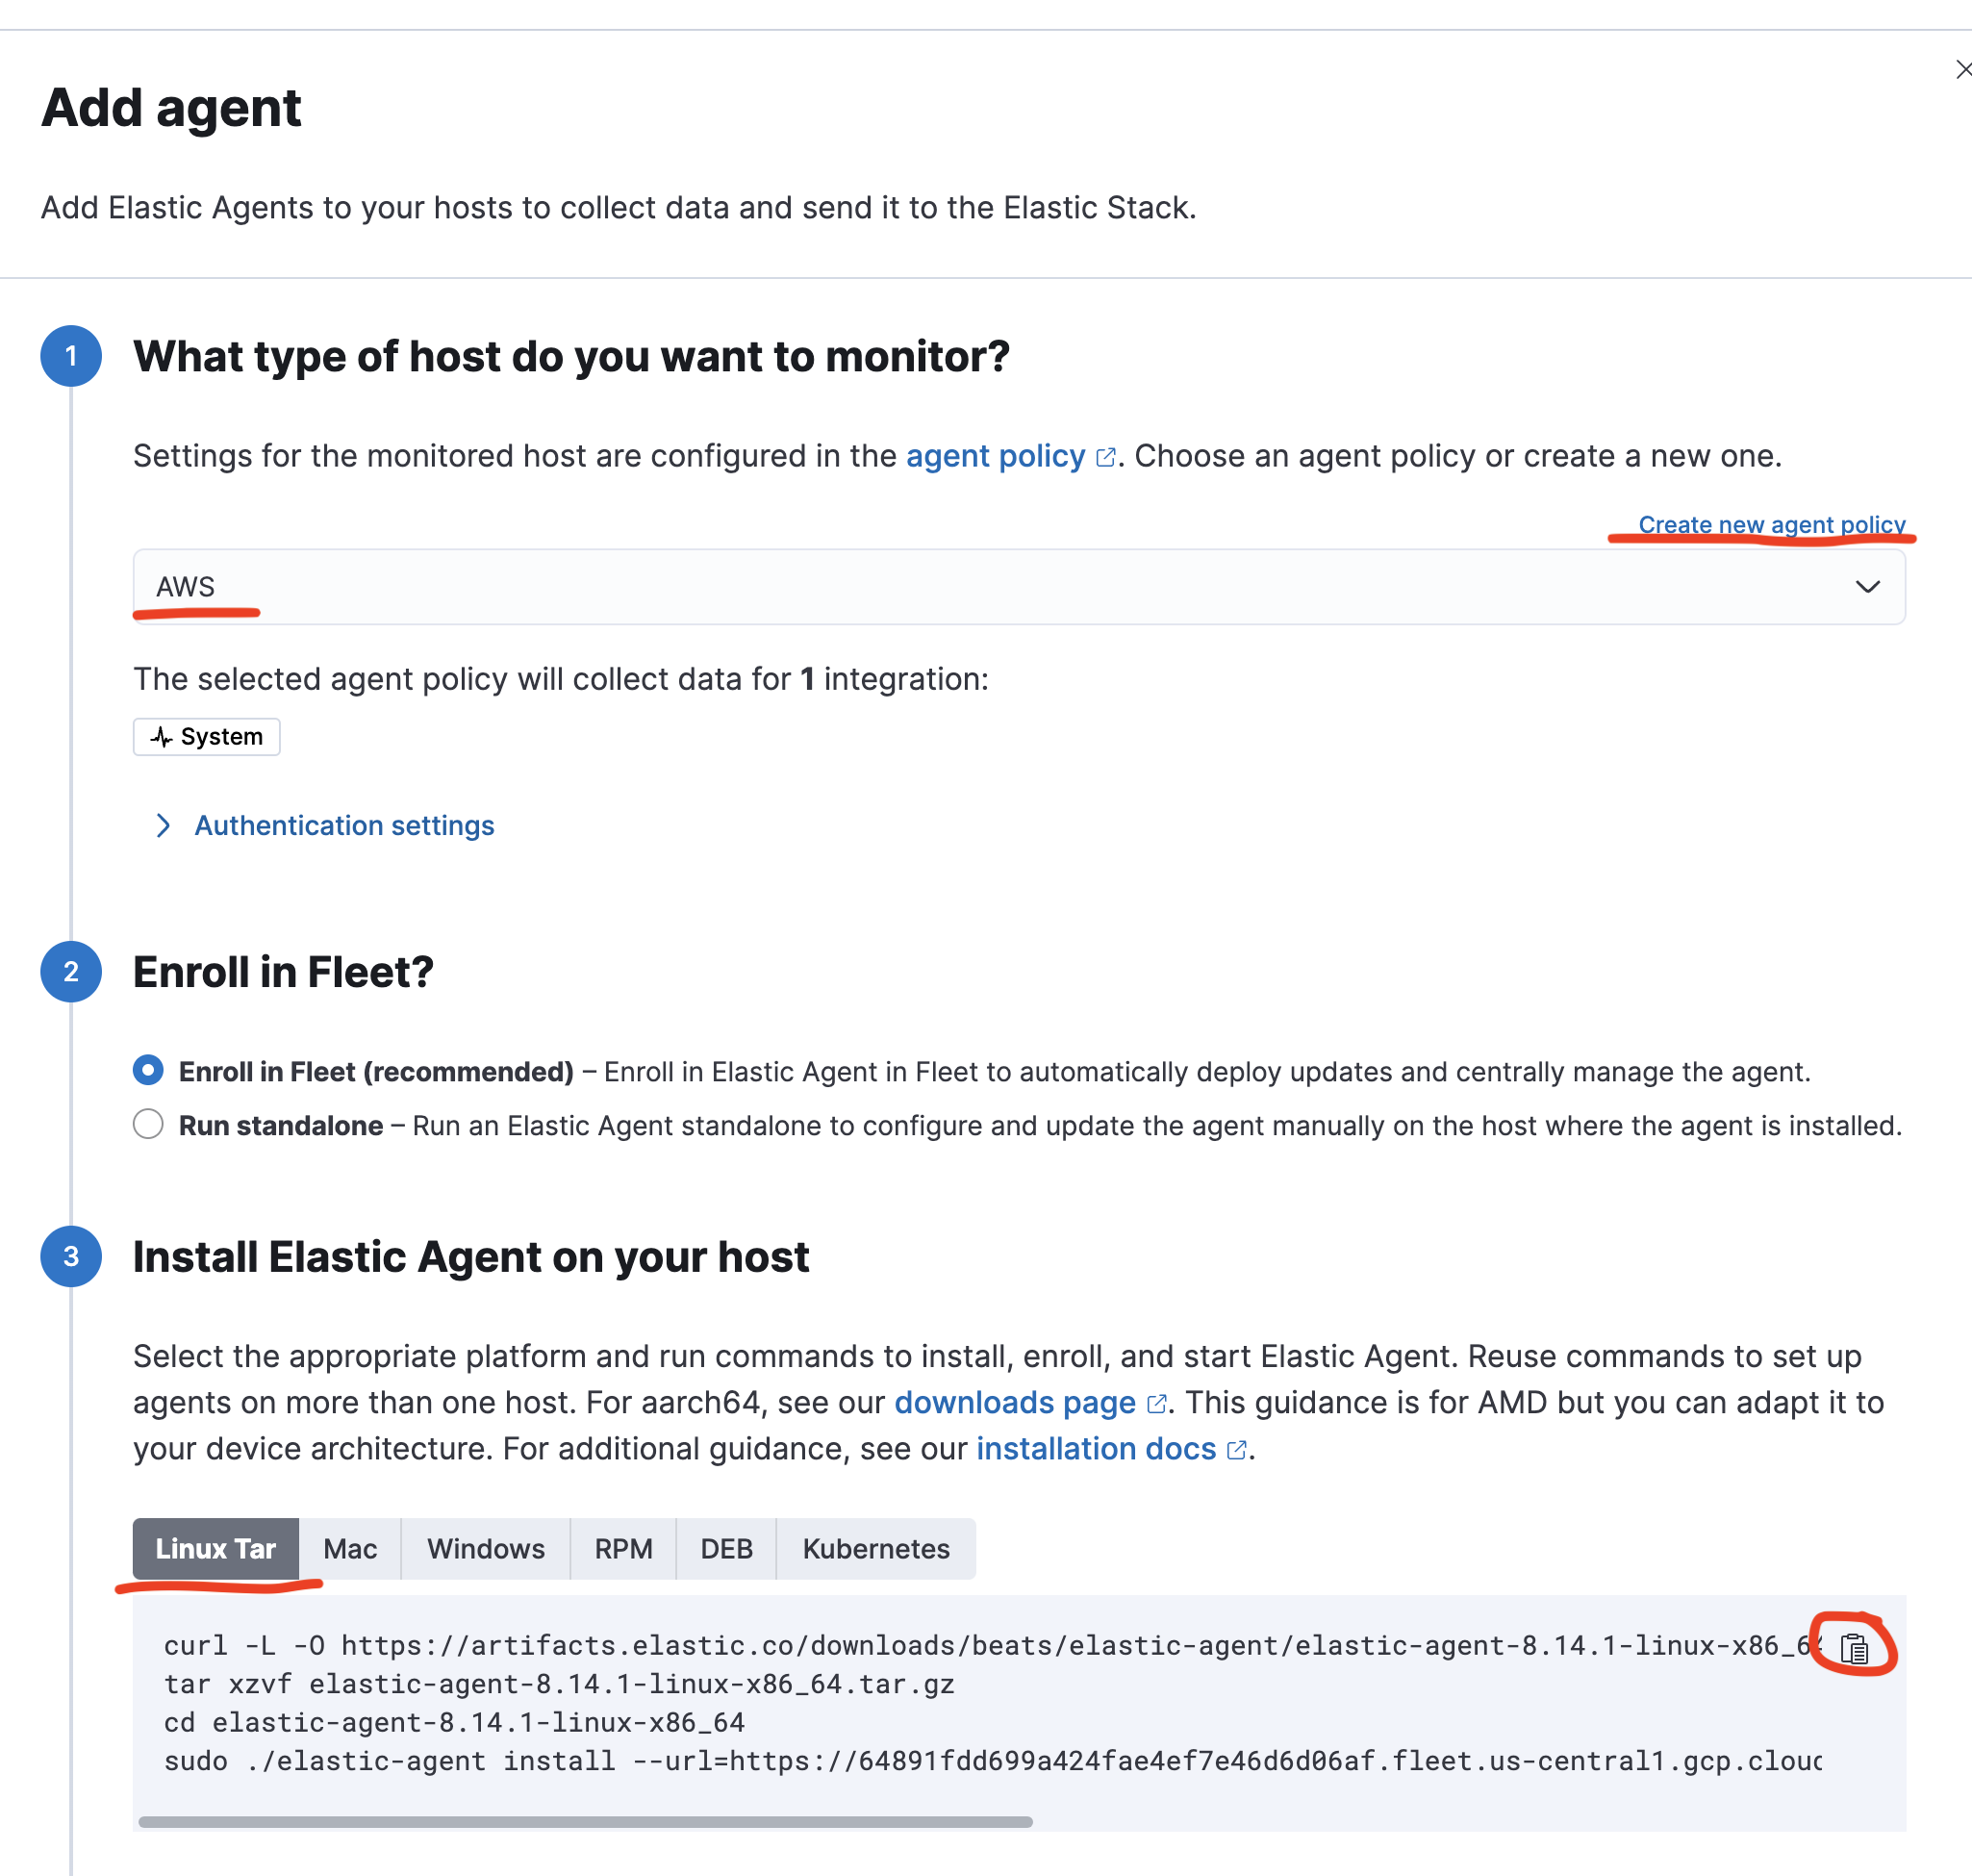
- Select
Management>Fleet - Select
Add agent - Select
Create a new agent policy - Name it
AWS - Select
Create policy - Select
Enroll in Fleet (recommended) - Select
Linux Tar - SSH into your EC2 instance
- Copy/paste the commands to install Elastic Agent
- Wait for
Confirm agent enrollmentto confirm telemetry reception
- Select
Management>Integrations - Search for integrations >
AWS - Select
AWS - Select
Add AWS
Use appropriately configured IAM for your EC2 instance or create an Access Key ID and Secret Access Key from your AWS Profile. See here for more information.
If you are configuring for a AWS Access Key, select Third-party service as the Use case
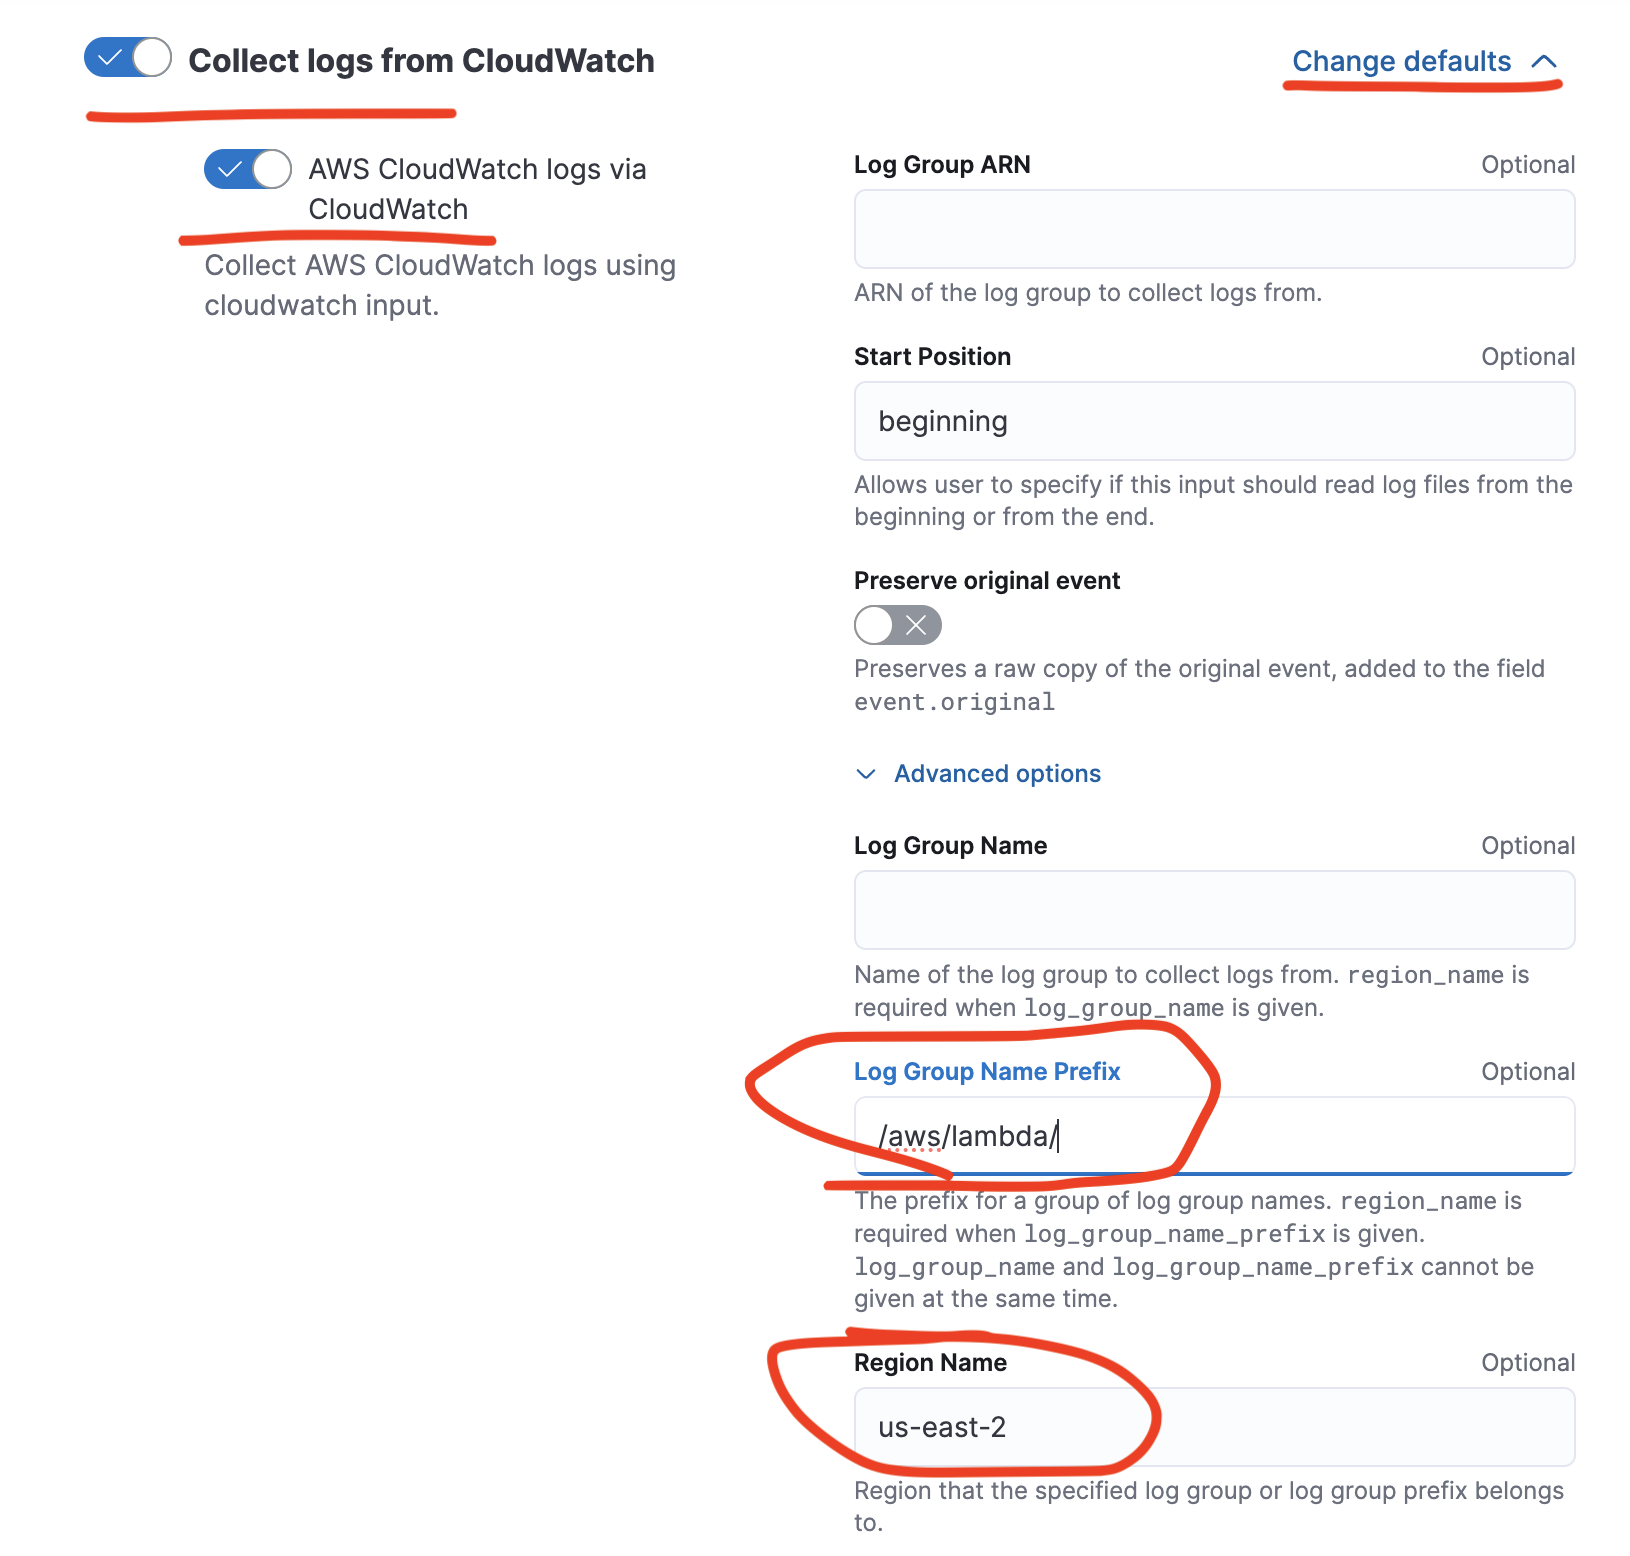
Enable collection of at least:
Collect logs from CloudWatch- Expand
Change defaults - Here, I'm looking to just collect Lambda logs, so set
Log Group Name Prefixto/aws/lambda/. You will also then need to set the region this Lambda is running in; for me, that'sRegion Nameset tous-east-2. You could also collect by Log Group ARN. - Set
Dataset name=aws.cloudwatch_logs
- Expand
Collect Lambda metrics
and potentially disable all other features (for now)
To allow correlation of Lambda logs from Cloudwatch and Lambda metrics into the APM UX, we need to ensure service.name is set appropriately. We can do this using Elastic Ingest Pipelines.
You can create Ingest Pipelines using our UI (Management > Stack Management > Ingest Pipelines) or via API using DevTools. Since we are simply deploying pipelines I've already developed, I would suggest using DevTools (Management > DevTools).
This pipeline will extract the service name from the awscloudwatch.log_group and save it to a new field service.name.
PUT _ingest/pipeline/logs-aws.cloudwatch_logs@custom
{
  "processors": [
    {
      "dissect": {
        "field": "awscloudwatch.log_group",
        "pattern": "/aws/lambda/%{service.name}",
        "ignore_missing": true,
        "ignore_failure": true
      }
    }
  ]
}
This pipeline will extract the service name from the aws.dimensions.FunctionName and save it to a new field service.name.
PUT _ingest/pipeline/metrics-aws.lambda@custom
{
  "processors": [
    {
      "set": {
        "field": "service.name",
        "copy_from": "aws.dimensions.FunctionName",
        "ignore_failure": true
      }
    }
  ]
}
Exercise your Lambda using a test or a real REST (via API Gateway) call in order to generate some exemplary data into Elasticsearch.
- Find your Lambda service in Elastic APM (
Observability>APM) - Select Lambda service
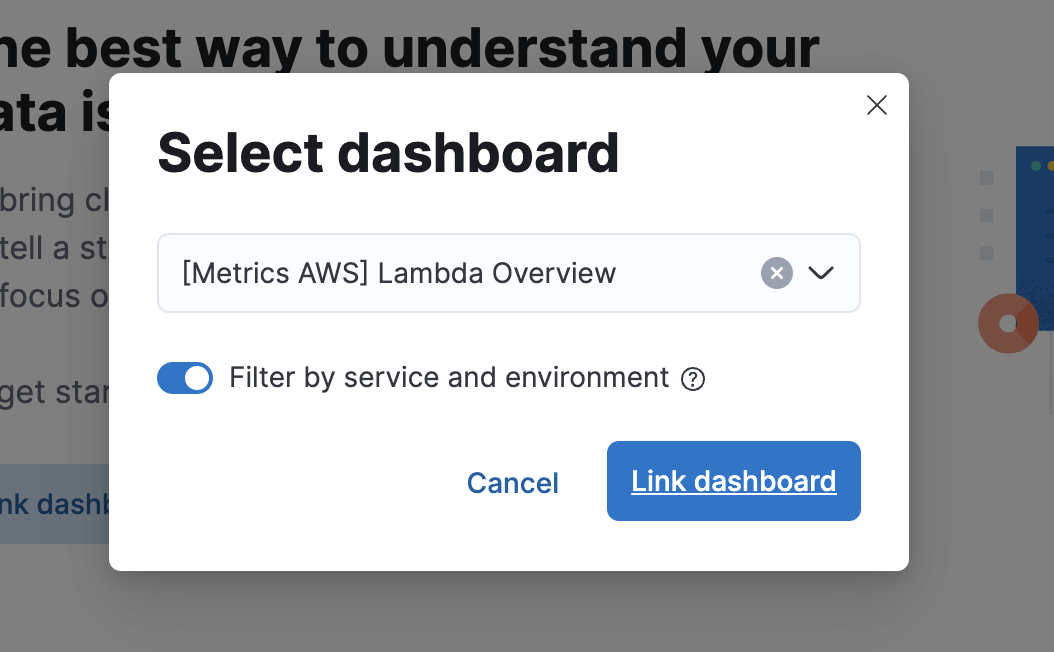
- Select
Dashboardstab - Select
Link dashboard - Select dashboard
[Metrics AWS] Lambda OverviewFilter by service and environmentenabled
Exercise your Lambda through RESTful calls.
Logsin the APM UX links to your Lambda logs (coming via CloudWatch > Elastic Agent)Dashboardslinks to your Lambda metrics (you could create a custom dashboard which potentially includes elements of AWS Lambda metrics, API Gateway metrics, and Elastic Synthetics metrics)Transactionswill show transactions into yourlambda_function.lambda_handler- note
GETandPUTtransactions are coupled together since they are handled by a singular Python entry point - note that tracing extends into our dependencies (in this example, DynamoDB); if you call into other instrumented functions, you will see distributed traces into those functions as well
- note


