This repository analyzes driving data recorded using the STARS framework. The data was recorded using the AuNa Repository.
This project is a Gradle project with a shipped gradle wrapper. To execute the analysis simply execute:
- Linux/Mac:
./gradlew run - Windows:
./gradlew.bat run
After the analysis is finished you can find the results in the analysis-result-logs sub-folder which will be
created during the analysis.
For each execution of the analysis pipeline a sub-folder with the start date and time ist created. In it, each metric of the analysis has its own sub-folder. The analysis separates the results of each metric into different categories with different detail levels.
*-severe.txtlists all failed metric results*-warning.txtlists all warnings that occurred during analysis*-info.txtcontains the summarized result of the metric*-fine.txtcontains a more detailed result of the metric*-finer.txtcontains all possible results of the metric*-finest.txtcontains all possible results of the metric including meta information
The scenario data has the following properties:
robot width: 0.2mrobot length: 0.4mtrack width: 1.4m (each 0.7m orthogonal from the center)velocity goal: Depends on the data set, is either 3m/s or 0.8 m/sstandstill distance: 1.25mtime distance: 0.25starget distance at any time:standstill distance+time distance*speed
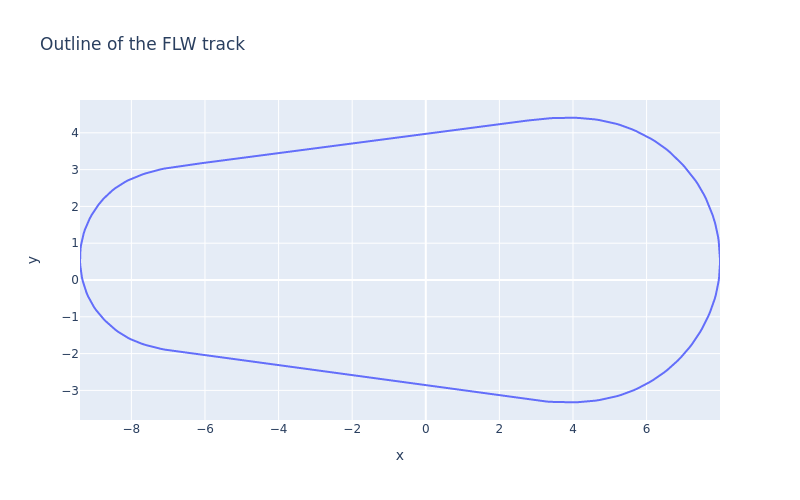
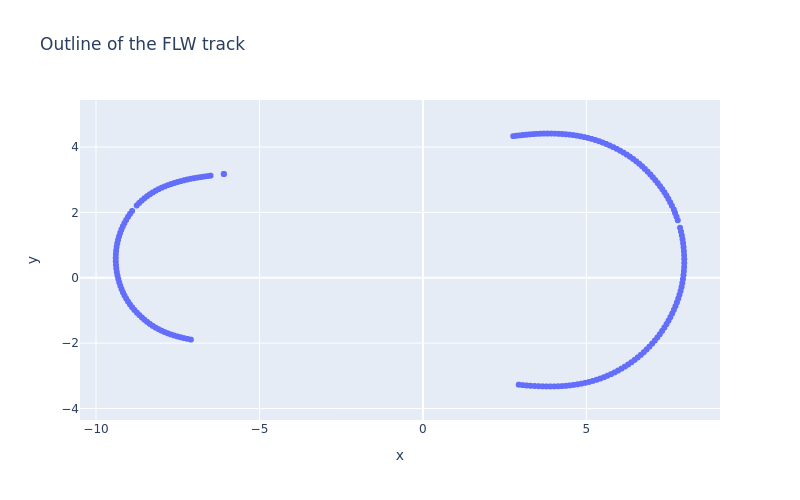
As it is visible in the scatter plot above, the straight parts of the track are only mapped by two points. Therefore, we extracted these 4 coordinates for the two straights. We identified the following points:
- (x=-7.09735979561802,y=-1.89133616892839) (lower left corner)
- (x=2.93225065116357, y=-3.27073098672295) (lower right corner)
- (x=-6.09016702472381,y=3.17436982808834) (upper left corner)
- (x=2.7643231790252, y=4.33303506387608) (upper right corner)
Here you can find the domain model that is used for this experiments. All interfaces marked in green come from the STARS framework and are implemented with concrete classes in this repository. The left-hand part of the diagram displays the structure of the messages that are sent by the platooning vehicles. The right-hand part of the diagram shows all classes that are necessary for our analysis.
If you want to use our proposed Git Hooks you can execute the following command:
git config --local core.hooksPath .githooks
