This notebook is an example data analysis and visualization of a fictional starbucks dataset.
import pandas as pd
import matplotlib.pyplot as plt
import numpy as np
import seaborn as sns

sns.set_theme(style = "darkgrid")data = pd.read_csv("starbucks_data.csv",sep=';')
data.head(5)| ID | Beverage_category | Beverage | Beverage_prep | Calories | Total Fat (g) | Total Carbohydrates (g) | Sugars (g) | Protein (g) | Caffeine (mg) | |
|---|---|---|---|---|---|---|---|---|---|---|
| 0 | 4 | Classic Espresso Drinks | Caffè Latte | Short Nonfat Milk | 70.0 | 0.1 | 75.0 | 9.0 | 6.0 | 75.0 |
| 1 | 5 | Classic Espresso Drinks | Caffè Latte | 2% Milk | 100.0 | 3.5 | 85.0 | 9.0 | 6.0 | 75.0 |
| 2 | 6 | Classic Espresso Drinks | Caffè Latte | Soymilk | 70.0 | 2.5 | 65.0 | 4.0 | 5.0 | 75.0 |
| 3 | 7 | Classic Espresso Drinks | Caffè Latte | Tall Nonfat Milk | 100.0 | 0.2 | 120.0 | 14.0 | 10.0 | 75.0 |
| 4 | 8 | Classic Espresso Drinks | Caffè Latte | 2% Milk | 150.0 | 6.0 | 135.0 | 14.0 | 10.0 | 75.0 |
| Column name | Description | Example |
|---|---|---|
| ID | The unique identifier of the drink, integer. | 4 |
| Beverage_category | The category of the drink, text format. | Classic Espresso Drinks |
| Beverage | The name of the drink, text format. | Caffè Latte |
| Beverage_prep | The preparation method of the drink, text format. | Short Nonfat Milk |
| Calories | The calorie content of the drink, floating point number. | 70.0 |
| Total Fat (g) | The total fat content of the drink in grams, floating point number. | 0.1 |
| Total Carbohydrates (g) | The total carbohydrate content of the drink in grams, floating point number. | 75.0 |
| Sugars (g) | The sugar content of the drink in grams, floating point number. | 9.0 |
| Protein (g) | The protein content of the drink in grams, floating point number. | 6.0 |
| Caffeine (mg) | The caffeine content of the drink in milligrams, floating point number. | 75.0 |
data.info()
data.describe()
<class 'pandas.core.frame.DataFrame'>
RangeIndex: 52 entries, 0 to 51
Data columns (total 10 columns):
# Column Non-Null Count Dtype
--- ------ -------------- -----
0 ID 52 non-null int64
1 Beverage_category 52 non-null object
2 Beverage 52 non-null object
3 Beverage_prep 52 non-null object
4 Calories 40 non-null float64
5 Total Fat (g) 39 non-null float64
6 Total Carbohydrates (g) 39 non-null float64
7 Sugars (g) 39 non-null float64
8 Protein (g) 39 non-null float64
9 Caffeine (mg) 37 non-null float64
dtypes: float64(6), int64(1), object(3)
memory usage: 4.2+ KB
| ID | Calories | Total Fat (g) | Total Carbohydrates (g) | Sugars (g) | Protein (g) | Caffeine (mg) | |
|---|---|---|---|---|---|---|---|
| count | 52.000000 | 40.000000 | 39.000000 | 39.000000 | 39.000000 | 39.000000 | 37.000000 |
| mean | 30.884615 | 181.250000 | 3.043590 | 117.948718 | 26.794872 | 12.871795 | 111.486486 |
| std | 16.941252 | 286.232714 | 2.742434 | 45.993677 | 70.235386 | 16.359738 | 38.003378 |
| min | 4.000000 | 50.000000 | 0.100000 | 40.000000 | 3.000000 | 3.000000 | 75.000000 |
| 25% | 16.750000 | 97.500000 | 0.300000 | 80.000000 | 8.000000 | 6.000000 | 75.000000 |
| 50% | 29.500000 | 120.000000 | 3.000000 | 120.000000 | 14.000000 | 9.000000 | 75.000000 |
| 75% | 46.250000 | 175.000000 | 5.000000 | 150.000000 | 21.500000 | 12.000000 | 150.000000 |
| max | 61.000000 | 1900.000000 | 9.000000 | 220.000000 | 450.000000 | 90.000000 | 150.000000 |
We can see that there are some missing values, we will replace these with the average of the given column after filtering out the outliers based on the standard deviation.
# Deleting duplicates
data = data.drop_duplicates()

# Filtering out the outliers
data = data[np.abs(data["Calories"]-data["Calories"].mean())<=(3*data["Calories"].std())]
data = data[np.abs(data["Total Fat (g)"]-data["Total Fat (g)"].mean())<=(3*data["Total Fat (g)"].std())]
data = data[np.abs(data["Total Carbohydrates (g)"]-data["Total Carbohydrates (g)"].mean())<=(3*data["Total Carbohydrates (g)"].std())]
data = data[np.abs(data["Sugars (g)"]-data["Sugars (g)"].mean())<=(3*data["Sugars (g)"].std())]
data = data[np.abs(data["Protein (g)"]-data["Protein (g)"].mean())<=(3*data["Protein (g)"].std())]
data = data[np.abs(data["Caffeine (mg)"]-data["Caffeine (mg)"].mean())<=(3*data["Caffeine (mg)"].std())]

# Filling missing values with the mean
data['Calories'].fillna(data['Calories'].mean(), inplace=True)
data['Total Fat (g)'].fillna(data['Total Fat (g)'].mean(), inplace=True)
data['Total Carbohydrates (g)'].fillna(data['Total Carbohydrates (g)'].mean(), inplace=True)
data['Sugars (g)'].fillna(data['Sugars (g)'].mean(), inplace=True)
data['Protein (g)'].fillna(data['Protein (g)'].mean(), inplace=True)
data['Caffeine (mg)'].fillna(data['Caffeine (mg)'].mean(), inplace=True)

# Because Beverage_category contains only 1 value, we drop it
data = data.drop(columns=['Beverage_category'])data| ID | Beverage | Beverage_prep | Calories | Total Fat (g) | Total Carbohydrates (g) | Sugars (g) | Protein (g) | Caffeine (mg) | |
|---|---|---|---|---|---|---|---|---|---|
| 0 | 4 | Caffè Latte | Short Nonfat Milk | 70.0 | 0.1 | 75.0 | 9.0 | 6.0 | 75.0 |
| 1 | 5 | Caffè Latte | 2% Milk | 100.0 | 3.5 | 85.0 | 9.0 | 6.0 | 75.0 |
| 2 | 6 | Caffè Latte | Soymilk | 70.0 | 2.5 | 65.0 | 4.0 | 5.0 | 75.0 |
| 3 | 7 | Caffè Latte | Tall Nonfat Milk | 100.0 | 0.2 | 120.0 | 14.0 | 10.0 | 75.0 |
| 4 | 8 | Caffè Latte | 2% Milk | 150.0 | 6.0 | 135.0 | 14.0 | 10.0 | 75.0 |
| 5 | 9 | Caffè Latte | Soymilk | 110.0 | 4.5 | 105.0 | 6.0 | 8.0 | 75.0 |
| 6 | 10 | Caffè Latte | Grande Nonfat Milk | 130.0 | 0.3 | 150.0 | 18.0 | 13.0 | 150.0 |
| 8 | 12 | Caffè Latte | Soymilk | 150.0 | 5.0 | 130.0 | 8.0 | 10.0 | 150.0 |
| 9 | 13 | Caffè Latte | Venti Nonfat Milk | 170.0 | 0.4 | 190.0 | 23.0 | 16.0 | 150.0 |
| 10 | 14 | Caffè Latte | 2% Milk | 240.0 | 9.0 | 220.0 | 22.0 | 16.0 | 150.0 |
| 11 | 15 | Caffè Latte | Soymilk | 190.0 | 7.0 | 170.0 | 11.0 | 13.0 | 150.0 |
| 24 | 28 | Vanilla Latte (Or Other Flavoured Latte) | Short Nonfat Milk | 100.0 | 0.1 | 70.0 | 18.0 | 6.0 | 75.0 |
| 25 | 29 | Vanilla Latte (Or Other Flavoured Latte) | 2% Milk | 130.0 | 3.5 | 80.0 | 17.0 | 6.0 | 75.0 |
| 26 | 30 | Vanilla Latte (Or Other Flavoured Latte) | Soymilk | 110.0 | 2.5 | 60.0 | 13.0 | 5.0 | 75.0 |
| 27 | 31 | Vanilla Latte (Or Other Flavoured Latte) | Tall Nonfat Milk | 150.0 | 0.2 | 110.0 | 27.0 | 9.0 | 75.0 |
| 28 | 32 | Vanilla Latte (Or Other Flavoured Latte) | 2% Milk | 200.0 | 5.0 | 125.0 | 27.0 | 9.0 | 75.0 |
| 29 | 33 | Vanilla Latte (Or Other Flavoured Latte) | Soymilk | 160.0 | 4.0 | 95.0 | 20.0 | 7.0 | 75.0 |
| 30 | 34 | Vanilla Latte (Or Other Flavoured Latte) | Grande Nonfat Milk | 200.0 | 0.3 | 140.0 | 35.0 | 12.0 | 150.0 |
| 31 | 35 | Vanilla Latte (Or Other Flavoured Latte) | 2% Milk | 250.0 | 6.0 | 150.0 | 35.0 | 12.0 | 150.0 |
| 32 | 36 | Vanilla Latte (Or Other Flavoured Latte) | Soymilk | 210.0 | 5.0 | 120.0 | 26.0 | 9.0 | 150.0 |
| 34 | 38 | Vanilla Latte (Or Other Flavoured Latte) | 2% Milk | 320.0 | 9.0 | 200.0 | 44.0 | 15.0 | 150.0 |
| 35 | 39 | Vanilla Latte (Or Other Flavoured Latte) | Soymilk | 270.0 | 7.0 | 160.0 | 33.0 | 12.0 | 150.0 |
| 37 | 45 | Cappuccino | 2% Milk | 80.0 | 3.0 | 70.0 | 7.0 | 5.0 | 75.0 |
| 38 | 46 | Cappuccino | Soymilk | 50.0 | 1.5 | 40.0 | 3.0 | 3.0 | 75.0 |
| 39 | 47 | Cappuccino | Tall Nonfat Milk | 60.0 | 0.1 | 70.0 | 8.0 | 6.0 | 75.0 |
| 40 | 48 | Cappuccino | 2% Milk | 90.0 | 3.5 | 80.0 | 8.0 | 6.0 | 75.0 |
| 41 | 49 | Cappuccino | Soymilk | 70.0 | 3.0 | 65.0 | 4.0 | 5.0 | 75.0 |
| 43 | 51 | Cappuccino | 2% Milk | 120.0 | 4.0 | 100.0 | 10.0 | 8.0 | 150.0 |
| 45 | 53 | Cappuccino | Venti Nonfat Milk | 110.0 | 0.2 | 120.0 | 14.0 | 10.0 | 150.0 |
| 46 | 54 | Cappuccino | 2% Milk | 150.0 | 6.0 | 135.0 | 14.0 | 10.0 | 150.0 |
| 47 | 55 | Cappuccino | Soymilk | 120.0 | 4.5 | 110.0 | 7.0 | 9.0 | 150.0 |
| 48 | 58 | Skinny Latte (Any Flavour) | Short Nonfat Milk | 60.0 | 0.1 | 80.0 | 8.0 | 6.0 | 75.0 |
| 50 | 60 | Skinny Latte (Any Flavour) | Grande Nonfat Milk | 120.0 | 0.3 | 160.0 | 16.0 | 12.0 | 150.0 |
| 51 | 61 | Skinny Latte (Any Flavour) | Venti Nonfat Milk | 160.0 | 0.3 | 200.0 | 21.0 | 15.0 | 150.0 |
plt.figure(figsize=(12, 6))
sns.barplot(x='Beverage', y='Caffeine (mg)', data=data)
plt.title('Caffeine content in different beverages')
plt.xlabel('Beverage')
plt.ylabel('Caffeine Content (mg)')
plt.xticks(rotation=90)
plt.tight_layout()
plt.show()plt.figure(figsize=(12, 6))
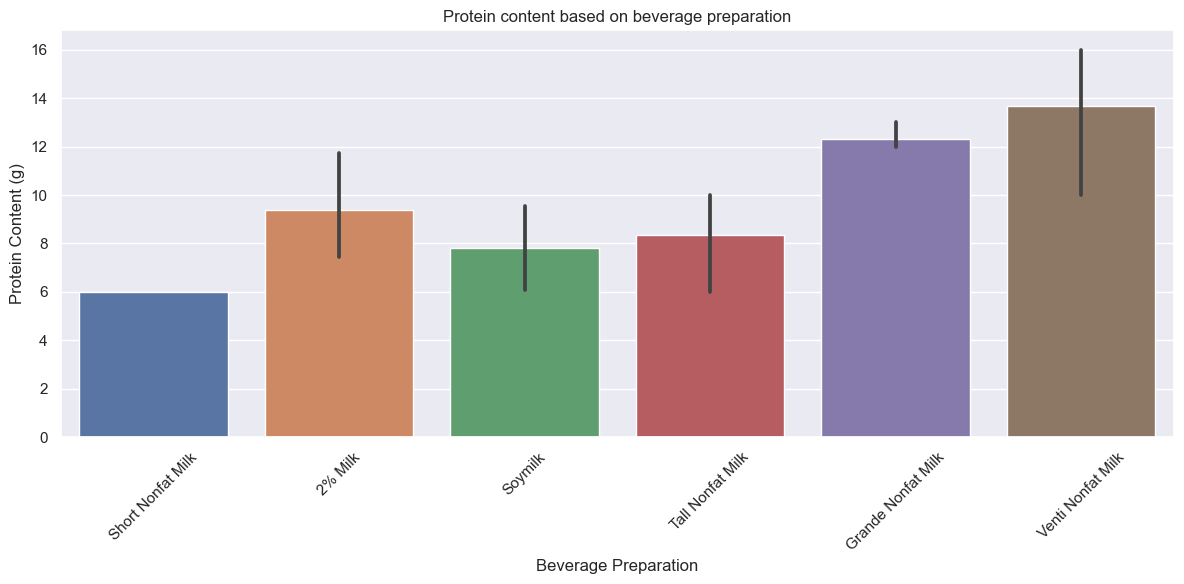
sns.barplot(x='Beverage_prep', y='Protein (g)', data=data)
plt.title('Protein content based on beverage preparation')
plt.xlabel('Beverage Preparation')
plt.ylabel('Protein Content (g)')
plt.xticks(rotation=45)
plt.tight_layout()
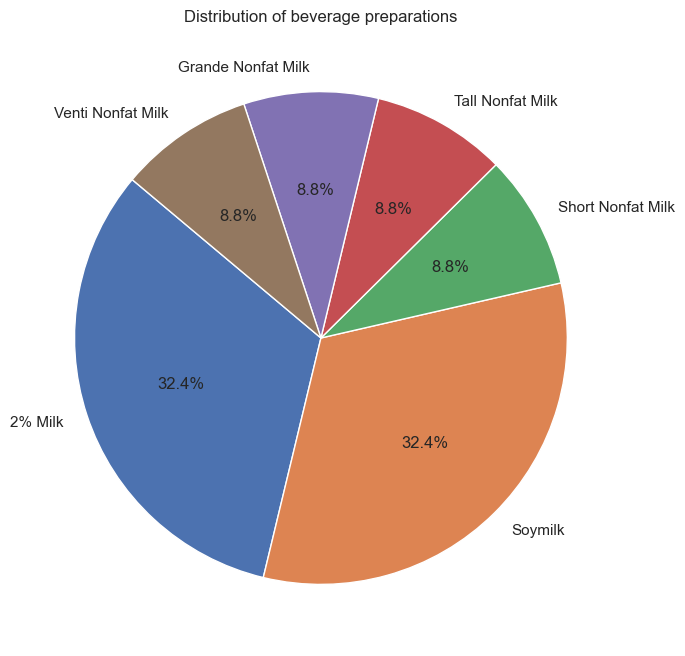
plt.show()beverage_prep_counts = data['Beverage_prep'].value_counts()
plt.figure(figsize=(10, 8))
beverage_prep_counts.plot(kind='pie', autopct='%1.1f%%', startangle=140)
plt.title('Distribution of beverage preparations')
plt.ylabel('')
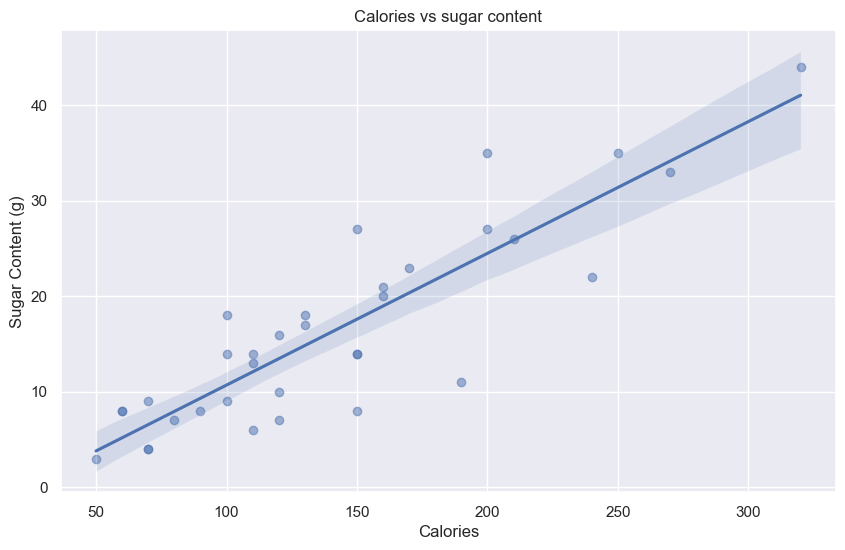
plt.show()plt.figure(figsize=(10, 6))
sns.regplot(x='Calories', y='Sugars (g)', data=data, scatter_kws={'alpha':0.5})
plt.title('Calories vs sugar content')
plt.xlabel('Calories')
plt.ylabel('Sugar Content (g)')
plt.show()
correlation = data['Calories'].corr(data['Sugars (g)'])
print('Correlation between calories and sugar content: ', correlation)Correlation between calories and sugar content: 0.8771254609018775


