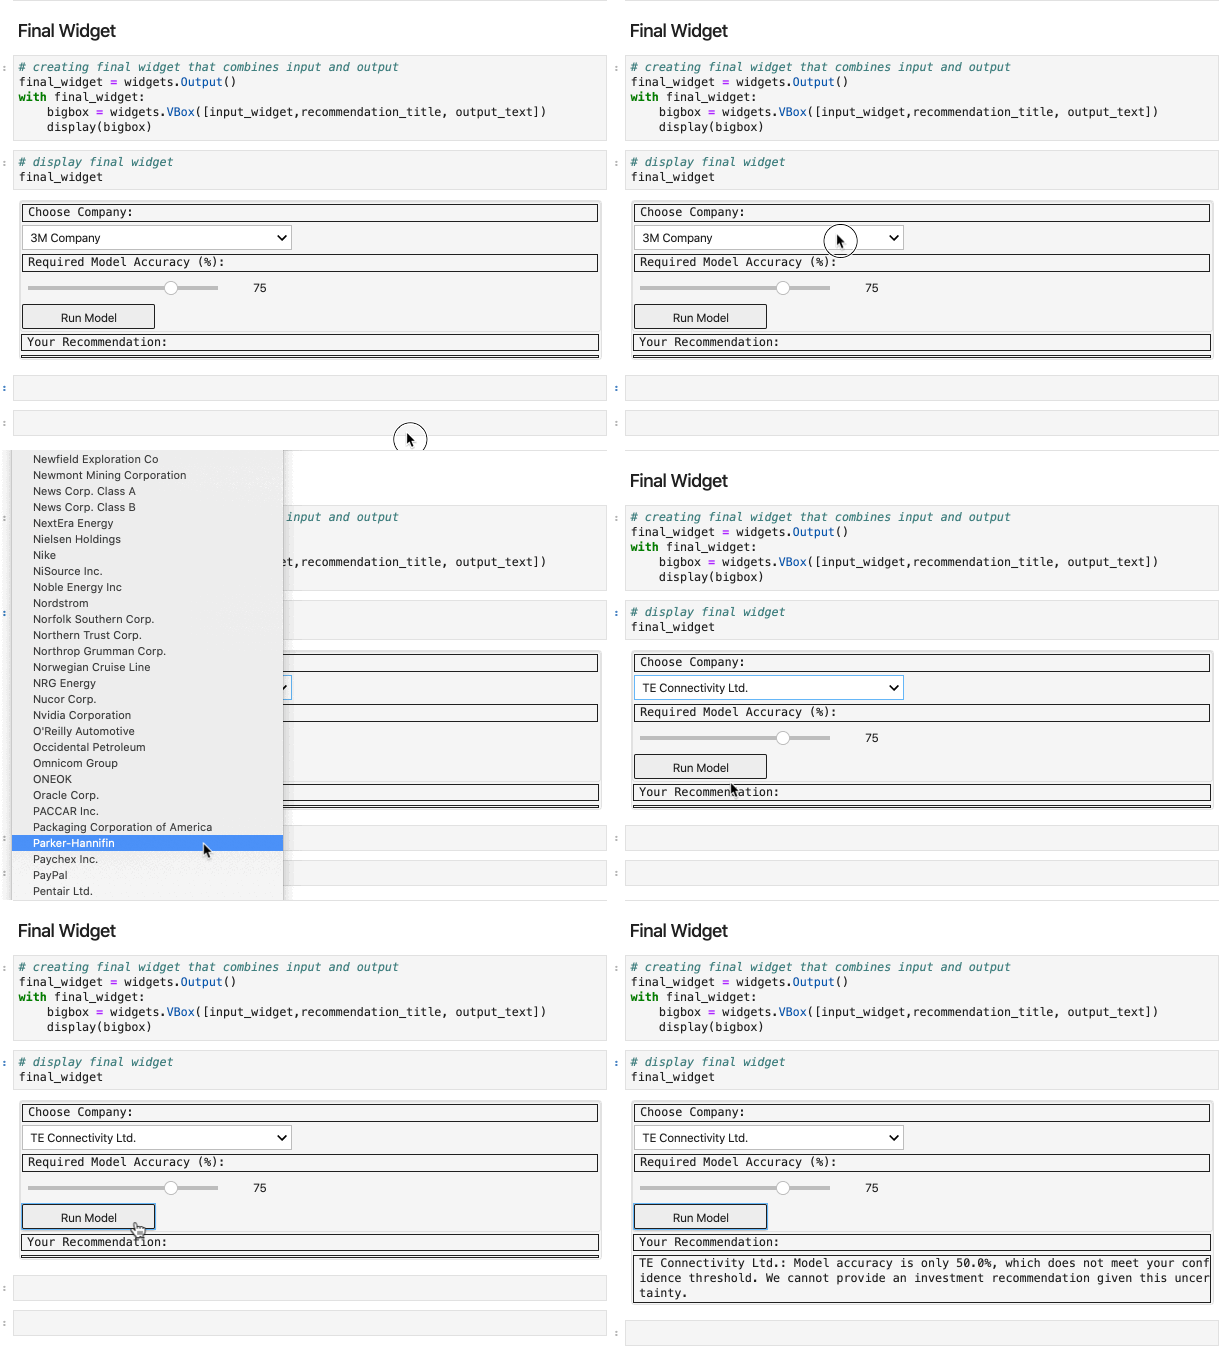
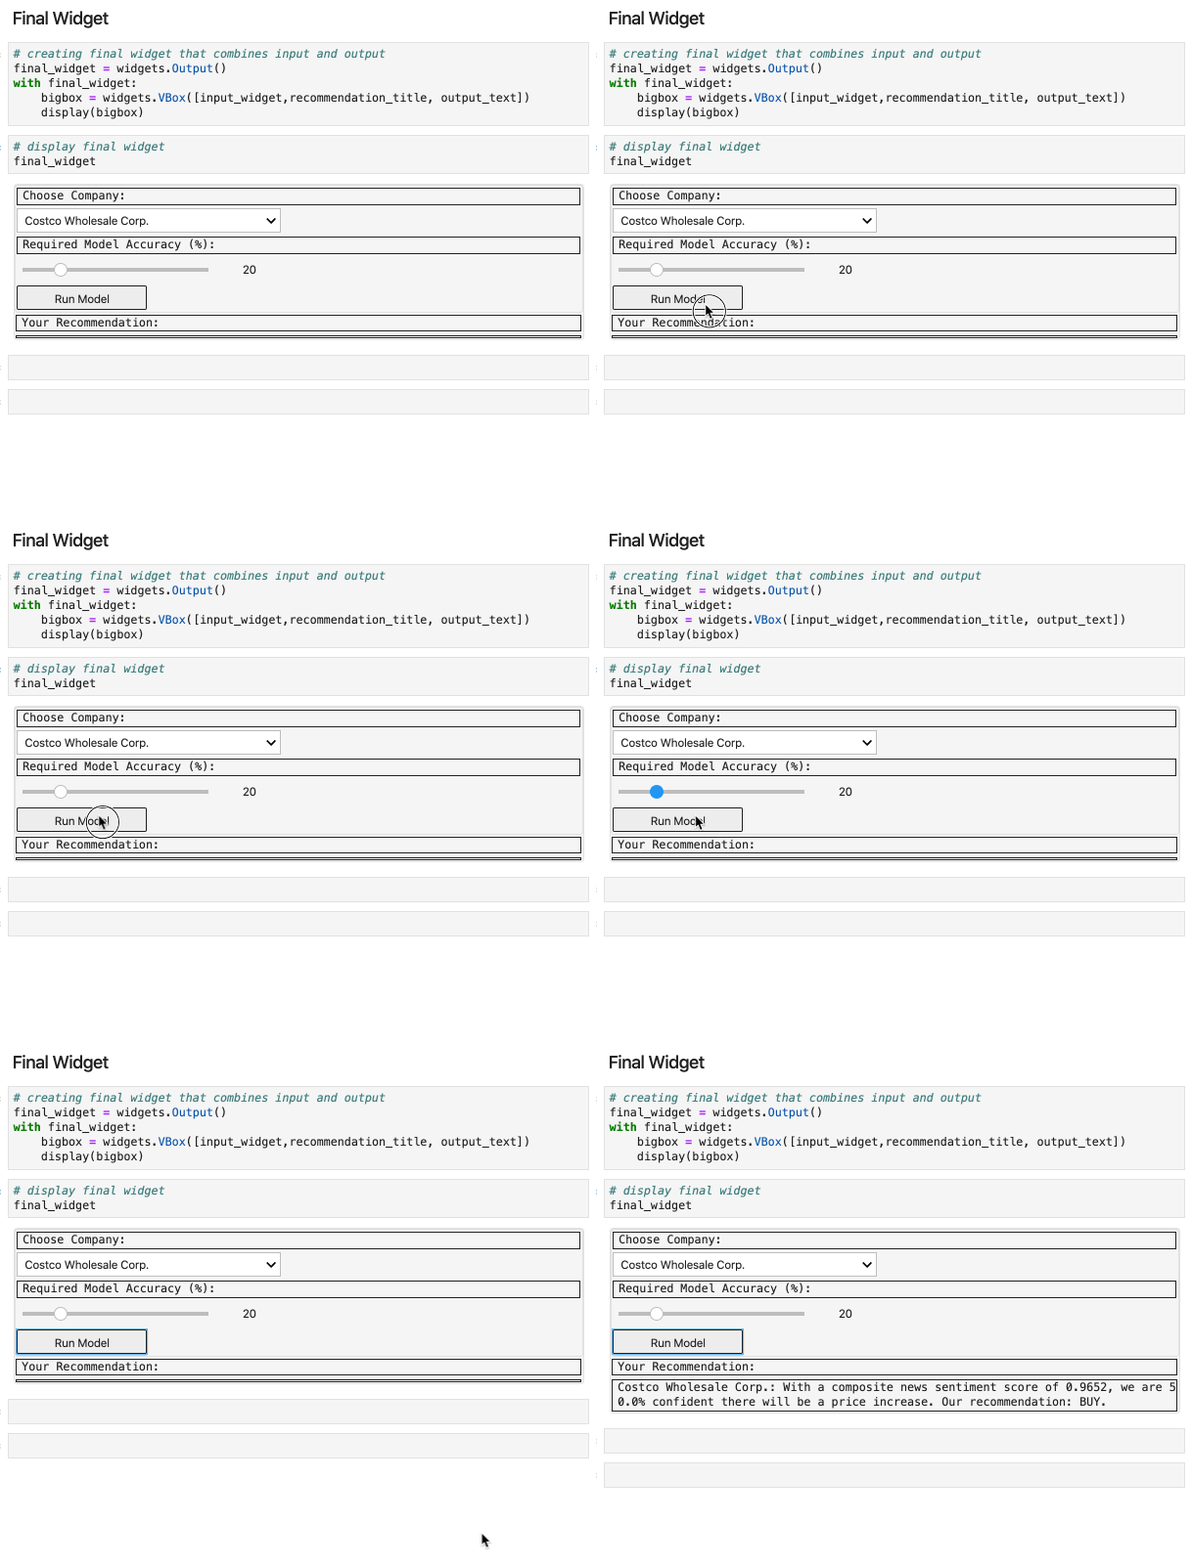
Program that allows a user to choose a company from the S&P 500 and run a logistic regression model to predict the price movement of this company's stock on the next trading day based on current sentiment (Vader) of Reuters news articles related to this company.
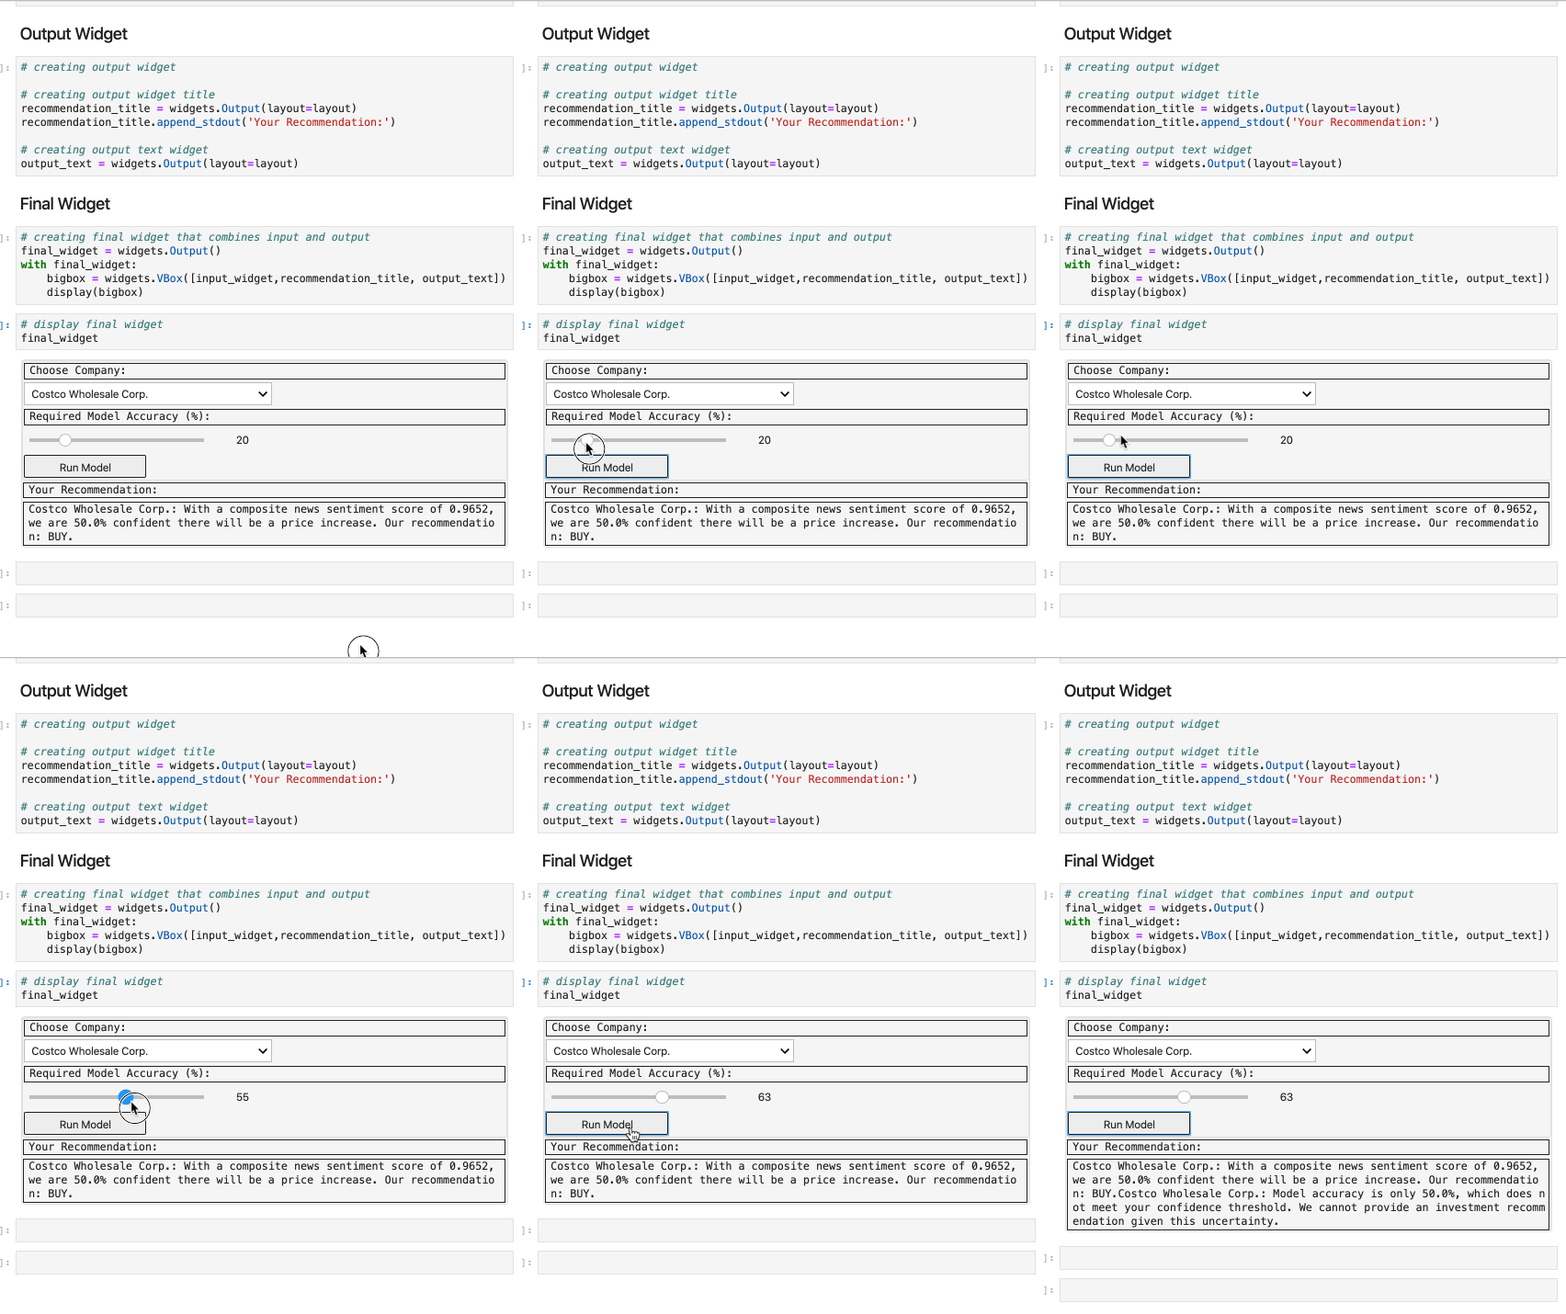
Please wait till the end for modified recommendation. Thank you for your patience!
Should there be access to hourly data on stock prices and news sentiments
Predict intraday movement in stock price between the current point in time and the end of the trading day to determine if a trade will be profitable by end of day. Machine learning model to be implemented that took in average news sentiment between h0 and h-24 (h = hour) as features, and intraday change in price between h0 and 4pm as the target on a rolling single-day basis historically .
NOTE: You must have active keys from the following APIs to run this program:
File to run: project_code > master_function
News Sentiments
-
Pulled 20 Articles per day from news API
- Could only pull for past 30 days
- Request limitations informed Dataframe Structure
-
Sentiments are placed into four categories:
- compound, positive, negative and neutral
-
Cleaned up articles using Lemmatization and stop word removal
- Marginally affected polarity score
- Applied Vader Sentiment Analyzer to return Polarity Score
Code (click me)
# function to tokenize text
def tokenizer(text):

    # cleaning text
    sw = set(stopwords.words('english'))
    regex = re.compile("[^a-zA-Z ]")
    re_clean = regex.sub('', text)
    words = word_tokenize(re_clean)
    lem = [lemmatizer.lemmatize(word) for word in words]
    tokens = [word.lower() for word in lem if word.lower() not in sw]

    # exporting tokenized words as output
    return tokens
</details> -
Ensure relevancy by including both the company and ticker
Code (click me)
# establishing keywords for news pull
keyword = f'{company} AND {ticker}'
Stock Prices
Breaks on weekends and holidays? Here we go!
Code
        # iterating through sentiment score / article DataFrame to...
        for index, row in dataframe.iterrows():

            # if daily return is null value for a given day - i.e. a non-trading day,
            if pd.isnull(row['return']):

                # then append polarity scores to their respective lists
                compound.append(row['compound'])
                positive.append(row['positive'])
                negative.append(row['negative'])
                neutral.append(row['neutral'])
                dataframe.drop(index=index, inplace=True)

            # if there was a return value - i.e. it was a trading day
            elif pd.notnull(row['return']):

                # The list of compound polarity scores will be empty if the stock was traded
                # on the previous day; therefore, move along.
                if len(compound) == 0:
                    pass

                # If the list is not empty, then at least one day prior was a non-trading
                # day. Append the current day's scores to the list and calculate the mean
                # for each score. Then replace the current day's polarity scores with the
                # average scores of today and previous non-trading days.
                else:
                    compound.append(row['compound'])
                    compound_mean = np.mean(compound)
                    compound = []

                    positive.append(row['positive'])
                    positive_mean = np.mean(positive)
                    positive = []

                    negative.append(row['negative'])
                    negative_mean = np.mean(negative)
                    negative = []

                    neutral.append(row['neutral'])
                    neutral_mean = np.mean(neutral)
                    neutral = []

                    dataframe.at[index, 'compound'] = compound_mean
                    dataframe.at[index, 'positive'] = positive_mean
                    dataframe.at[index, 'negative'] = negative_mean
                    dataframe.at[index, 'neutral'] = neutral_mean

            else:
                pass
Sample of Pre-model Dataframe
Featuring Lags
Lagging days feature is incorporated into the get_model_data function:
def get_model_data(company, ticker, lag=0):
 # shifting the return column up to adjust for a lag in stock reaction to sentiments
    final_df = cleaned_df(combined_df)
    final_df['return'] = final_df['return'].shift(-lag)
    final_df.dropna(inplace=True)
Limitations
-
Lack of affordable availability of historical intraday stock price data
- Had to change scope of project from intraday predictions to day over day
-
News API only allows for 30 days of historical articles to be pulled in
- Limited training data likely affects the accuracy of our model
Sources
- IEX Finance - historical stock price data
- News API / Reuters - historical news articles
We are prediction whether the closing price of a stock would rise (1) or fall (-1) compared to the closing price of the previous trading day. It is supervised machine learning as we have a target variable. A 30% training-and-testing split is applied to fit the models.
As of models, we used Logit regression and Balanced Random Forest Classifier to predict the probability of the binary outcome.
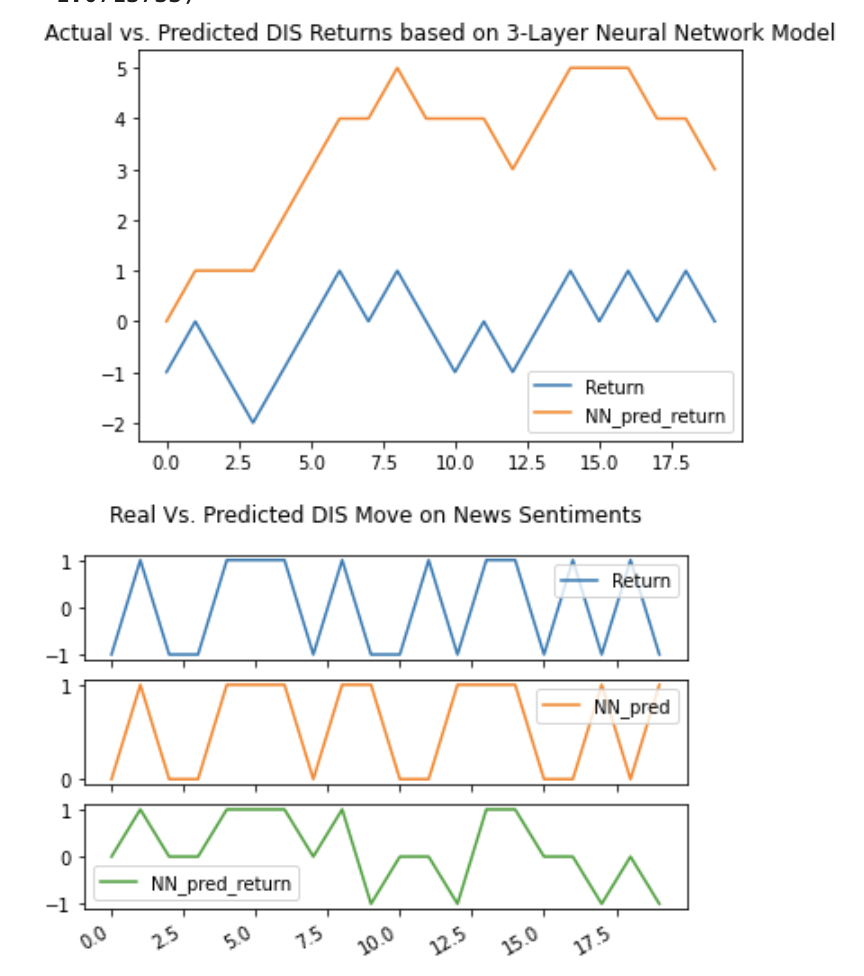
Other models used include LSTM Sequential and 3-Layer Neural Network.
Data for News Sentiments
Logit, Balanced Random Forest and Miscellaneous Classifiers:
For Neural Network Sequential and LSTM Models:
Based on 31 days of data for Disney (DIS): 3/15/2020 to 4/15/2020
Note: Changes on test statistics based on live data may lead to different choice of models.
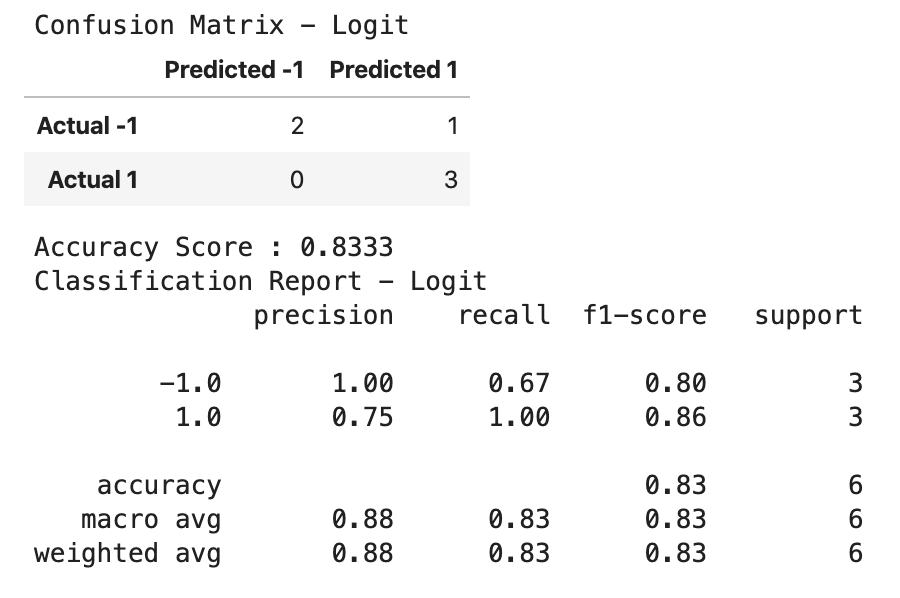
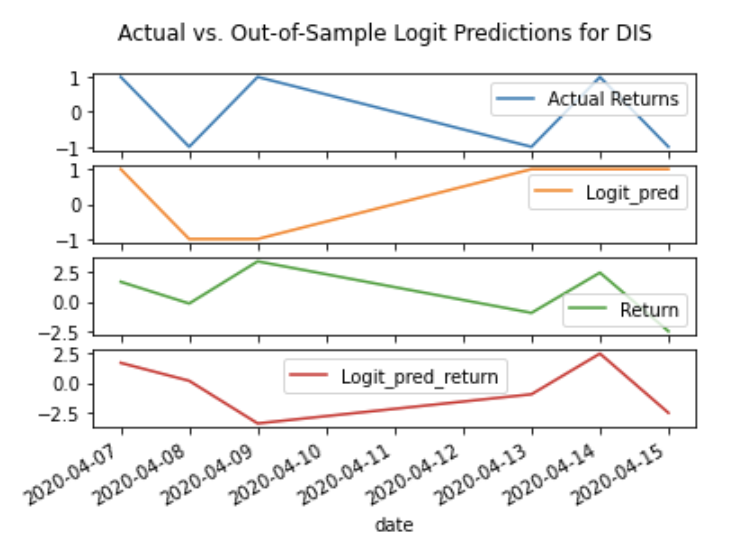
a. Logit Regression
- The
balanced accuracy scoreis 0.83.
Code (click me)
# ********* MODEL FITTING *************
   # --------- Loigt -----------
   # --------Start-------------

M = 'Logit'
from sklearn import linear_model
lm = linear_model.LogisticRegression(C = 1e5)
lm.fit(X_train, y_train)
lm_pred = lm.predict(X_test)


  # --------- Logit ------------
   # ---------End -------------
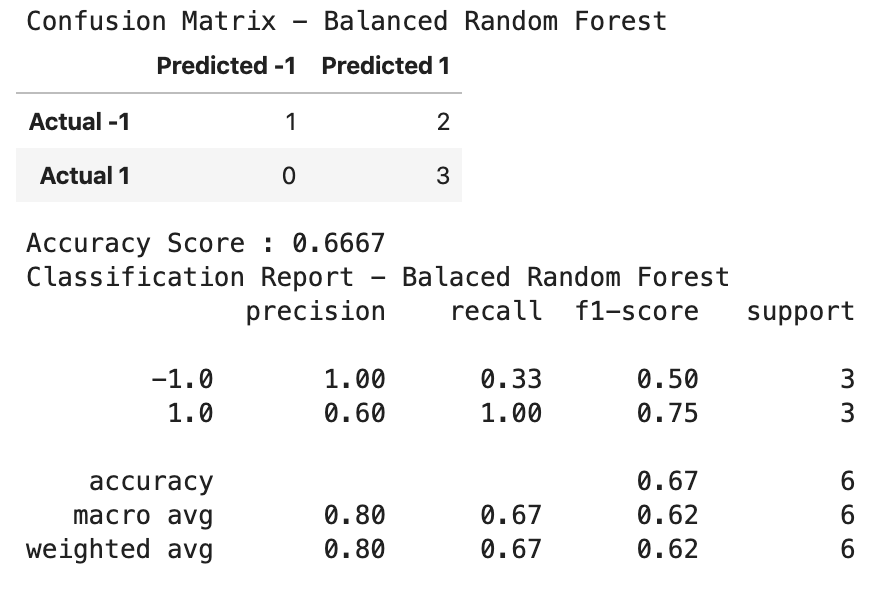
b. Balanced Random Forest Classifier Ensemble Learning
- The
balanced accuracy scoreis 0.67. - Better choice over Decision Tree model as it prevents overfitting
Code
# ********* MODEL FITTING *************
   # -----Balanced Random Forest -------
   # --------Start-------------

# Resample the training data with the RandomOversampler
# fit Random Forest Classifier
from imblearn.ensemble import BalancedRandomForestClassifier
brf = BalancedRandomForestClassifier(n_estimators=100, random_state=42)
brf.fit(X_train, y_train)
brf_pred = brf.predict(X_test)

   # --- Balanced Random Forest --------
   # --------End-------------
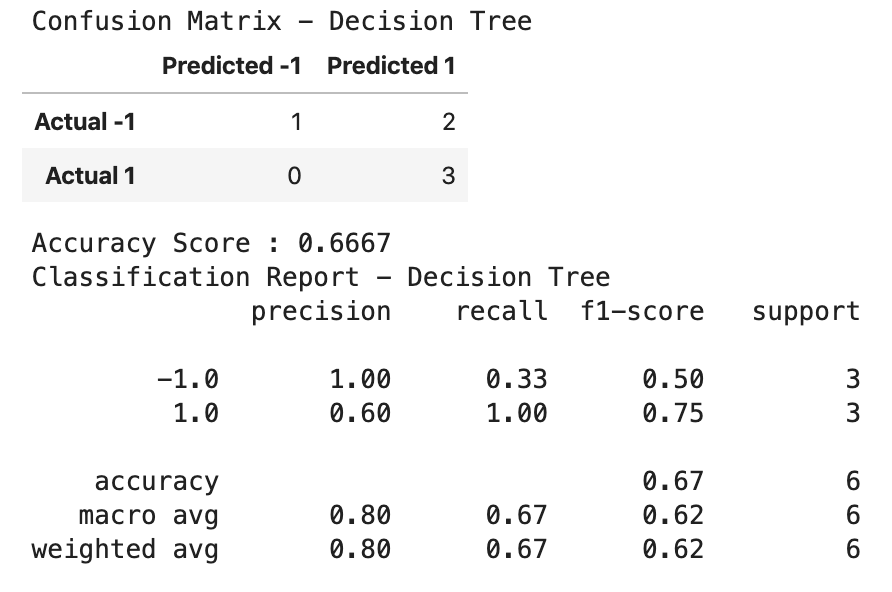
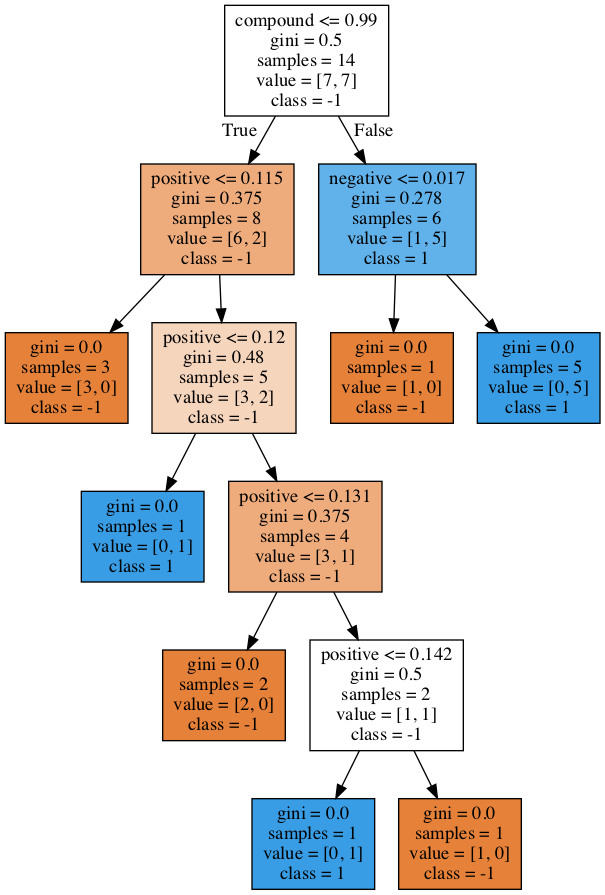
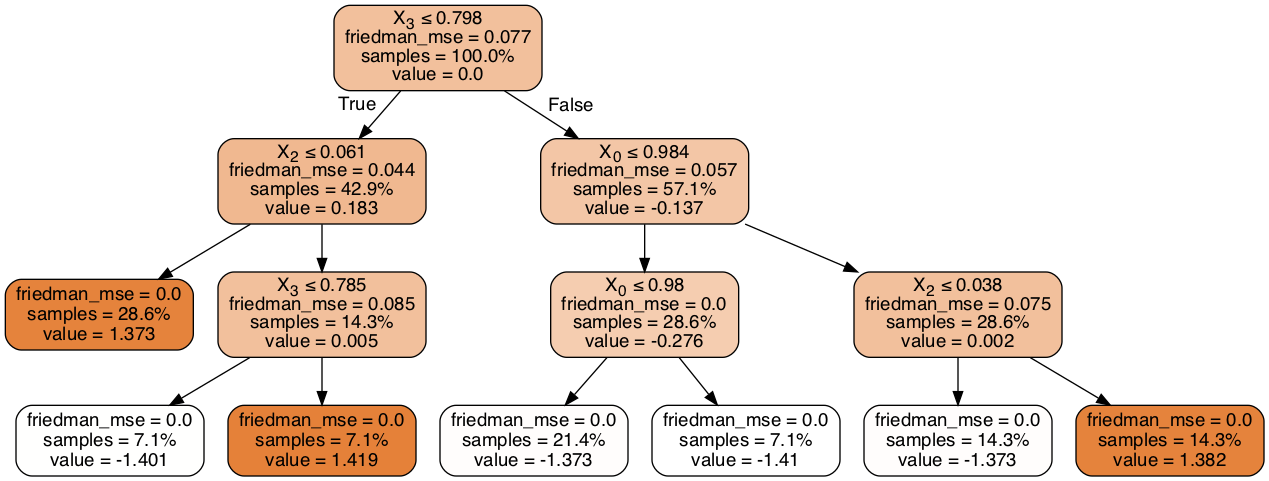
c. Decision Tree Resampling
- The
balanced accuracy scoreis 0.67.
Code
# ********* MODEL FITTING *************
   # ----- Decision Tree -------
   # --------Start-------------

from sklearn import tree
# Needed for decision tree visualization
import pydotplus
from IPython.display import Image

# Creating the decision tree classifier instance
model_tree = tree.DecisionTreeClassifier()
# Fitting the model
model_tree = model_tree.fit(X_train, y_train)
# Making predictions using the testing data
tree_pred = model_tree.predict(X_test)

  # --- Decision Tree --------
# --------End-------------Code
# Creating training and testing data sets
from sklearn.model_selection import train_test_split
X_train, X_test, y_train, y_test = train_test_split(X, y, test_size = 0.3, shuffle=False, random_state=42)

# For neural network sequential, LSTM and ensemble learning
#Create the StandardScaler instance
scaler = StandardScaler()
# Fit the Standard Scaler with the training data
X_scaler = scaler.fit(X_train)

# Scale the training data - only scale X_train and X_test data
X_train_scaled = X_scaler.transform(X_train)
X_test_scaled = X_scaler.transform(X_test)


# Creating validation data sets for deep learning on neural network model training
from sklearn.model_selection import train_test_split
X_train, X_val, y_train, y_val = train_test_split(X_train, y_train, test_size = 0.3, shuffle=False)
- Confusion Matrix and Balanced Accuracy Scores for Logit, Supervised Resampling and Ensemble Learning
- Model evaluation would differ by company and time window.
- Interpretion on accuracy scores
- The Logit model is offering a balanced accuracy score of predictions for the test dataset, which is 30% of 20, or 6 predictions.
- The reason we usually get 50% as the balanced accuracy score is because with so little data (and having been trained on so little data - 14 days), it's basically randomly guessing and getting it right 50% of the time.
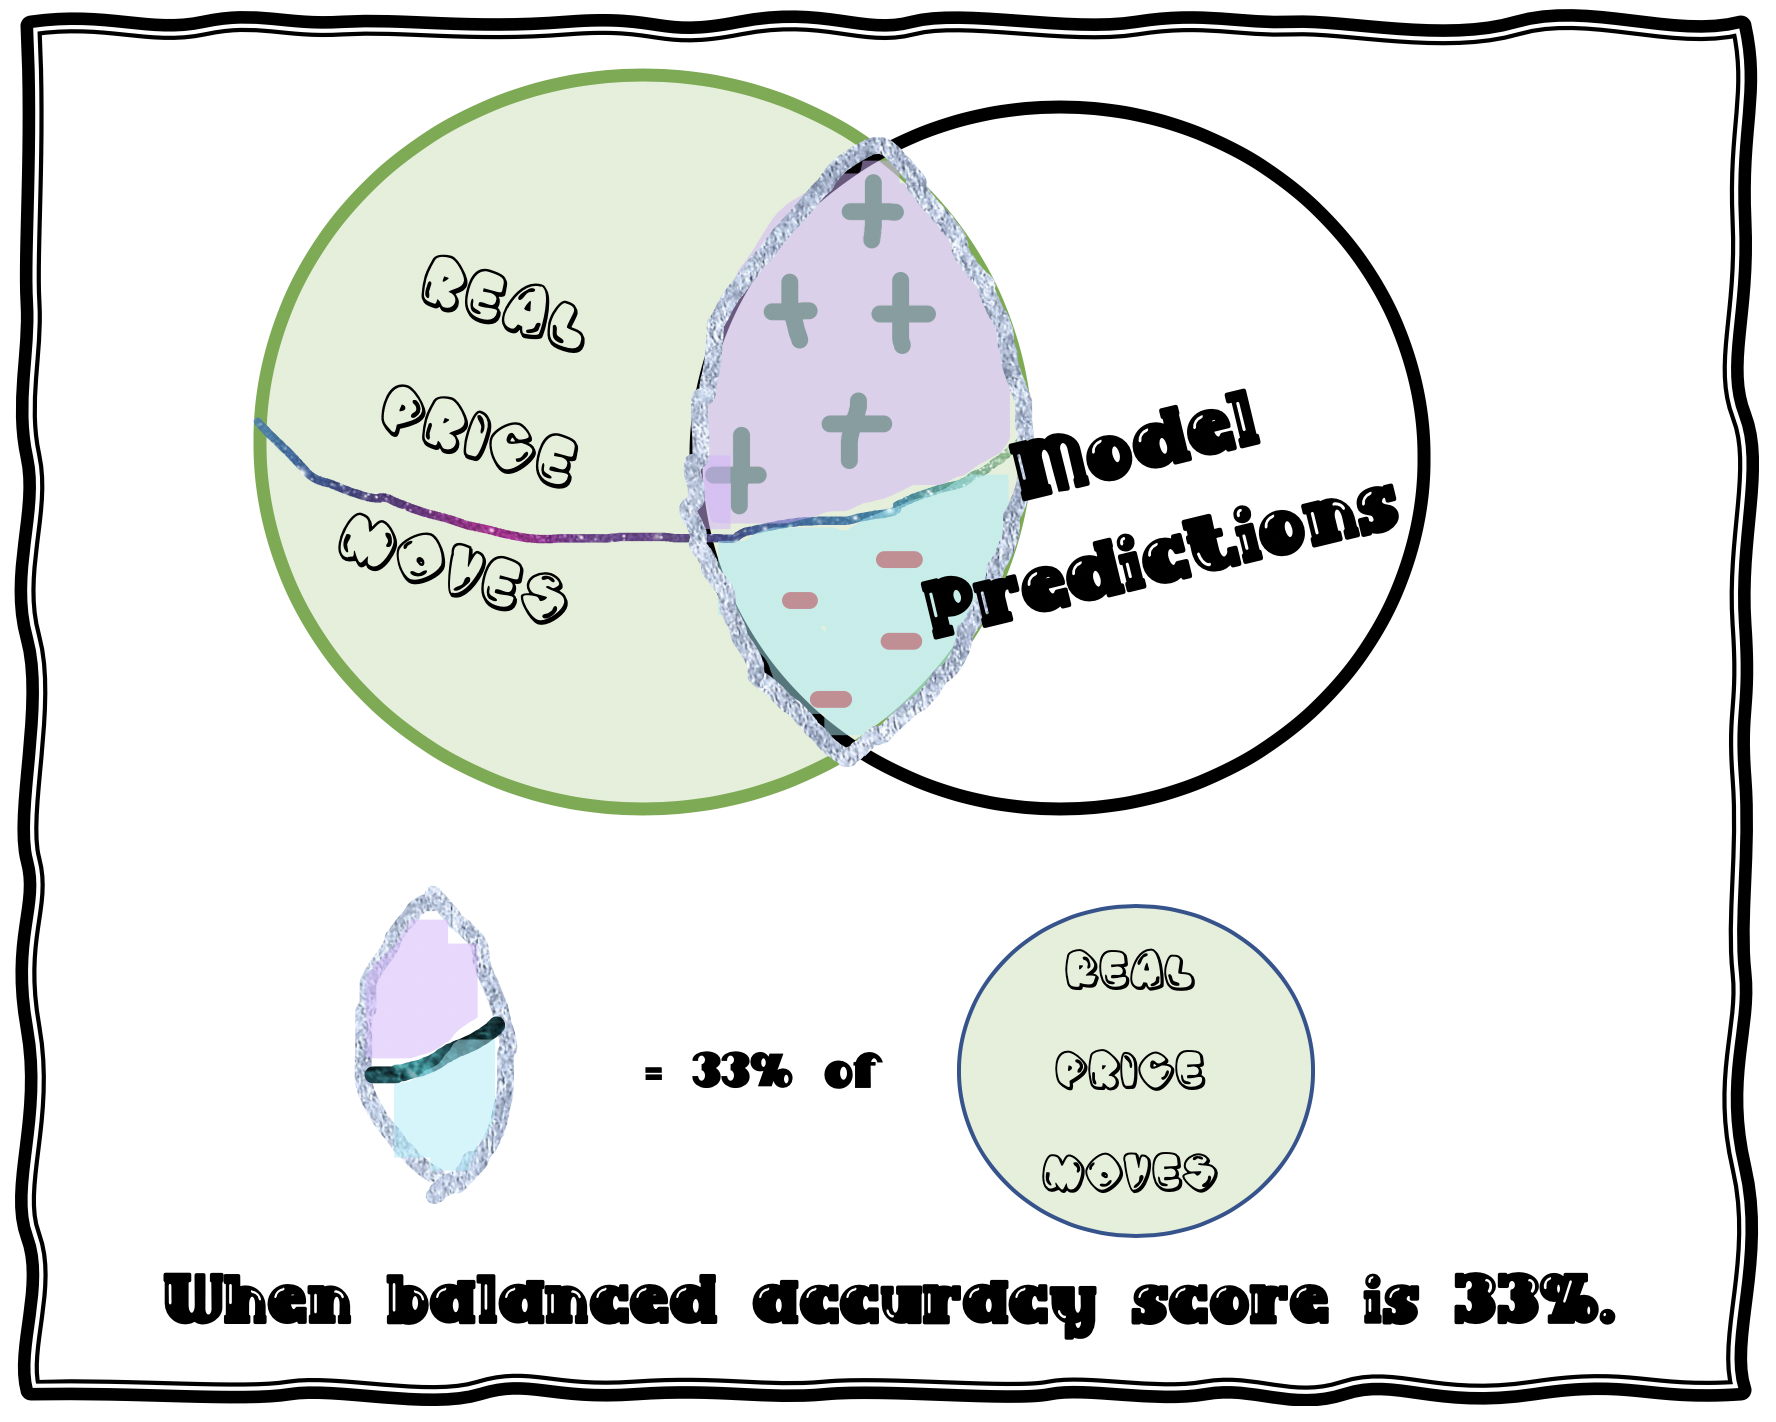
- Now, sometimes we're a value of .25 (25%) or .625 (62.5%), and you're probably thinking to yourself, 6 can't be divided by another whole number to return that fraction/percentage. True - but we're not using a straight accuracy score in our model, we're using a balanced accuracy score, which is different. Read here for explanation.
- If you go into the model and change balanced_accuracy_score to accuracy_score (which is a simple calculation of number of correct guesses divided by total guesses), and print the confusion matrix, you'll see that it's returning the correct fraction.
- The Logit model is offering a balanced accuracy score of predictions for the test dataset, which is 30% of 20, or 6 predictions.
Code
# Score the accuracy
print("Training vs. Testing - Logit")
print(f"Training Data Score: {lm.score(X_train, y_train):,.04f}")
print(f"Testing Data Score: {lm.score(X_test, y_test):,.04f}")

# Evaluating the Logit model in a nicer format
# Calculating the confusion matrix
cm_lm = confusion_matrix(y_test, lm_pred)
cm_lm_df = pd.DataFrame(
    cm_lm, index=["Actual -1", "Actual 1"], columns=["Predicted -1", "Predicted 1"]
)
# Calculating the accuracy score
acc_lm_score = balanced_accuracy_score(y_test, lm_pred)

# Displaying results
print("Confusion Matrix - Logit")
display(cm_lm_df)
print(f"Balanced Accuracy Score : {acc_lm_score:,.04f}")
print("Classification Report - Logit")
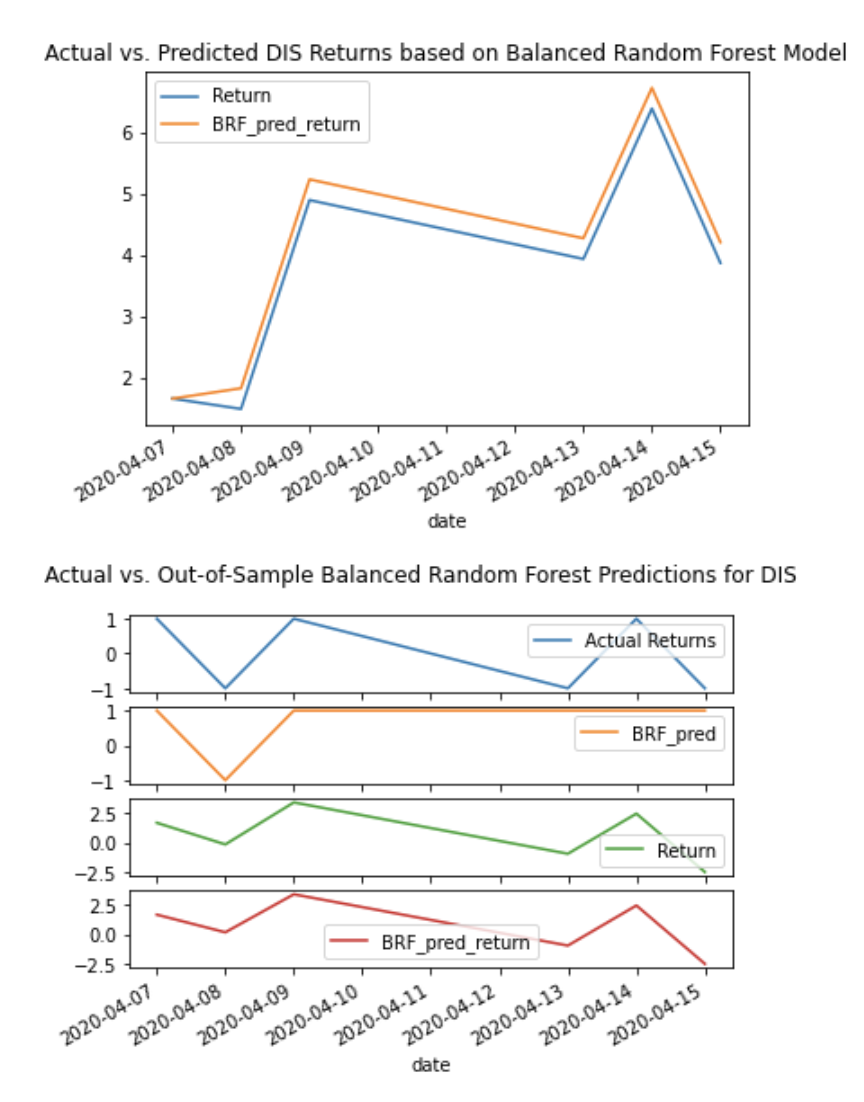
print(classification_report(y_test, lm_pred))Conclusion: Predictions are more consistent with actual directions of returns based on negative compared to positive sentiments, subject to overfitting.
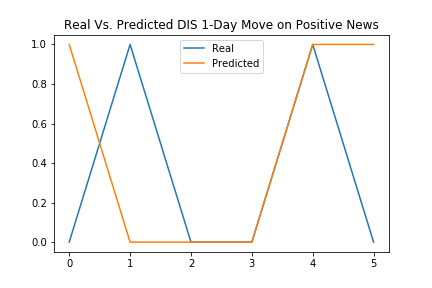
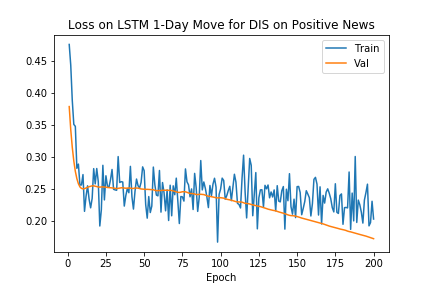
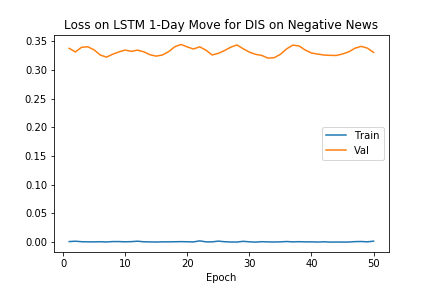
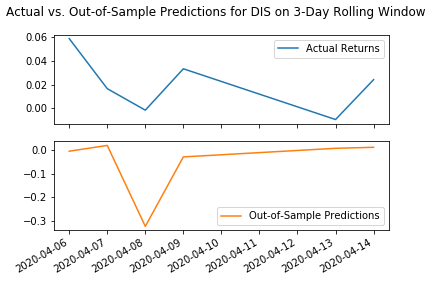
Deep Learning LSTM Model
Positive News Sentiments
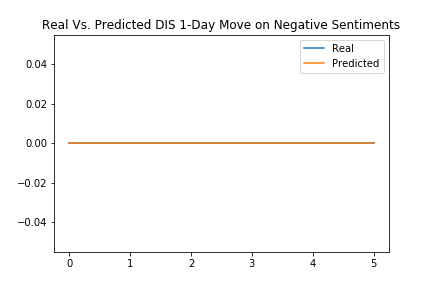
Negative News Sentiments
Note: Potentially overfitting. Needed more data.
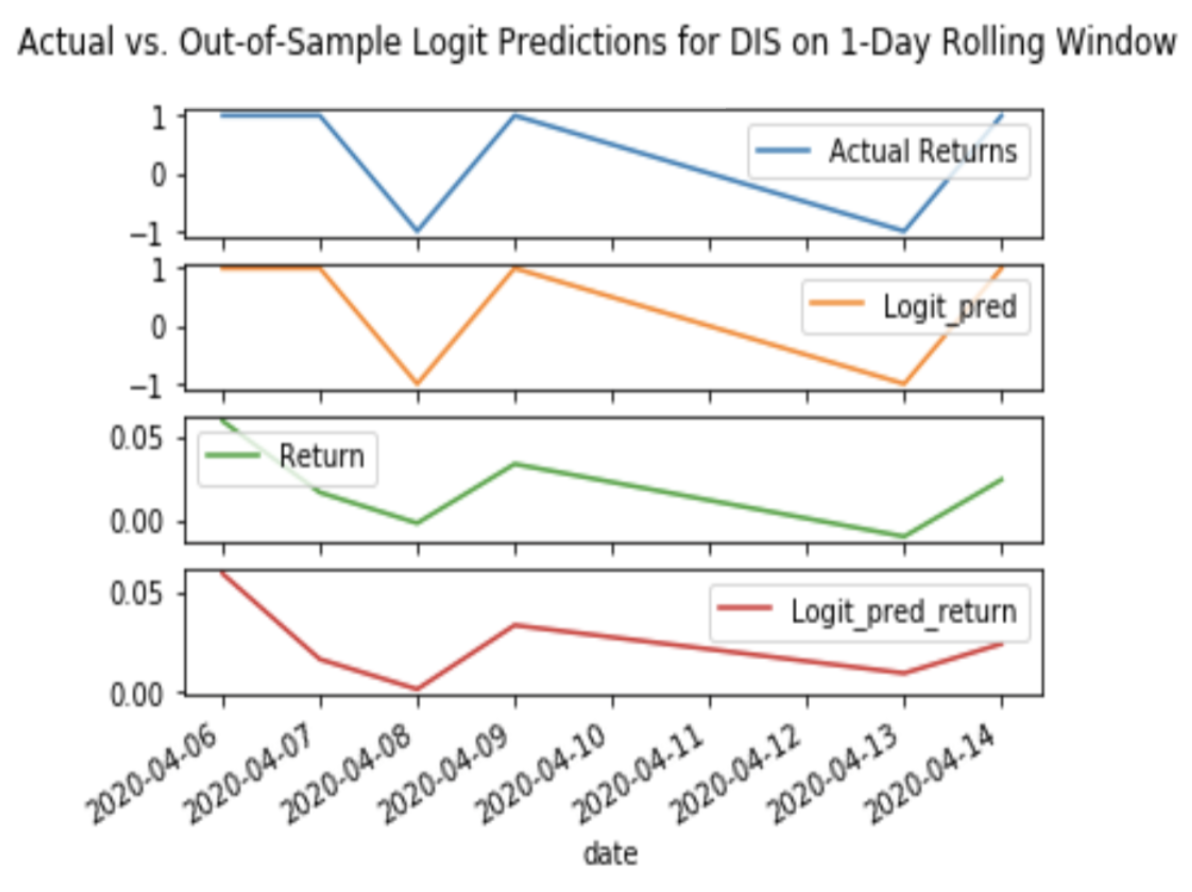
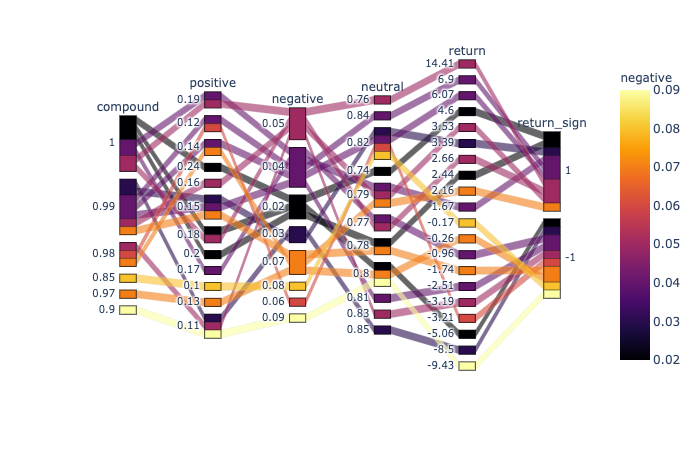
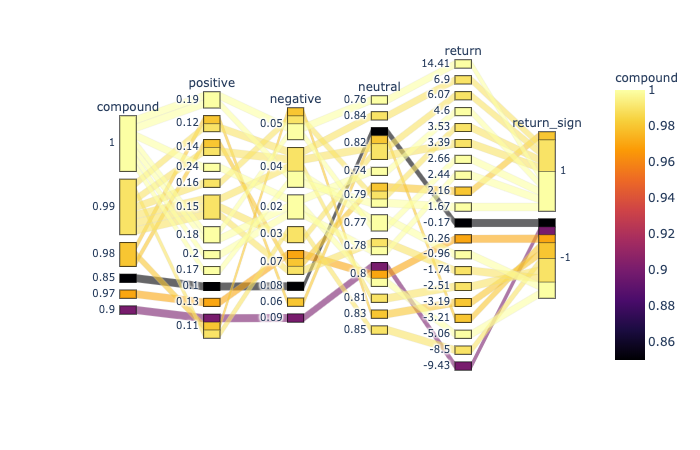
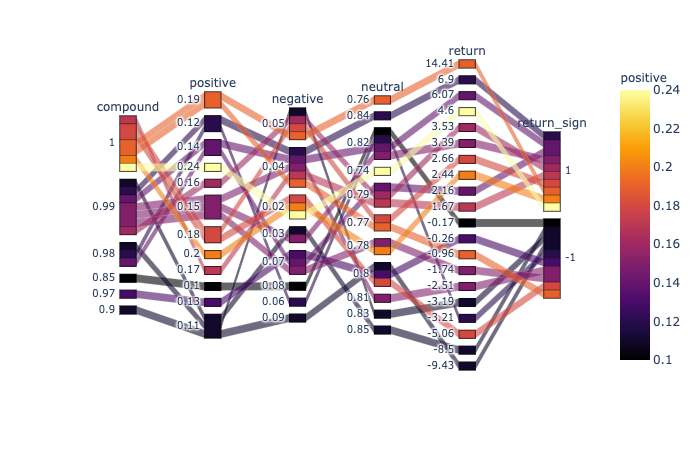
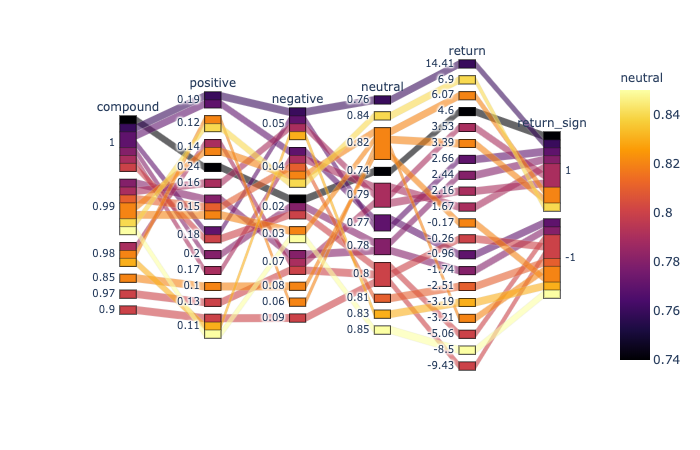
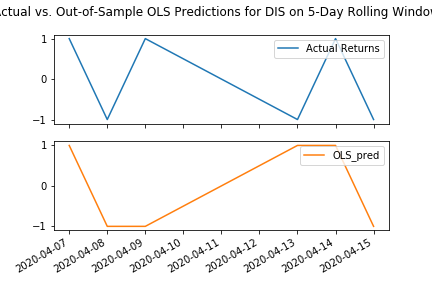
The plots of parallel categories and OLS regressions below shows consistent conclusion that negative and compound sentiment scores hold higher predictive power on the direction of daily returns.
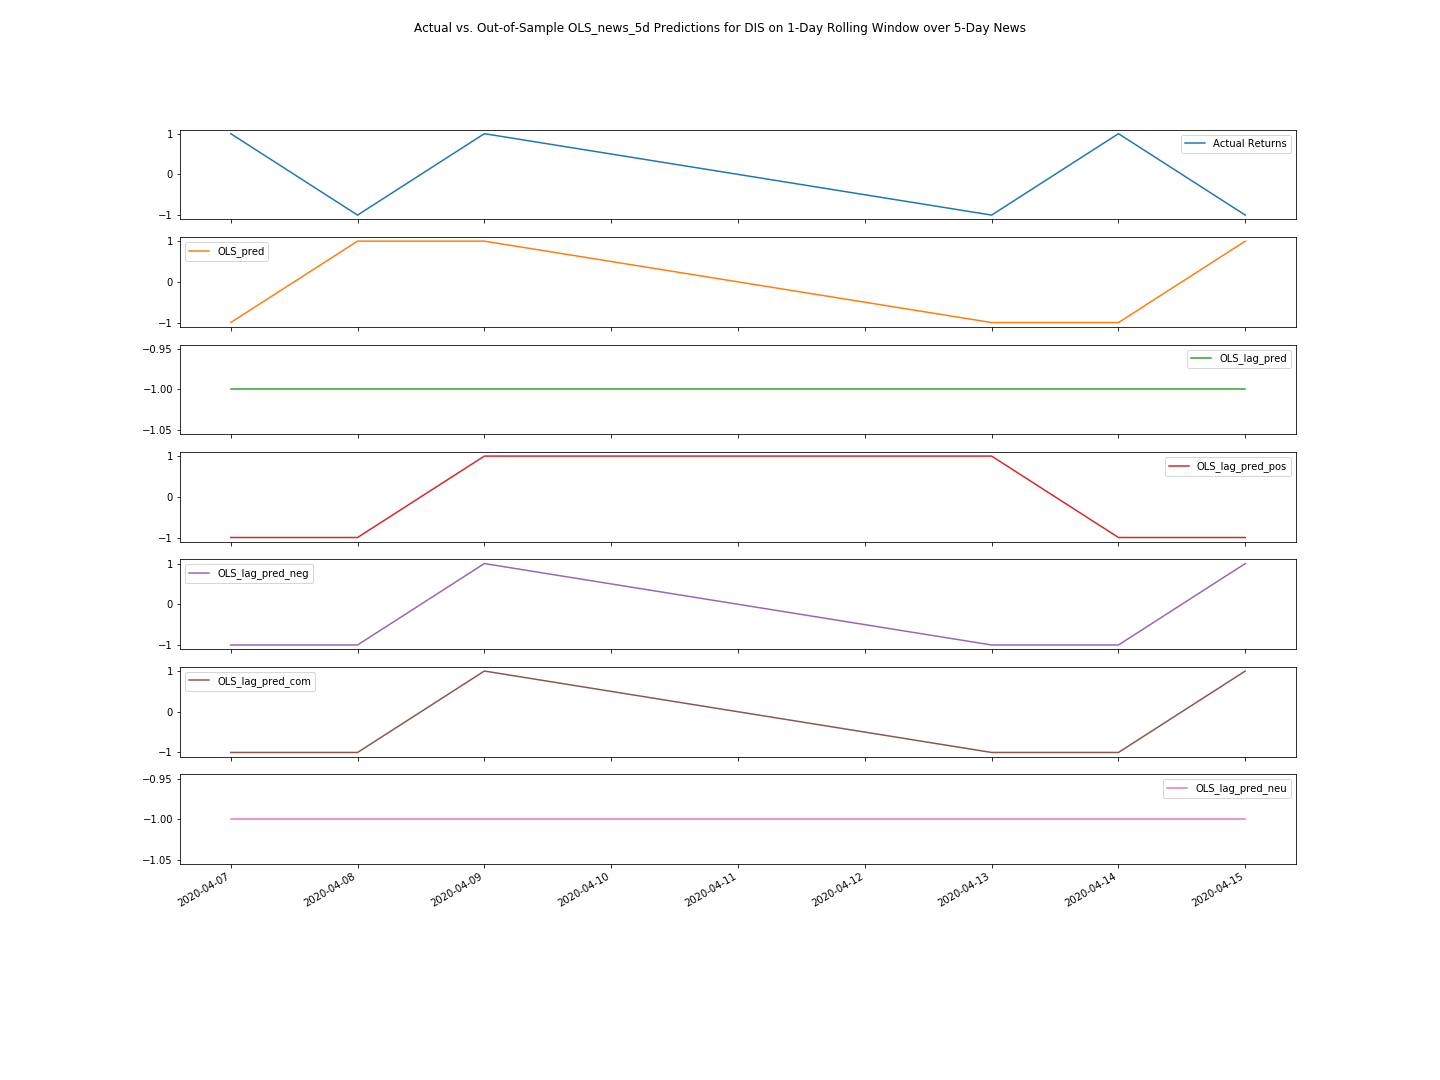
OLS Prediction on Price Move Directions due to News Sentiments in the Past 5 Days
Actual Returns (the blue line on top) in more in tune with the predictions according to negative sentiments (the purple line, third from the bottom) and compound sentiments (the brown line, second from the bottom) over the past five trading days.
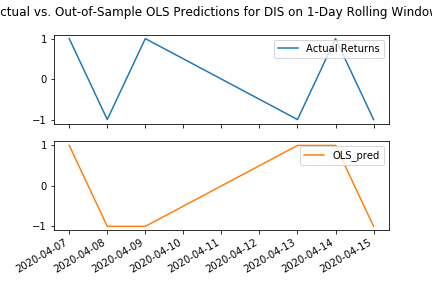
OLS Predicted Returns on News Sentiments in the Past 5 Days
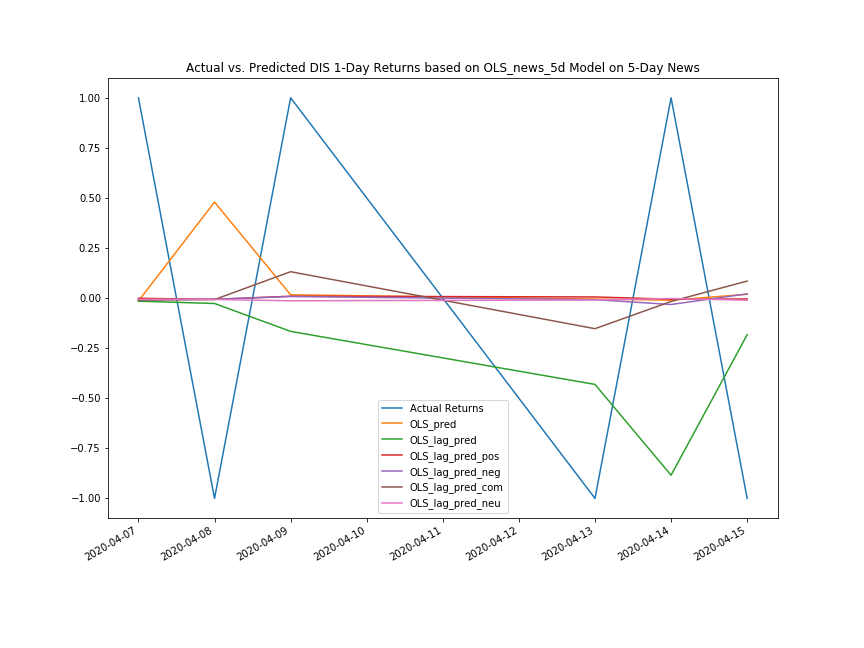 Note: Inverted due to complications when multiplying positive and negative signs.
Impact on Lagged Response to News Sentiments
Conclusion: We found that news sentiments over the past five trading days has identical predictive capacity to one-day sentiments.
Discussions
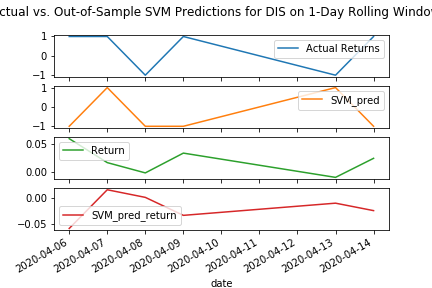
Gradient Boosing Ensemble and SVM Models also provides higher accuracy scores (50%) compared to other models.
What happens when multiplying a prediction of price drop, i.e. -1, with a negative actual return? Please click below to see a solution.
Code
sigma = (dis['return']/100).std()
all_predic = all_pred
all_predic['OLS_predi'] = 0.7 * sigma * (-all_predic['OLS_pred'])Confusion Matrix
Predicted 0 (-1) Predicted 1 Actually 0 (-1) TN FP Actually 1 FN TP
- Accuracy = (TP+TN)/(TP+TN+FP+FN)
- It treats FP and FN equally and would be biased for imbalanced data:
- More weights are put on true negatives (TN)s for COVID-19 tests
- Tests need to focus on minimizing false negatives (FN)
- Therefore, other test statistics need to be considered
- It treats FP and FN equally and would be biased for imbalanced data:
Other Model Evaluation Statistics (click me)
-
Precision = TP/(TP+FP)
- Out of all the predictions of "1" for daily price increase, how many are actually increased.
- It focuses on the data on price increase and uses figuress in the second column of the confusion matrix.
-
Recall = TP/(TP+FN)
- How many actual daily price increase moves are predicted correctly?
- It features the second row of the confusion matrix
- Recall is also the sensitivity of the testing model
-
Specificity = TN/(TN+FP)
- How many of the actuall downward price moves are predicted correctly?
- It spotlight the first row of our confusion matrix and examine only the downward price moves in our data.
-
F1 = 2 x (Precision x Recall)/(Precision + Recall)
- F1 score is the harmonic mean of precision and recall.
- As precission and recall usually go in opposite directions, f1 score is a good balance between the two.
- F1 leverages the second row and column for actual and predicted upward price moves.
Jupyter Lab, Jupyter Notebook, Visual Studio Code
We are working on the following three features to upgrade our machine learning widget.
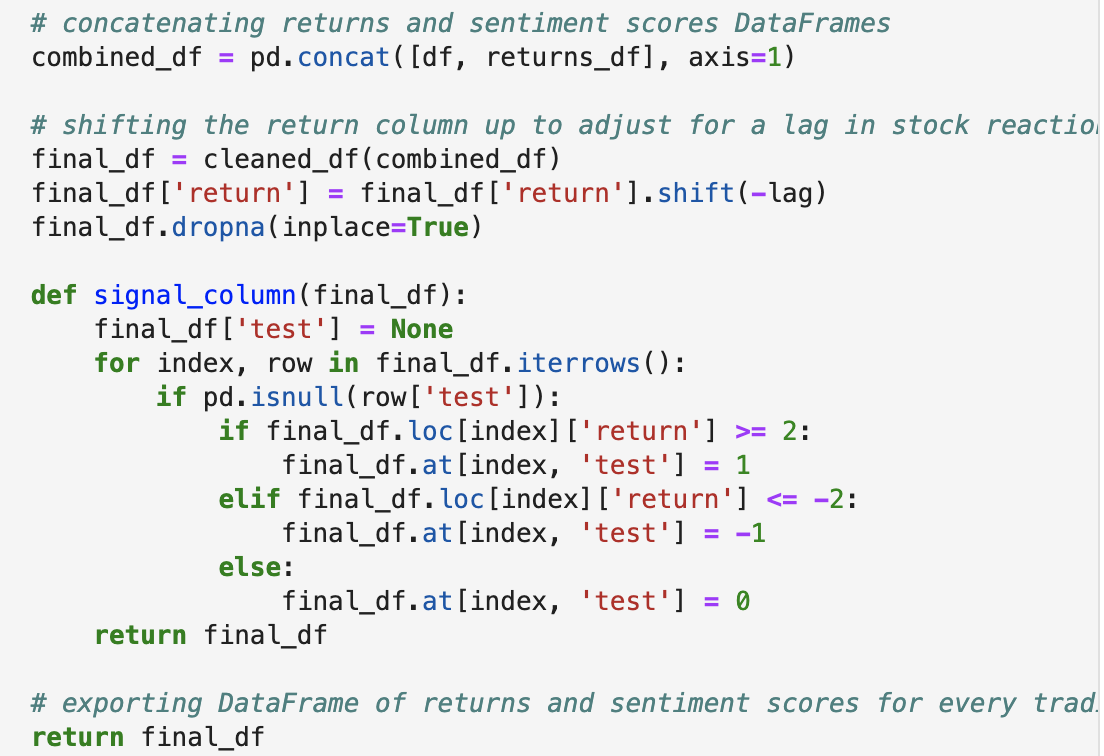
Our group has been working on several solutions to incorporate Buy, Sell and Hold feature into the master function widget.
The original code appears as follows:
def signal_column(df):
    df['test'] = None
    for index, row in df.iterrows():
        if pd.isnull(row['test']):
            if df.loc[index]['return'] >= 2:
                df.at[index, 'test'] = 1
            elif df.loc[index]['return'] <= -2:
                df.at[index, 'test'] = -1
            else:
                df.at[index, 'test'] = 0
    return df
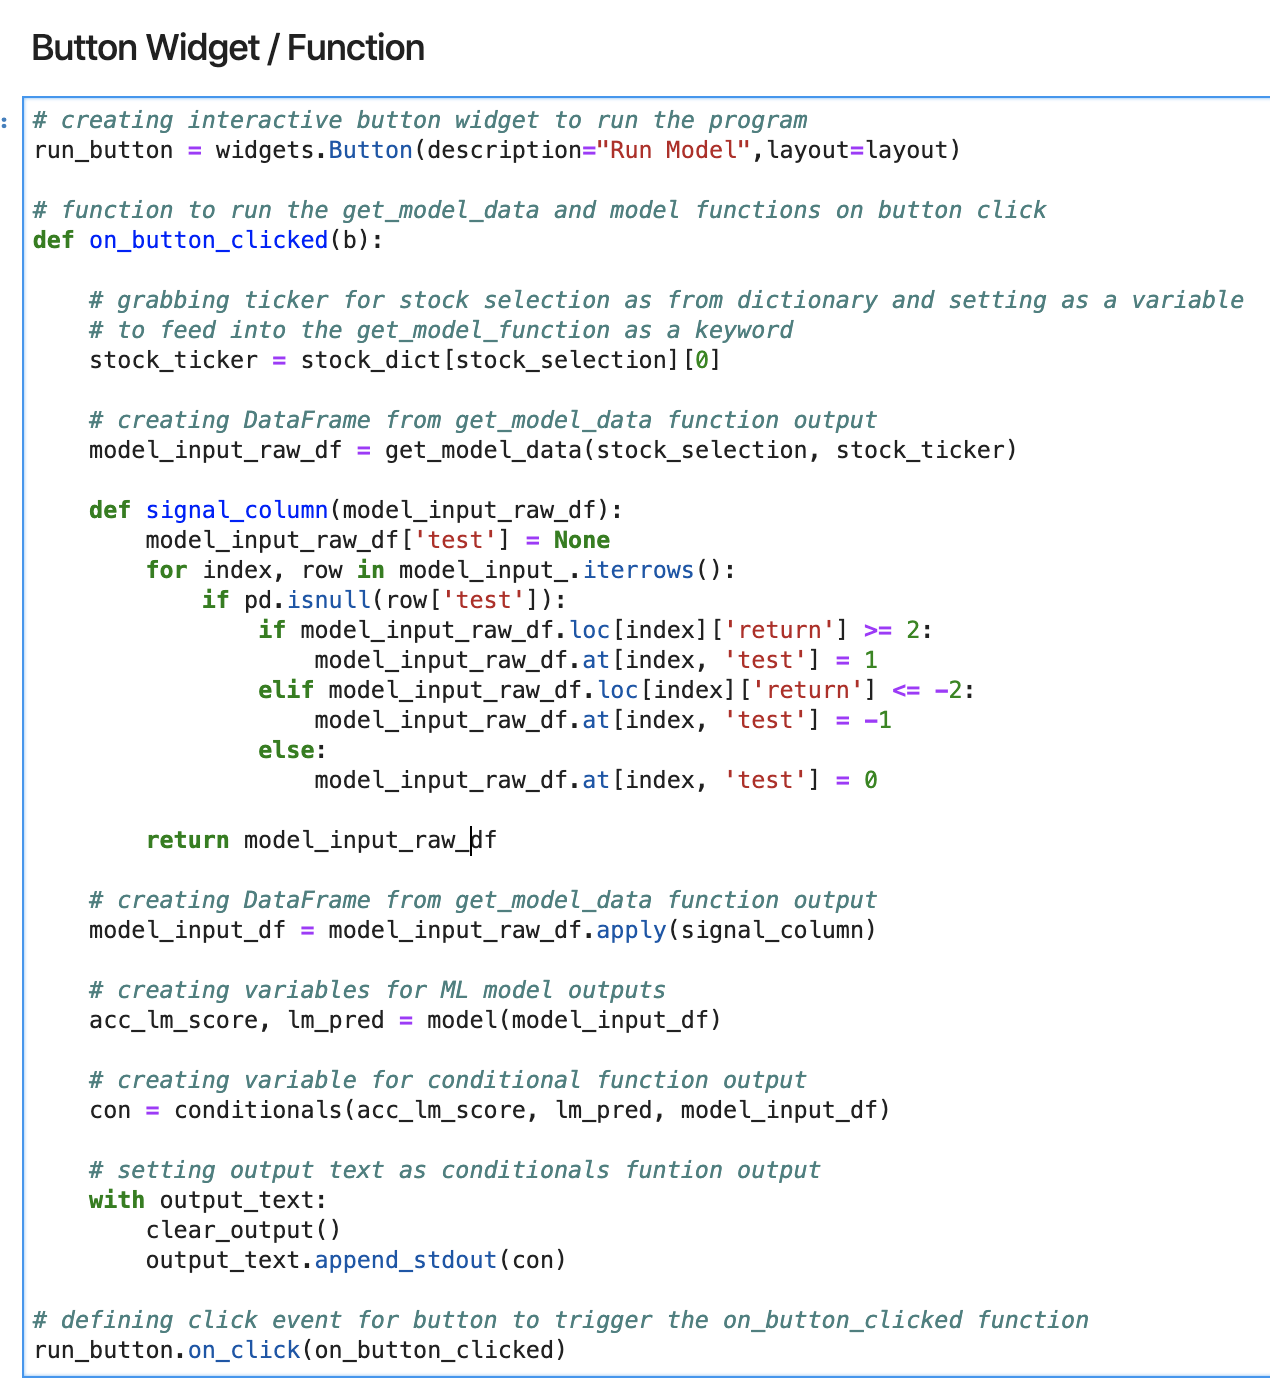
Trying to fit it in, we tried three versions below
c. on the model(df) function
# defining model to run Logit logistic regression model on the feature/target DataFrame
# and export predicted price movement and model accuracy
def model(df):
    # preparing the dataframe
    df['return_sign'] = None
    for index, row in df.iterrows():
        if pd.isnull(row['return_sign']):
            if df.loc[index]['return'] >= 2:
                df.at[index, 'return_sign'] = 1
            elif df.loc[index]['return'] <= -2:
                df.at[index, 'return_sign'] = -1
            else:
                df.at[index, 'return_sign'] = 0
    df = df.drop(columns=['text'])
    # creating the features (X) and target (y) sets
    X = df.iloc[:, 0:4]
    y = df["return_sign"]
    # creating training and testing data sets
    X_train, X_test, y_train, y_test = train_test_split(X, y, test_size = 0.3, shuffle=False, random_state=42)
    # fitting model
    M = 'Logit'
    lm = linear_model.LogisticRegression(solver = 'lbfgs')
    lm.fit(X_train, y_train)
    lm_pred = lm.predict(X_test)
    # calculating confusion matrix
    cm_lm = confusion_matrix(y_test, lm_pred)
    cm_lm_df = pd.DataFrame(
    cm_lm, index=["Actual -1", "Actual 1"], columns=["Predicted -1", "Predicted 1"]
    )
    # calculating the accuracy score
    acc_lm_score = balanced_accuracy_score(y_test, lm_pred)
    # exporting model accuracy and predicted price movement float variables as output
    return acc_lm_score, lm_pred[-1]
APIs ran out as of the date of this readme file. It remains unknown whether the buy-sell-hold feature works.
Click here for latest version Featuring Buy Sell and Hold
Furthermore, we discussed about options based on Black-Scholes Pricing and showcase put-call parity. It features an interactive input function. Outputs include prices on put and calls with greeks to measure price sensitivities.
Click here for latest version on options feature
Another topic that we spoke about was an Amazon Lex Bot.
Click here for latest version on Lambda function for Amazon Bot
- Richard Bertrand
- Ava Lee
- Devin Nigro
- Brody Wacker
- CU Gitlab Repository
- https://machinelearningmastery.com/learning-curves-for-diagnosing-machine-learning-model-performance/
- https://stackoverflow.com/questions/46040656/binary-keras-lstm-model-does-not-output-binary-predictions
- https://pandas.pydata.org/pandas-docs/stable/reference/api/pandas.get_dummies.html
- https://medium.com/@deallen7/managing-date-datetime-and-timestamp-in-python-pandas-cc9d285302ab
- https://stackoverflow.com/questions/38067704/how-to-change-the-datetime-format-in-pandas
- https://pandas.pydata.org/pandas-docs/stable/reference/api/pandas.Timestamp.html
- "Stock Market Prediction" by The Python Quants from ML Elective for CQF
- https://imbalanced-learn.readthedocs.io
- https://scikit-learn.org/stable/
- https://towardsdatascience.com/adaboost-for-dummies-breaking-down-the-math-and-its-equations-into-simple-terms-87f439757dcf
- https://pandas.pydata.org/pandas-docs/version/0.23.4/generated/pandas.get_dummies.html
- https://www.geeksforgeeks.org/python-pandas-series/
- https://machinelearningmastery.com/random-oversampling-and-undersampling-for-imbalanced-classification/
- https://machinelearningmastery.com/combine-oversampling-and-undersampling-for-imbalanced-classification/
- https://machinelearningmastery.com/roc-curves-and-precision-recall-curves-for-classification-in-python/
- https://towardsdatascience.com/decision-trees-and-random-forests-df0c3123f991
- https://docs.scipy.org/doc/numpy/reference/generated/numpy.ravel.html#numpy.ravel
- https://www.scikit-yb.org/en/latest/api/classifier/classification_report.html
- https://www.npr.org/sections/health-shots/2020/04/15/834497497/antibody-tests-for-coronavirus-can-miss-the-mark
- https://ipywidgets.readthedocs.io/en/latest/
- https://github.com/YuChenAmberLu/Options-Calculator/blob/master/Options%20Calculator%20with%20Black%20Scholes%20model.ipynb
- https://clinthoward.github.io/portfolio/2017/04/16/BlackScholesGreeks/
- https://medium.com/@philipp.jfr/panel-announcement-2107c2b15f52
- https://towardsdatascience.com/how-to-build-a-time-series-dashboard-in-python-with-panel-altair-and-a-jupyter-notebook-c0ed40f02289
- https://github.com/holoviz/panel
- https://www.nltk.org/
