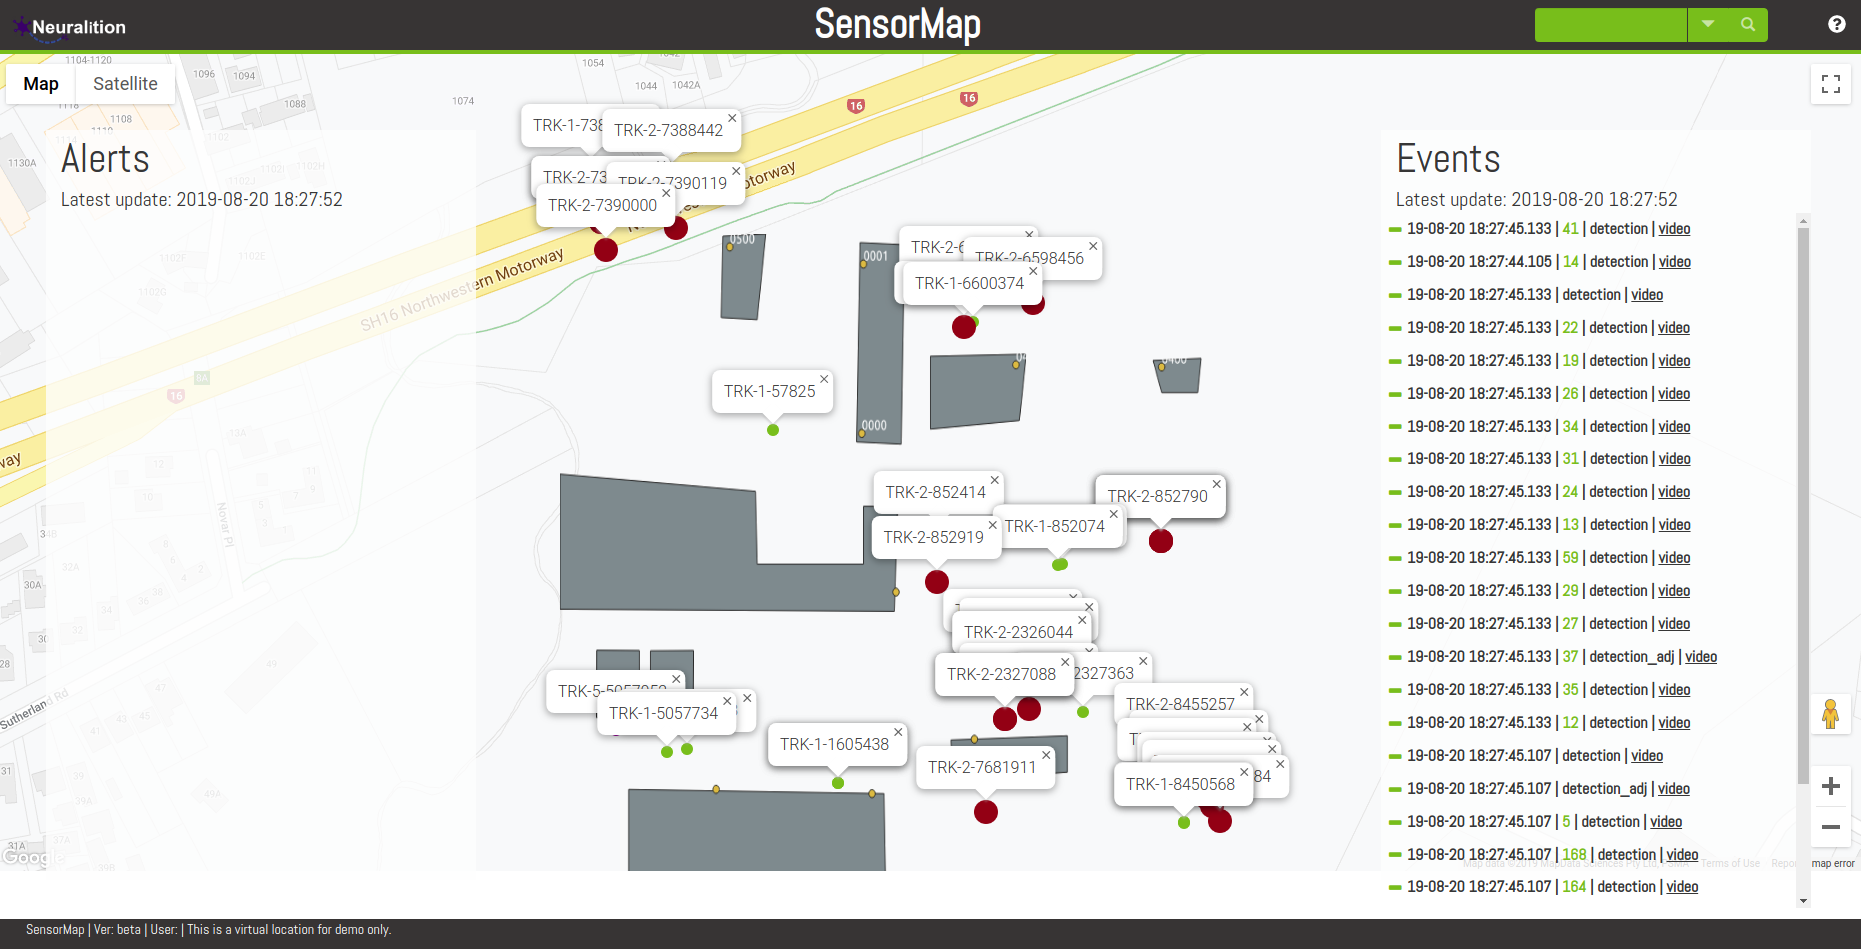
This application displays detected objects in realtime on a map.
For link to download demo json playback data go to bottom of page at https://www.neuralition.com
Typically inputs would based on json output from performing realtime object detection on multiple video camera input streams but here we also provide a player application that will stream pre-recorded json. Aside from video streams this app could also be used to display events from IoT streams or any other sensor type where displaying the result on a geographical map makes sense.
This document describes the full end to end SensorMap application that is a heavily modified version of the Nvidia DeepStream 360 application (https://github.com/NVIDIA-AI-IOT/deepstream_360_d_smart_parking_application.git). Whereas that application is specifically a demo parking garage, SensorMap is designed to be a generic application for displaying different types of objects. Major changes include:
- Mocks up a demo "Campus" based on multi-camera video outputs from the Virat dataset (http:https://www.viratdata.org). Note that the mapping between the Virat camera views and the geographical map is very approximate and just for demonstration purposes!
- Made generic to work with multiple classes of objects.
- Displays different classes of objects with different colors/styles. Classes and styles are configurable.
- Removed Apache Spark module in favour of a python 'processor' module to facilitate running in smaller memory footprint.
- Added a python 'player' application that writes recorded json into the raw queue to facilitate testing in environments without access to a gpu.
- Various updates to dockerfile configurations to enable external config files and log files.
Tested on:
- Ubuntu 18.04 LTS
- Python 3.6.8
To get started, clone this repository.
The directory structure is:
- \analytics_server_docker - the dockerized SensorMap application containing dockerized versions of Apache Cassandra, Apache Kafka, Elasticsearch, Logstash, Kibana and the below custom modules except Player.
- \apis - source code for the backend node.js application that reads from the cassandra database and elasticsearch and provides information to the ui.
- \ui - source code for the react and google maps-based visualization application
- \player - source code for the demo application that "plays" example json messages into the apache kafka raw queue
- \tracker - source code for the multicamera tracking application that consolidates object detections across cameras, handles overlapping fields of view etc
- \processor - source code for the application that writes detections into the cassandra database and calculates anomalies over time which are written to the kafka anomaly topic
To run this application, the user needs to start the following applications in this order:
- Analytics Server: Check the README inside the
analytics_server_dockerdirectory and follow the steps to start the SensorMap docker containers. - Player: Check the README inside the
playerdirectory and follow the steps to start the player once SensorMap is started.
