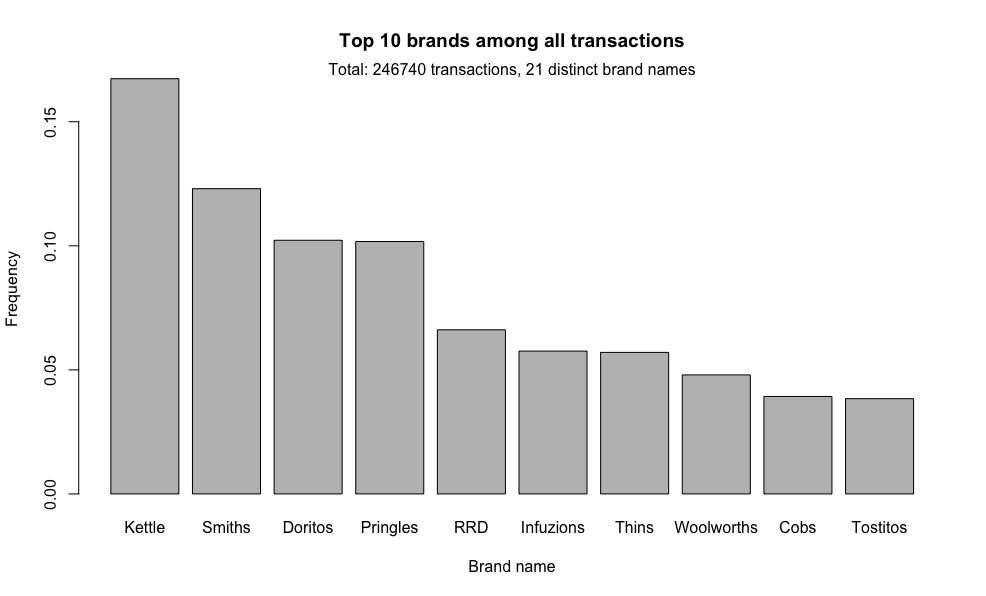
- 264,836 transactions of all chips purchased over one year and Customer data of 72,637 members were checked for missing data, nulls and outliers.
- Engineered features from the text of product names to extract brand names and pack size to each transaction.
- Joined two dataframes to examine customer segments and their purchase patterns.
- Performed t-test and Chi-squared test to test the association between customer segments and their purchase behaviors.
- Visualised purchase behaviors with mosaic plots.
- Brands to stock up
- Pack sizes to stock up
- Promotion strategy to optimise different customer spending behaviours
- Rstudio Version: 1.3.1073
- Data source: https://www.theforage.com/virtual-internships/prototype/NkaC7knWtjSbi6aYv/Data-Analytics
- Mosaics plots: https://www.kaggle.com/dhafer/mosaics-plots-using-ggmosaic
- Markdown cheatsheet: https://github.com/adam-p/markdown-here/wiki/Markdown-Here-Cheatsheet#images
Two files were used: transactiondata and purchasedata.
Data exploration
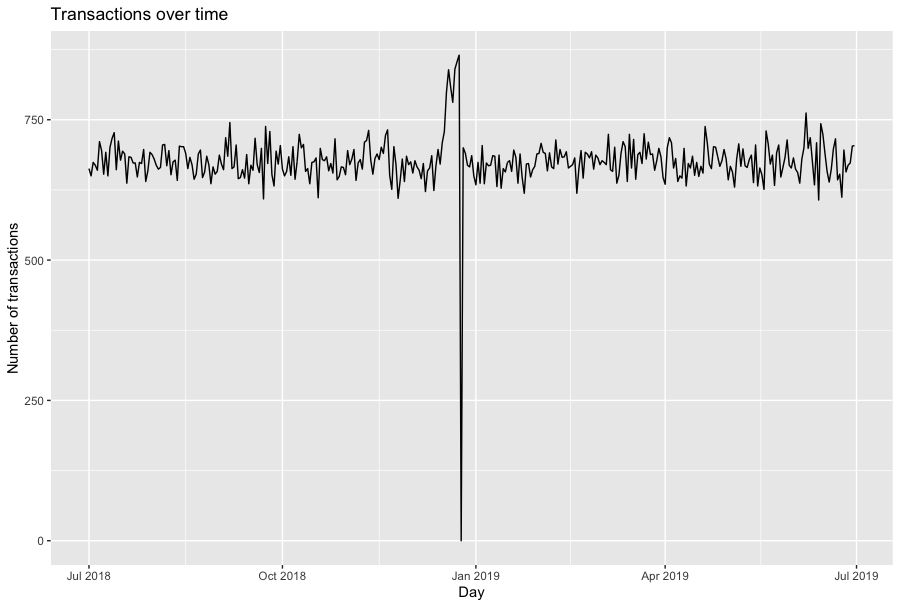 Number of transactions over time
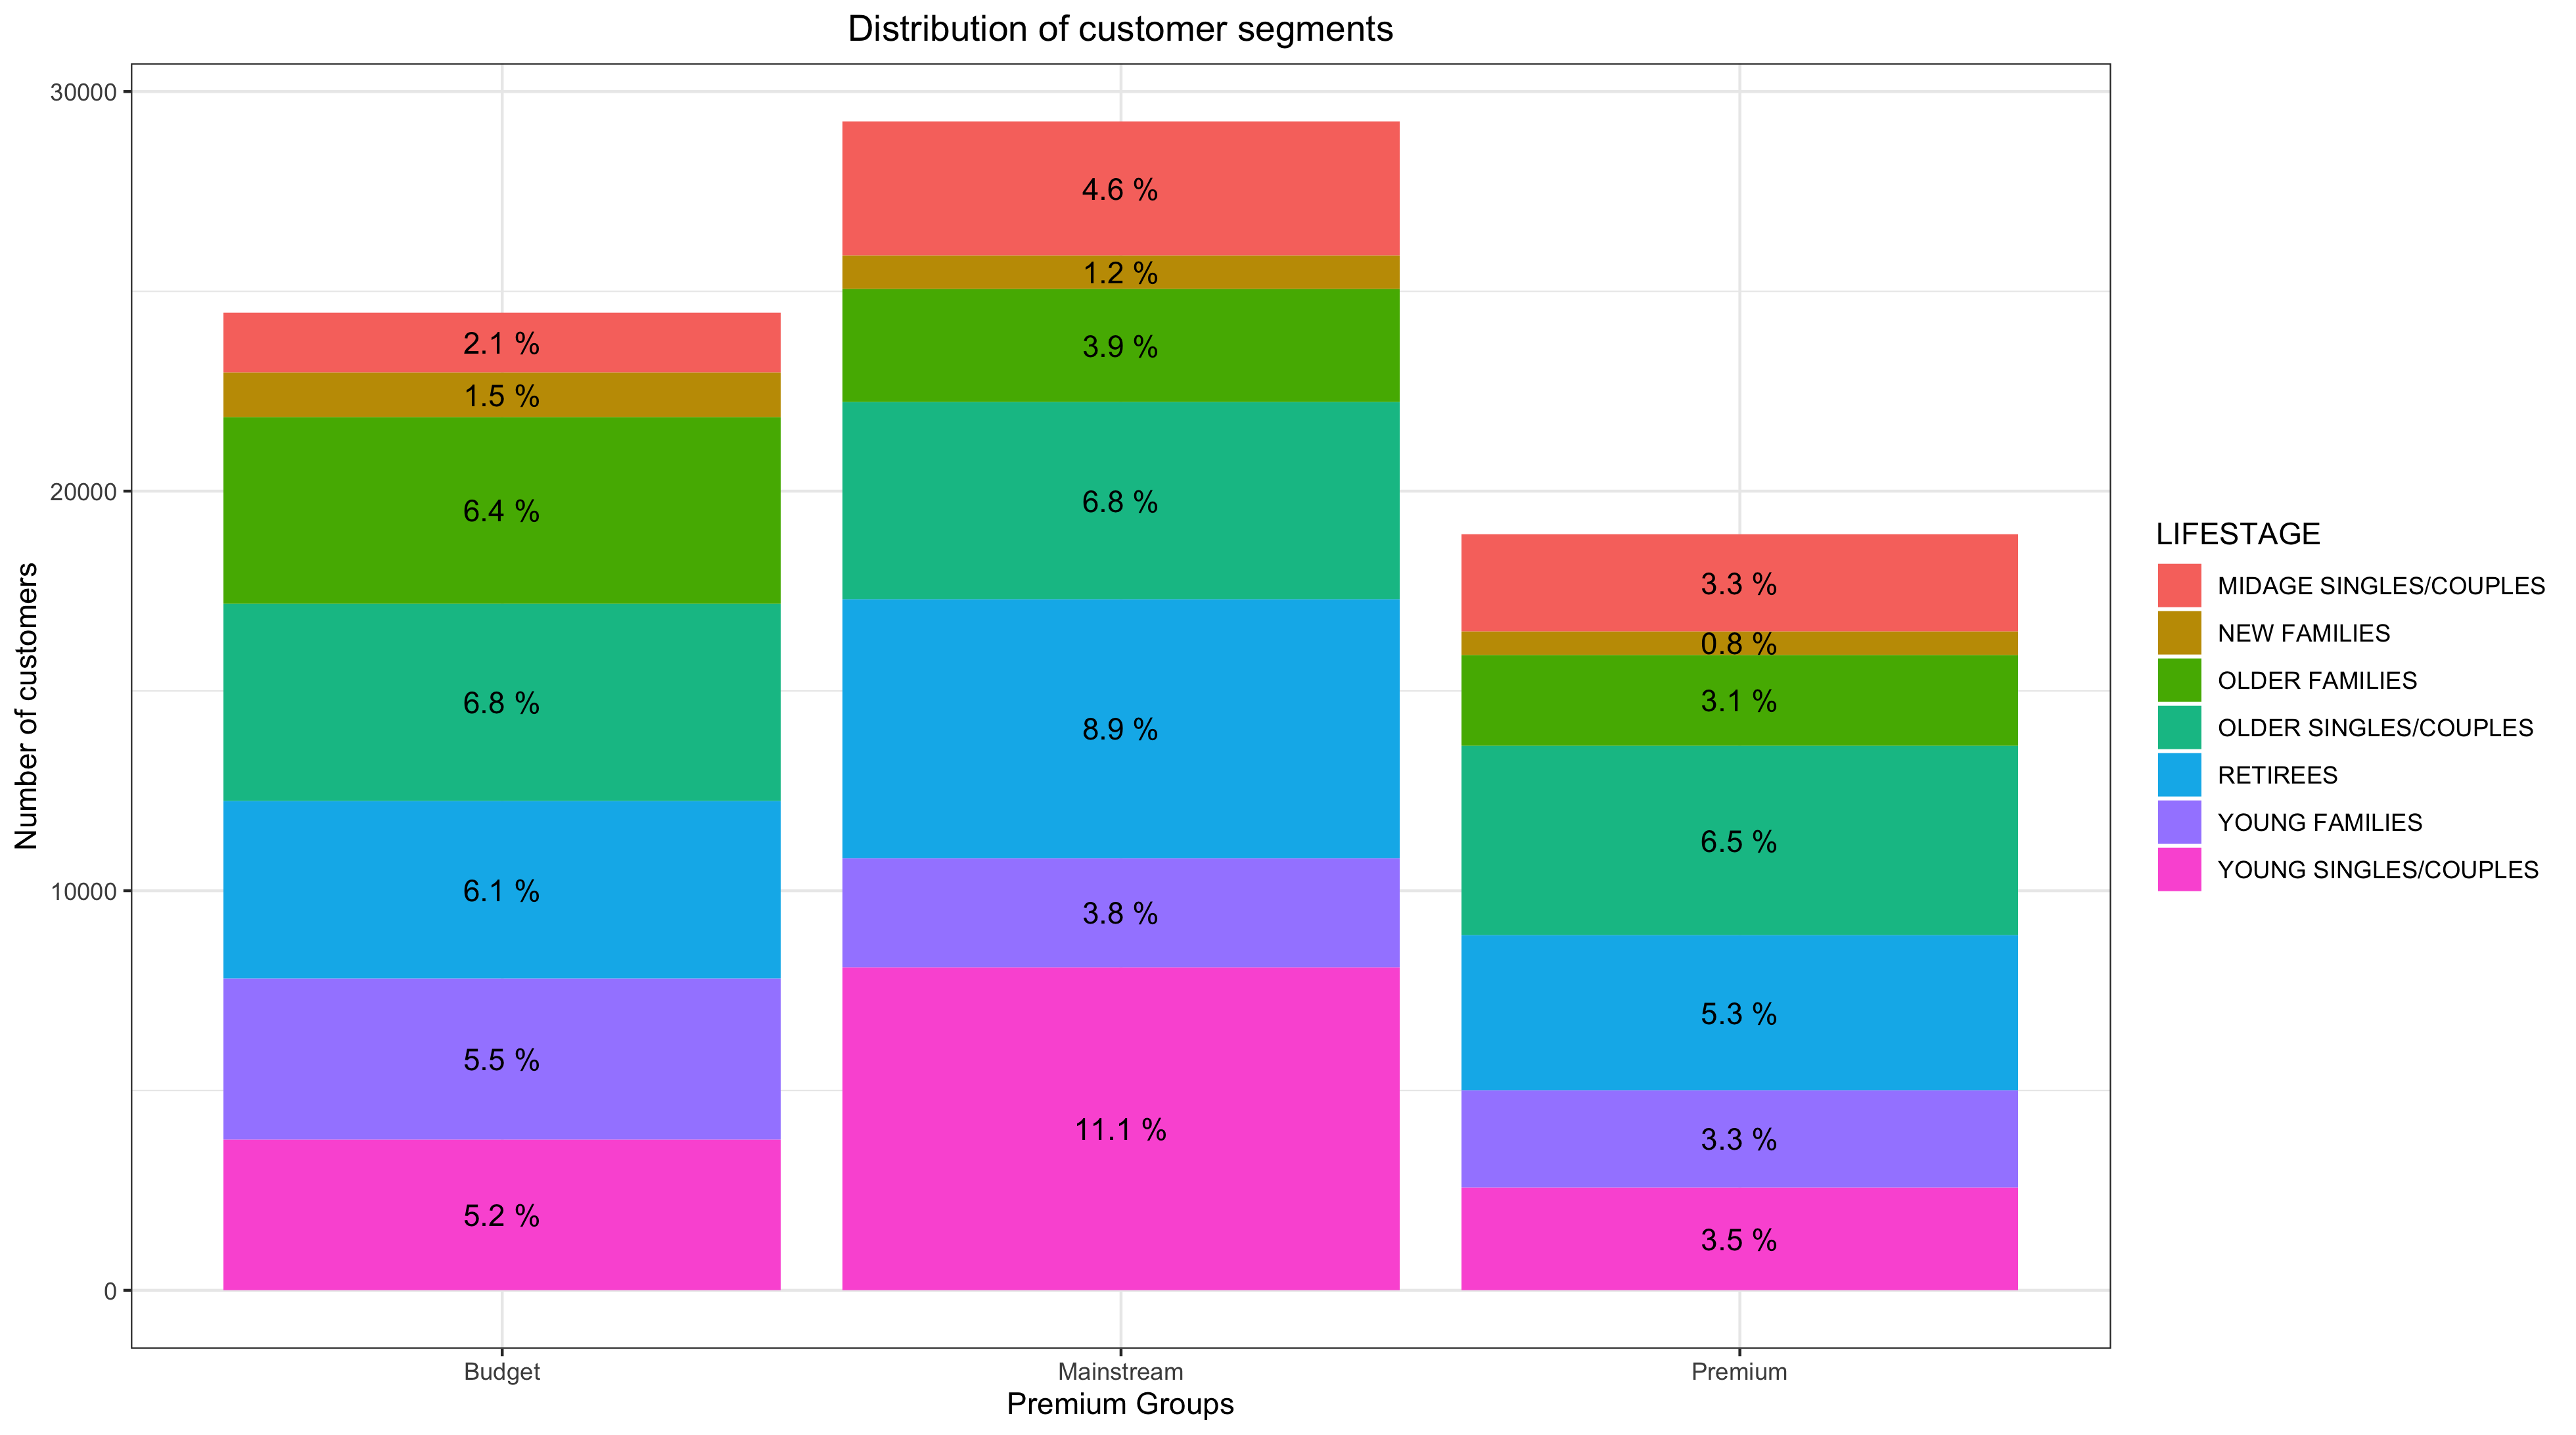 Distribution of customer segments by Lifestage and Premium groups
21 Brand names were extracted and made unnique from 114 distinct Product descriptions. 21 Customer Segments were formed based on 3 Lifestages and 7 Premium groups. Association between Brand names and Customer Segments were tested with Pearson Chi-squared test.
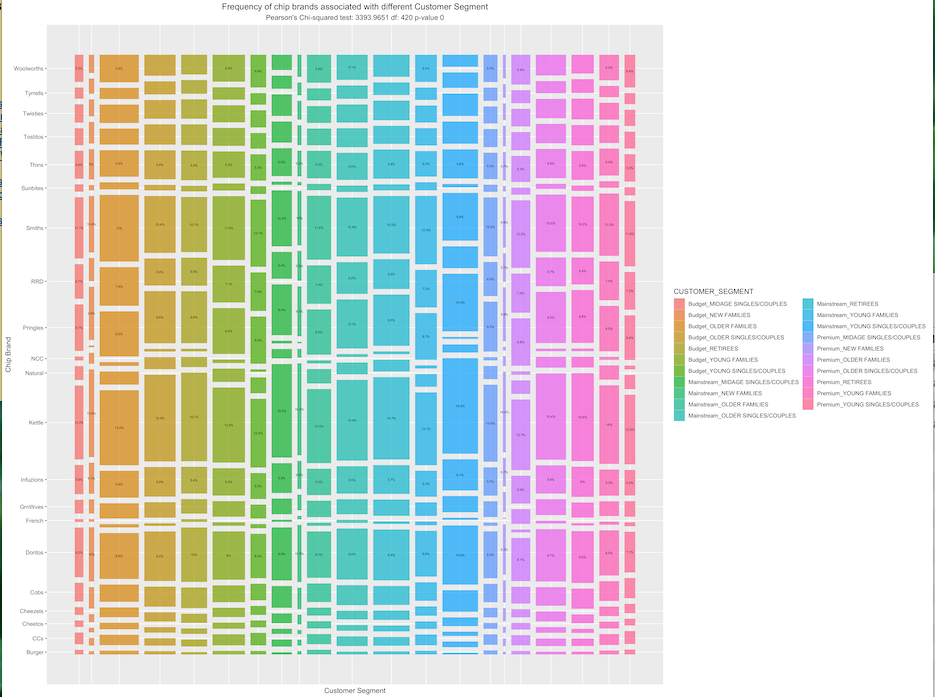 Brand names and Customer Segments Association
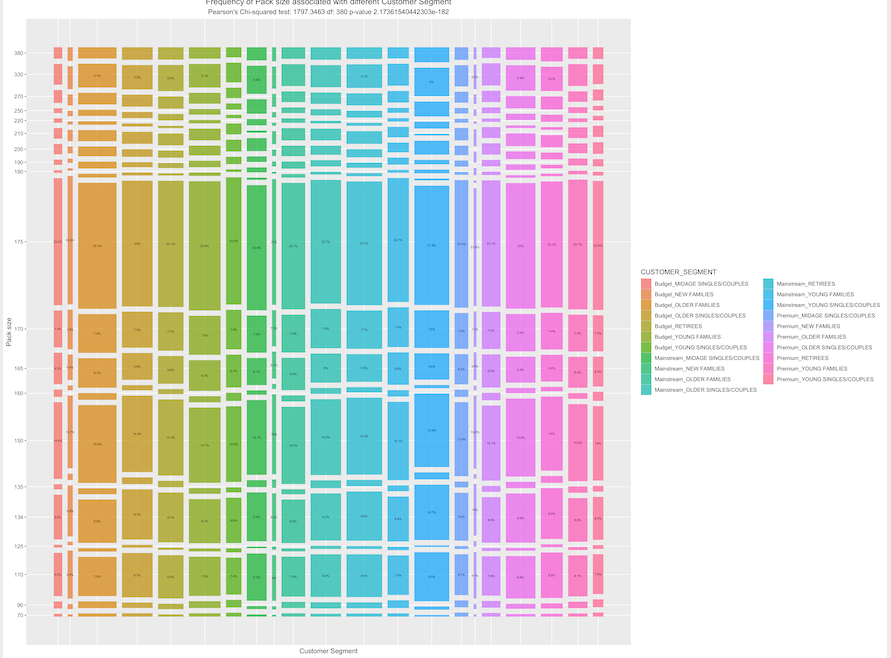
20 distinct pack sizes were extracted from Product descriptions. Association between Pack sizes and Customer Segments were tested with Pearson Chi-squared test.
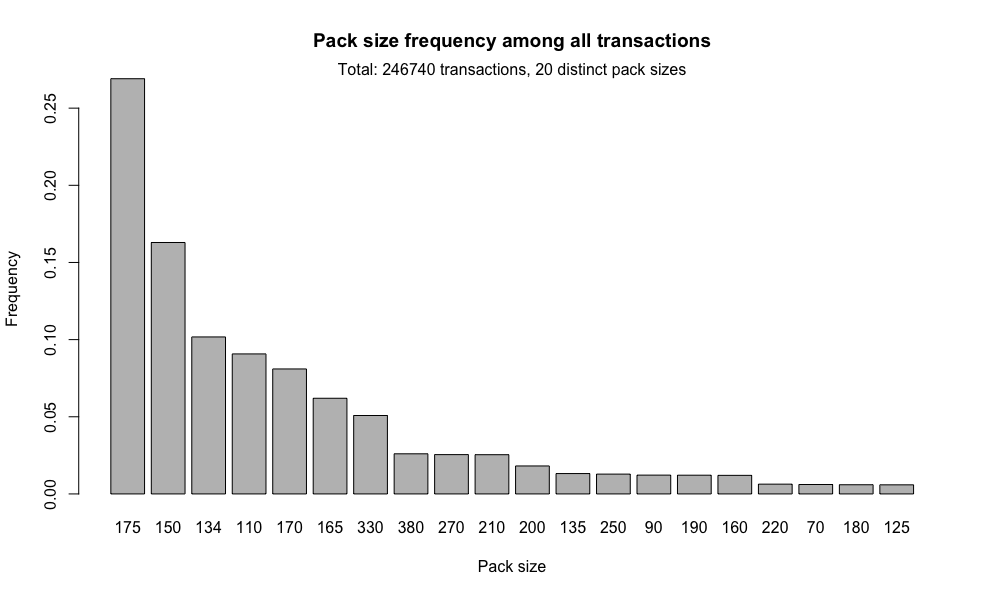
Pack Sizes and Customer Segments Association


