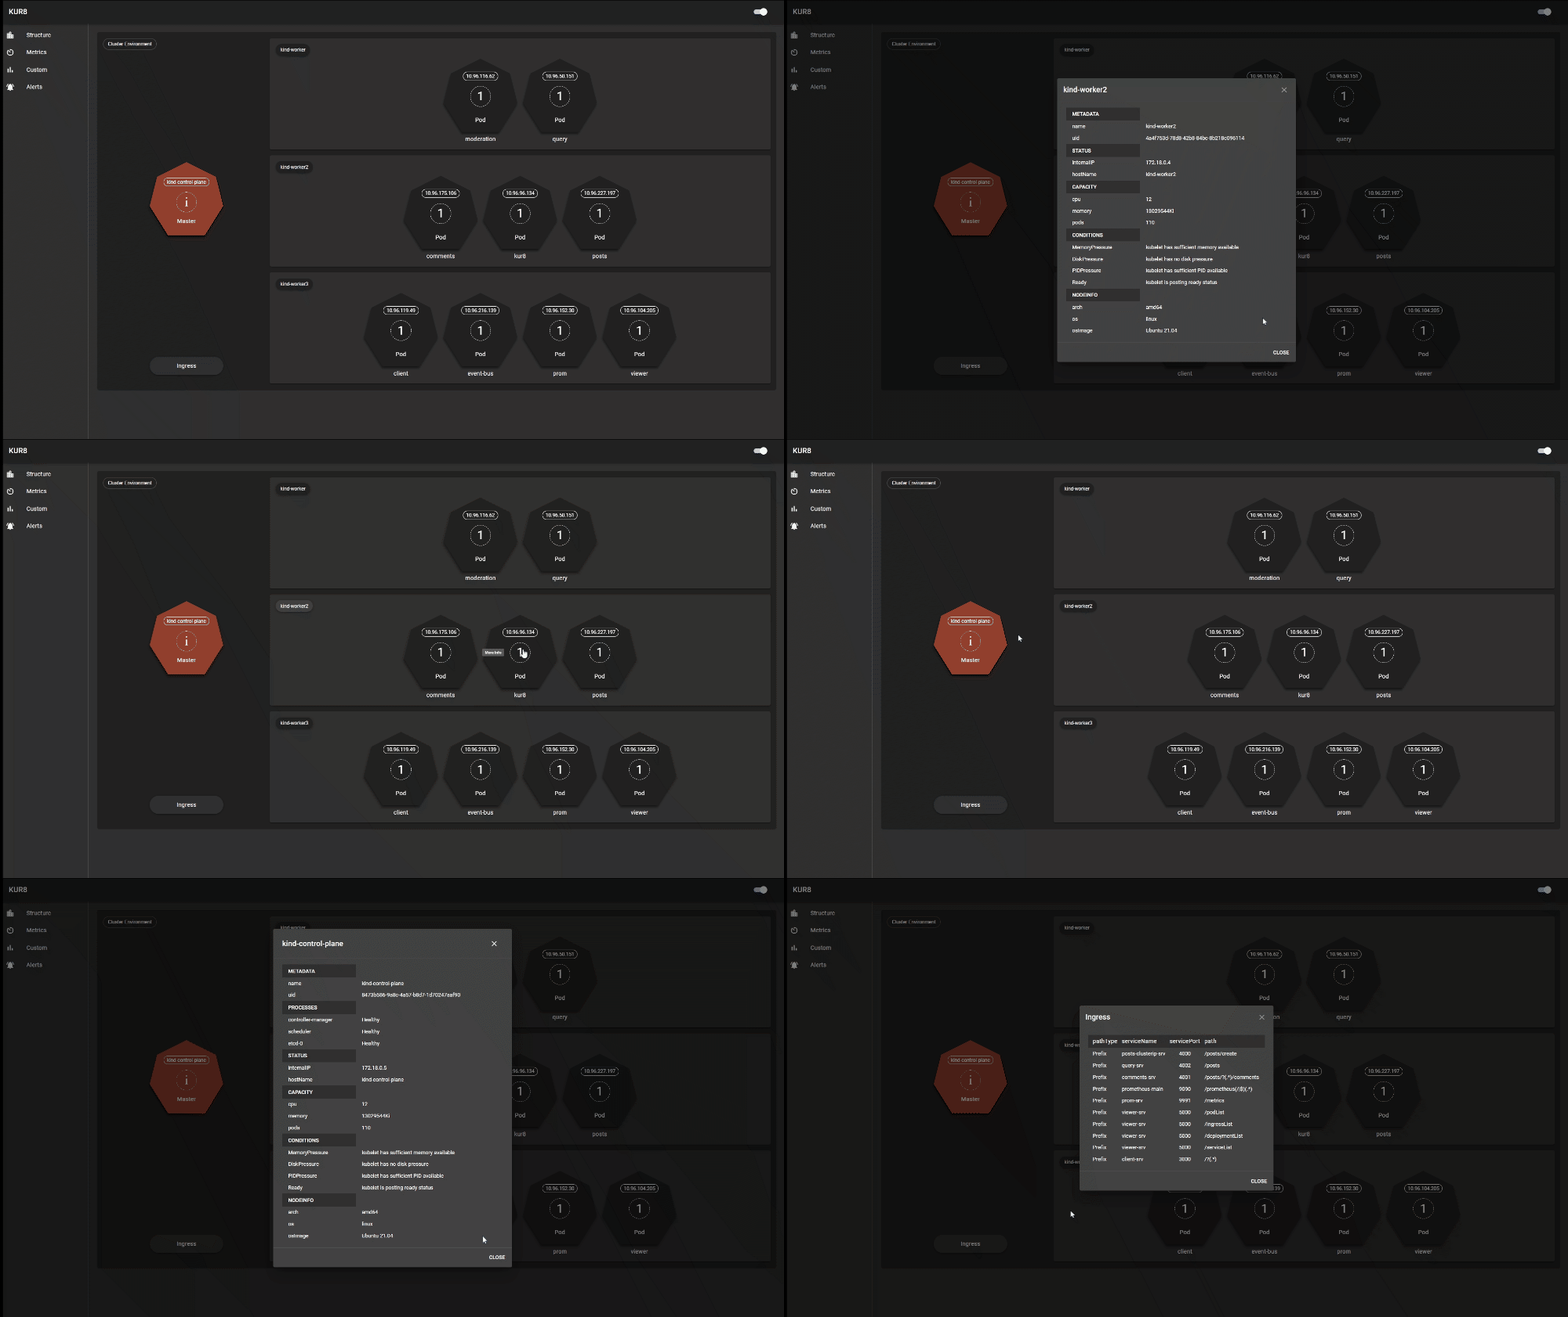
A visual overview of Kubernetes architecture and Prometheus metrics.
Navigate through the structures page to easily see your control planes and worker nodes with all their pods inside. Click on the components to see more details about its metadata, status, and specifications. Easily find information regarding the image IDs or IP addresses of anything from containers to ingresses.
Get the state of your cluster at a glance with our curated metrics dashboard.
Use our custom metrics page to use our PROMQL autocomplete feature to query any metrics you want.
All of your Prometheus alerts including your custom ones are displayed here in the Alerts tab. Find out if any alerts are firing and which rule groups they fall under.
Kur8 requires your Kubernetes cluster to be up and running
An image of the application has been pushed to Docker Hub for those who would like to build the image directly from the public repository.
We recommend deploying Kur8 directly to your Kubernetes cluster through kubectl using our config file kur8-depl.yaml.
kubectl apply -f kur8-depl.yaml
kubectl port-forward deployment/kur8-depl 3068:3068
In addition, in order to allow reading resources of the API, you must configure a set of permissions. We have set up a YAML file using RBAC authorization which you can apply directly to your Kubernetes cluster using the command line: fabric8-rbac.yaml
kubectl apply -f fabric8-rbac.yaml
Then, open your web browser to https://localhost:3068.
The structures tab on the left will query your Kubernetes API to view the cluster's architecture.
If you don't have your instance of Prometheus installed begin by cloning this repo:
In KUR8 directory run:
kubectl create -f infra/manifests/setup
Once setup is complete run:
kubectl create -f infra/manifests/
If you want to connect Kur8 to Prometheus open up the port by:
kubectl --namespace monitoring port-forward svc/prometheus-k8s 9090
You may also view the Prometheus tab in KUR8
localhost:8080
to view and create your custom dashboard.


