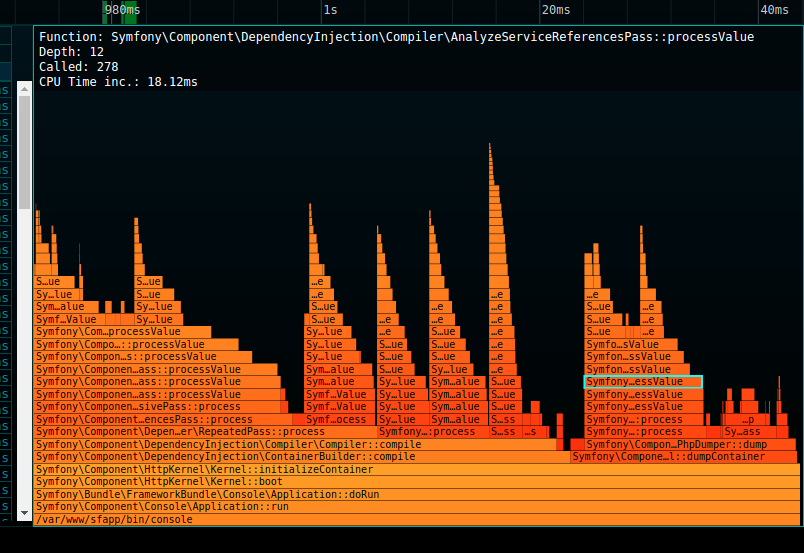
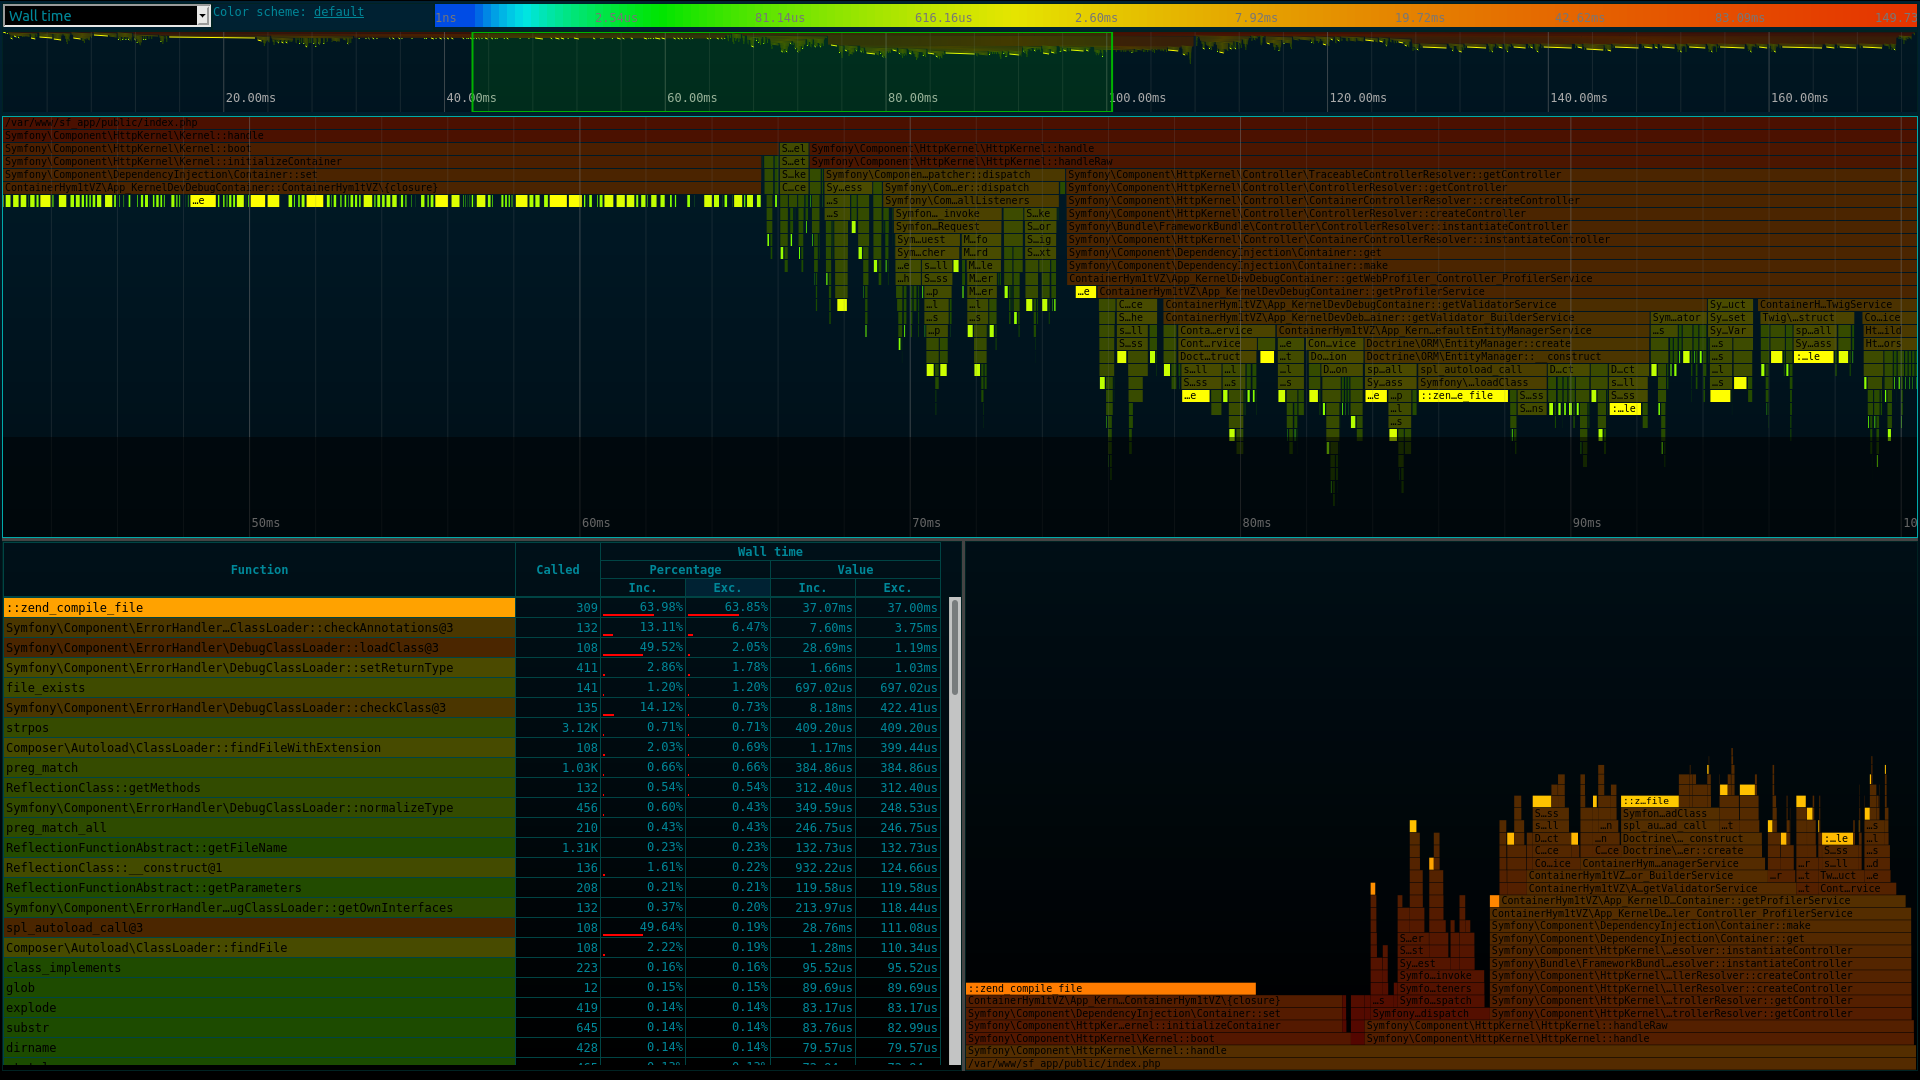
Click here for a live demo of the analysis screen
SPX, which stands for Simple Profiling eXtension, is just another profiling extension for PHP. It differentiates itself from other similar extensions as being:
- totally free and confined to your infrastructure (i.e. no data leaks to a SaaS).
- very simple to use: just set an environment variable (command line) or switch on a radio button (web request) to profile your script. Thus, you are free of:
- manually instrumenting your code (Ctrl-C a long running command line script is even supported).
- using a dedicated browser extension or command line launcher.
- multi metrics capable: 22 are currently supported (various time & memory metrics, included files, objects in use, I/O...).
- able to collect data without losing context. For example Xhprof (and potentially its forks) aggregates data per caller / callee pairs, which implies the loss of the full call stack and forbids timeline or Flamegraph based analysis.
- shipped with its web UI which allows to:
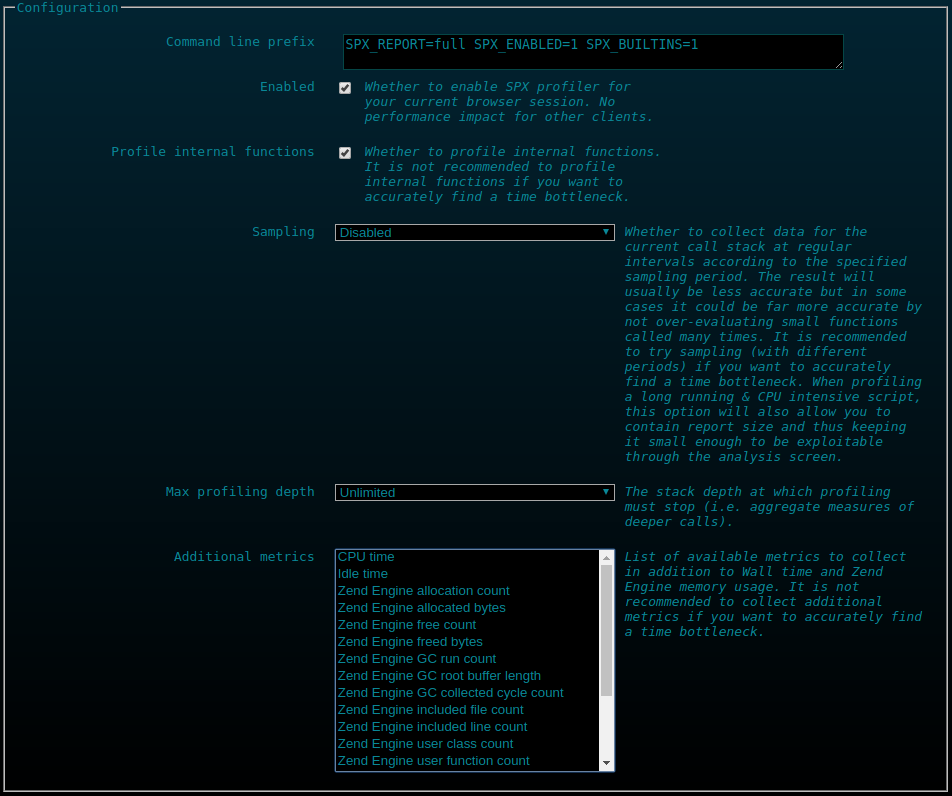
- enable / configure profiling for the current browser session
- list profiled script reports
- select a report for in-depth analysis, featuring these interactive visualizations:
- timeline (scale to millions of function calls)
- flat profile
- Flamegraph
Platforms support is currently quite limited. Feel free to open an issue if your platform is not supported. Current requirements are:
- x86-64 or ARM64
- GNU/Linux, macOS or FreeBSD
- zlib dev package (e.g. zlib1g-dev on Debian based distros)
- PHP 5.6 to 8.2
- Non-ZTS (threaded) build of PHP (ZTS support is theoretical)
- PHP development package (corresponding to your installed PHP version).
- zlib development package:
- For Debian based distros (including Ubuntu, Kubuntu...), just run:
sudo apt-get install zlib1g-dev. - For Fedora based distros (including CentOS, AlmaLinux, Rocky Linux...), just run:
sudo dnf install zlib-devel.
- For Debian based distros (including Ubuntu, Kubuntu...), just run:
git clone https://github.com/NoiseByNorthwest/php-spx.git
cd php-spx
git checkout release/latest
phpize
./configure
make
sudo make install
Then add extension=spx.so to your php.ini, or in a dedicated spx.ini file created within the include directory.
You may also want to override default SPX configuration to be able to profile a web request, with this one for example for a local development environment.
On GNU/Linux, SPX uses procfs (i.e. by reading files under /proc directory) to get some stats for the current process or thread. This is what is done under the hood when you select at least one of these metrics: mor, io, ior or iow.
But, on most PHP-FPM setups, you will have a permission issue preventing SPX to open a file under /proc/self directory.
This is due to the fact that PHP-FPM master process runs as root when child processes run as another unprivileged user.
When this is the case, the process.dumpable = yes line must be added to the FPM pool configuration so that child processes will be able to read any file under /proc/self.
This is still experimental. API might change, features might be added or dropped, or development could be frozen.
You can still safely use it in a non-production environment.
Contributions are welcome but be aware of the experimental status of this project and please follow the contribution rules described here: CONTRIBUTING.md
Assuming a development environment with the configuration described here and your application is accessible via https://localhost.
Just open with your browser the following URL: https://localhost/?SPX_KEY=dev&SPX_UI_URI=/ to access to the web UI control panel.
N.B.: https://localhost/ must be served by a PHP script through standard web server feature like directory index or URL rewriting. The PHP script will however not be executed, SPX will intercept and disable its execution to serve its content in place.
If you see only a blank page then make sure to set zlib.output_compression = 0 in your PHP configuration file
You will then see the following form:
Then switch on "Enabled". At this point profiling is enabled for the current domain and your current browser session through a set of dedicated cookies.
Profiling can also be triggered with Curl as shown in this example:
curl --cookie "SPX_ENABLED=1; SPX_KEY=dev" https://localhost/
N.B.: You can also enable the profiling at INI configuration level via the spx.http_profiling_enabled setting, and therefore for all HTTP requests. However, keep in mind that using this setting on a high-traffic environment could quickly exhaust the storage device's capacity of the SPX's data directory.
Then refresh the web request you want to profile and refresh the control panel to see the generated report in the list below the control panel form.
Then click on the report in the list and enjoy the analysis screen.
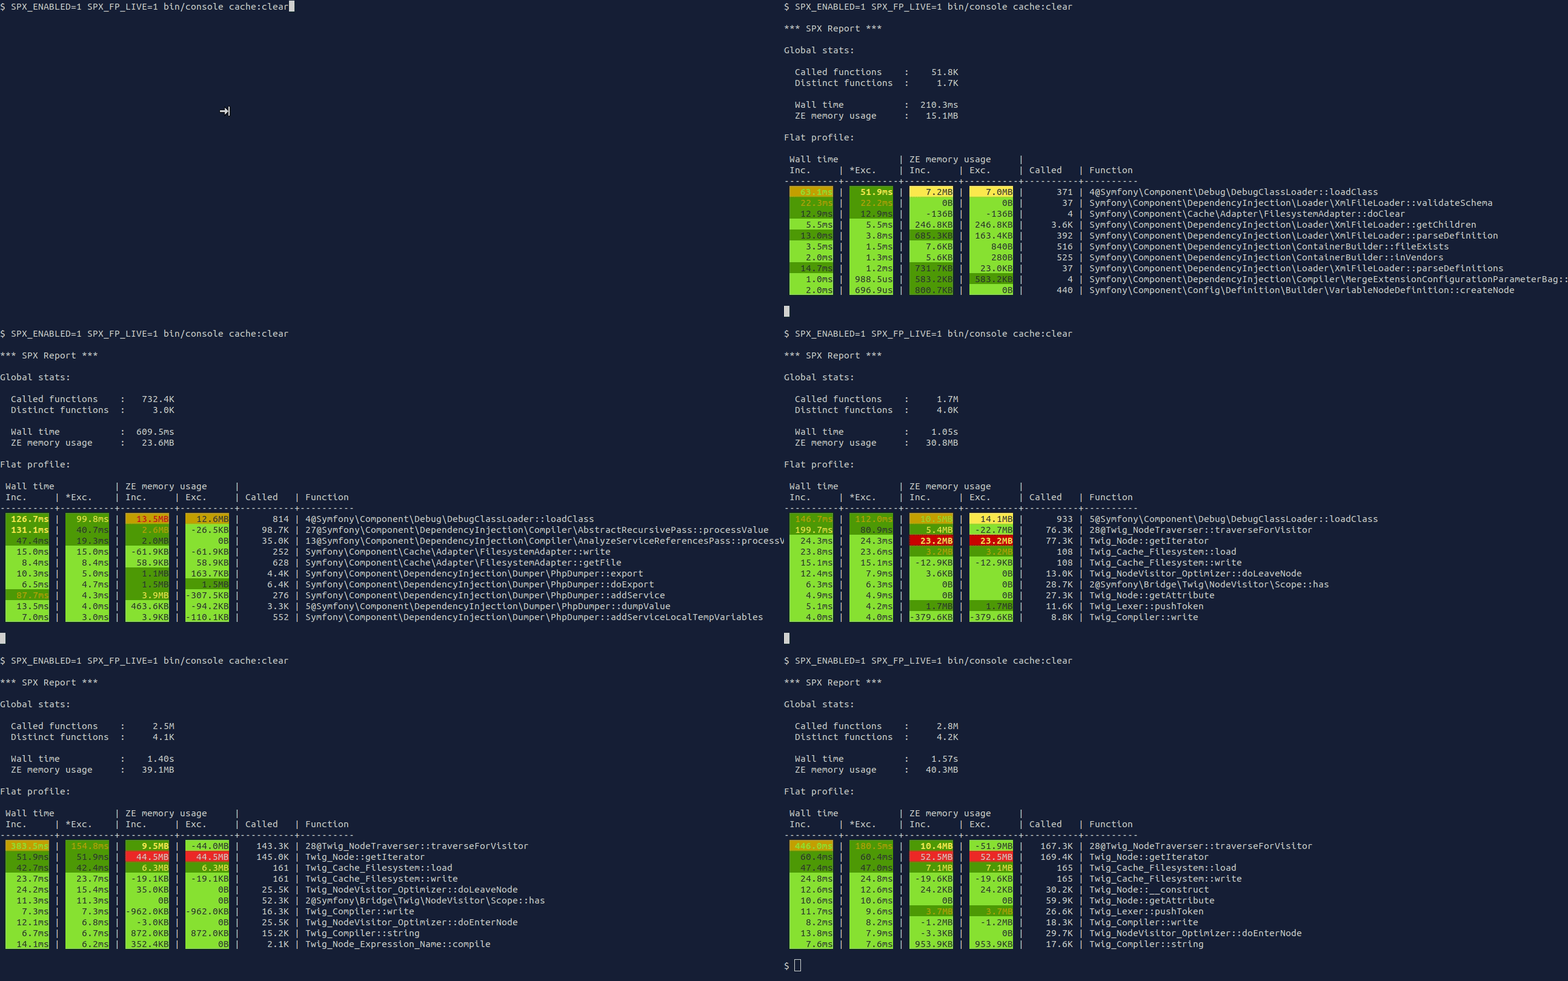
Just prepend your command line with SPX_ENABLED=1 to trigger profiling. You will get the flat profile printed on STDERR at the end of the execution, even if you abort it by hitting Ctrl-C, as in the following example:
$ SPX_ENABLED=1 composer update
Loading composer repositories with package information
Updating dependencies (including require-dev)
^C
*** SPX Report ***

Global stats:

  Called functions    :    27.5K
  Distinct functions  :      714

  Wall time           :    7.39s
  ZE memory           :   62.6MB

Flat profile:

 Wall time           | ZE memory           |
 Inc.     | *Exc.    | Inc.     | Exc.     | Called   | Function
----------+----------+----------+----------+----------+----------
  101.6ms |  101.6ms |   41.8MB |   41.8MB |       12 | Composer\Json\JsonFile::parseJson
   53.6ms |   53.6ms |     544B |     544B |        4 | Composer\Cache::sha256
    6.91s |   41.5ms |   41.5MB |   -7.5MB |        4 | Composer\Repository\ComposerRepository::fetchFile
    6.85s |   32.3ms |   47.5MB |    5.4MB |        5 | 1@Composer\Repository\ComposerRepository::loadProviderListings
    7.8ms |    7.8ms |       0B |       0B |        4 | Composer\Cache::write
    1.1ms |    1.1ms |     -72B |     -72B |        1 | Composer\Console\Application::Composer\Console\{closure}
  828.5us |  828.5us |     976B |     976B |       12 | Composer\Util\RemoteFilesystem::findHeaderValue
  497.6us |  491.0us |  710.2KB |  710.2KB |        1 | Composer\Cache::read
    2.4ms |  332.6us |   20.9KB | -378.8KB |       34 | 3@Symfony\Component\Finder\Iterator\FilterIterator::rewind
  298.9us |  298.9us |    2.2KB |    2.2KB |       47 | Symfony\Component\Finder\Iterator\FileTypeFilterIterator::accept
N.B.: Just add SPX_FP_LIVE=1 to enable the live refresh of the flat profile during script execution.
You just have to specify SPX_REPORT=full to generate a report available via the web UI:
SPX_ENABLED=1 SPX_REPORT=full ./bin/console cache:clearIf your CLI script is long-living and/or daemonized (e.g. via supervisord), profiling its whole lifespan could be meaningless. This is especially true in case of a service waiting for tasks to process.
To handle this case, SPX allows to disable the automatic start of profiling and exposes 2 userland functions, spx_profiler_start(): void & spx_profiler_stop(): ?string, in order to respectively control the start and the end of the profiled spans.
Here is how you can instrument your script:
<?php

while ($task = get_next_ready_task()) {
  spx_profiler_start();
  try {
    $task->process();
  } finally {
    spx_profiler_stop();
  }
}
And of course this script must be run at least with profiling enabled and the automatic start disabled as in the following command:
SPX_ENABLED=1 SPX_REPORT=full SPX_AUTO_START=0 my_script.phpAutomatic start can also be disabled for web requests via the spx.http_profiling_auto_start INI parameter or via the control panel.
Side notes:
spx_profiler_start()andspx_profiler_stop()can safely be nested.- when profiling with the full report type,
spx_profiler_stop()returns the report key so that you will be able to store it somewhere, for instance among other information related to the profiled span. With the report key you can build the analysis screen URL which ends with this pattern/?SPX_UI_URI=/report.html&key=<report key>. - in CLI context, when automatic start is disabled, no signal handlers (i.e. on SIGINT/SIGTERM) are registered by SPX.
When profiling with full report as output, it could be handy to add custom metadata to the current report so that you will be able to easily retrieve it or differentiate it from other similar reports.
This is especially true for the long-living process use case which otherwise would not allow to differentiate a report from other ones of the same process.
To do that SPX exposes the spx_profiler_full_report_set_custom_metadata_str(string $customMetadataStr): void function.
As you may have notificed, this function accepts a string as custom metadata, for the sake of flexibility and simplicity on SPX side. It is up to you to encode any structured data to a string, for instance using JSON format.
The metadata string is limited to 4KB, which is large enough for most use cases. If you pass a string exceeding this limit it will be discarded and a notice log will be emitted.
This string will be stored among other current report's metadata and you will retrieve it in the report list on web UI side.
spx_profiler_full_report_set_custom_metadata_str() can be called at any moment as long as the profiler is already started and not finished yet, which means:
- at any moment during the script execution when automatic start is enabled (default mode).
- at any moment after the call of
spx_profiler_start()and before the call ofspx_profiler_stop()when automatic start is disabled.
Here is an example:
<?php

while ($task = get_next_ready_task()) {
  spx_profiler_start();

  spx_profiler_full_report_set_custom_metadata_str(json_encode(
    [
      'taskId' => $task->getId(),
    ]
  ));

  try {
    $task->process();
  } finally {
    spx_profiler_stop();
  }
}| Name | Default | Changeable | Description |
|---|---|---|---|
| spx.data_dir | /tmp/spx |
PHP_INI_SYSTEM | The directory where profiling reports will be stored. You may change it to point to a shared file system for example in case of multi-server architecture. |
| spx.http_enabled | 0 |
PHP_INI_SYSTEM | Whether to enable web UI and HTTP request profiling. |
| spx.http_key | PHP_INI_SYSTEM | The secret key used for authentication (see security concern for more details). You can use the following command to generate a 16 bytes random key as an hex string: openssl rand -hex 16. |
|
| spx.http_ip_var | REMOTE_ADDR |
PHP_INI_SYSTEM | The $_SERVER key holding the client IP address used for authentication (see security concern for more details). Overriding the default value is required when your application is behind a reverse proxy. |
| spx.http_trusted_proxies | 127.0.0.1 |
PHP_INI_SYSTEM | The trusted proxy list as a comma separated list of IP addresses. This setting is ignored when spx.http_ip_var's value is REMOTE_ADDR. |
| spx.http_ip_whitelist | PHP_INI_SYSTEM | The IP address white list used for authentication as a comma separated list of IP addresses, use * to allow all IP addresses. |
|
| spx.http_ui_assets_dir | /usr/local/share/misc/php-spx/assets/web-ui |
PHP_INI_SYSTEM | The directory where the web UI files are installed. In most cases you do not have to change it. |
| spx.http_profiling_enabled | NULL | PHP_INI_SYSTEM | The INI level counterpart of the SPX_ENABLED parameter, for HTTP requests only. See here for more details. |
| spx.http_profiling_auto_start | NULL | PHP_INI_SYSTEM | The INI level counterpart of the SPX_AUTO_START parameter, for HTTP requests only. See here for more details. |
| spx.http_profiling_builtins | NULL | PHP_INI_SYSTEM | The INI level counterpart of the SPX_BUILTINS parameter, for HTTP requests only. See here for more details. |
| spx.http_profiling_sampling_period | NULL | PHP_INI_SYSTEM | The INI level counterpart of the SPX_SAMPLING_PERIOD parameter, for HTTP requests only. See here for more details. |
| spx.http_profiling_depth | NULL | PHP_INI_SYSTEM | The INI level counterpart of the SPX_DEPTH parameter, for HTTP requests only. See here for more details. |
| spx.http_profiling_metrics | NULL | PHP_INI_SYSTEM | The INI level counterpart of the SPX_METRICS parameter, for HTTP requests only. See here for more details. |
For your local & private development environment, since there is no need for authentication, you can use this configuration:
spx.http_enabled=1
spx.http_key="dev"
spx.http_ip_whitelist="127.0.0.1"
And then access to the web UI at http(s):https://<your application host>/?SPX_KEY=dev&SPX_UI_URI=/.
Here is the list of available metrics to collect. By default only Wall time and Zend Engine memory usage are collected.
| Key (command line) | Name | Description |
|---|---|---|
| wt | Wall time | The absolute elapsed time. |
| ct | CPU time | The time spent while running on CPU. |
| it | Idle time | The time spent off-CPU, that means waiting for CPU, I/O completion, a lock acquisition... or explicitly sleeping. |
| zm | Zend Engine memory usage | Equivalent to memory_get_usage(false). |
| zmac | Zend Engine allocation count | Number of memory allocations (i.e. allocated blocks) performed. |
| zmab | Zend Engine allocated bytes* | Number of allocated bytes. |
| zmfc | Zend Engine free count | Number of memory releases (i.e. freed blocks) performed. |
| zmfb | Zend Engine freed bytes* | Number of freed bytes. |
| zgr | Zend Engine GC run count | Number of times the GC (cycle collector) have been triggered (either manually or automatically). |
| zgb | Zend Engine GC root buffer length | Root buffer length, see explanation here. It could be helpful to track pressure on garbage collector. |
| zgc | Zend Engine GC collected cycle count | Total number of collected cycles through all GC runs. |
| zif | Zend Engine included file count | Number of included files. |
| zil | Zend Engine included line count | Number of included lines. |
| zuc | Zend Engine user class count | Number of userland classes. |
| zuf | Zend Engine user function count | Number of userland functions (including userland class/instance methods). |
| zuo | Zend Engine user opcode count | Number of included userland opcodes (sum of all userland file/function/method opcodes). |
| zo | Zend Engine object count | Number of objects currently held by user code. |
| ze | Zend Engine error count | Number of raised PHP errors. |
| mor | Process's own RSS** | The part of the process's memory held in RAM. The shared (with other processes) memory blocks are not taken into account. This metric can be useful to highlight a memory leak within a PHP extension or deeper (e.g. a third-party C library). |
| io | I/O (reads + writes)** | Bytes read or written while performing I/O. |
| ior | I/O (reads)** | Bytes read while performing I/O. |
| iow | I/O (writes)** | Bytes written while performing I/O. |
*: Allocated and freed byte counts will not be collected if you use a custom allocator or if you force the libc one through the USE_ZEND_ALLOC environment variable set to 0.
**: RSS & I/O metrics are not supported on macOS and FreeBSD. On GNU/Linux you should read this if you use PHP-FPM.
Contrary to web request profiling which only support full report type (the one exploitable by the web UI), command line script profiling supports several types of report. Here is the list below:
| Key | Name | Description |
|---|---|---|
| fp | Flat profile | The flat profile provided by SPX. It is the default report type and is directly printed on STDERR. |
| full | Full report | This is the report type for web UI. Reports will be stored in SPX data directory and thus will be available for analysis on web UI side. |
| trace | Trace file | A custom format (human readable text) trace file. |
| Name | Default | Description |
|---|---|---|
| SPX_ENABLED | 0 |
Whether to enable SPX profiler (i.e. triggering profiling). When disabled there is no performance impact on your application. |
| SPX_AUTO_START | 1 |
Whether to enable SPX profiler's automatic start. When automatic start is disabled, you have to start & stop profiling on your own at runtime via the spx_profiler_start() & spx_profiler_stop() functions. See here for more details. |
| SPX_BUILTINS | 0 |
Whether to profile internal functions, script compilations, GC runs and request shutdown. |
| SPX_DEPTH | 0 |
The stack depth at which profiling must stop (i.e. aggregate measures of deeper calls). 0 (default value) means unlimited. |
| SPX_SAMPLING_PERIOD | 0 |
Whether to collect data for the current call stack at regular intervals according to the specified sampling period (0 means no sampling). The result will usually be less accurate but in some cases it could be far more accurate by not over-evaluating small functions called many times. It is recommended to try sampling (with different periods) if you want to accurately find a time bottleneck. When profiling a long running & CPU intensive script, this option will allow you to contain report size and thus keeping it small enough to be exploitable by the web UI. See here for more details. |
| SPX_METRICS | wt,zm |
Comma separated list of available metric keys to collect. All report types take advantage of multi-metric profiling. |
| SPX_REPORT | fp |
Selected report key. |
| SPX_FP_FOCUS | wt |
Metric key for flat profile sort. |
| SPX_FP_INC | 0 |
Whether to sort functions by inclusive value instead of exclusive value in flat profile. |
| SPX_FP_REL | 0 |
Whether to display metric values as relative (i.e. percentage) in flat profile. |
| SPX_FP_LIMIT | 10 |
The flat profile size (i.e. top N shown functions). |
| SPX_FP_LIVE | 0 |
Whether to enable flat profile live refresh. Since it plays with cursor position through ANSI escape sequences, it uses STDOUT as output, replacing script output (both STDOUT & STDERR). |
| SPX_FP_COLOR | 1 |
Whether to enable flat profile color mode. |
| SPX_TRACE_SAFE | 0 |
The trace file is by default written in a way to enforce accuracy, but in case of process crash (e.g. segfault) some logs could be lost. If you want to enforce durability (e.g. to find the last event before a crash) you just have to set this parameter to 1. |
| SPX_TRACE_FILE | Custom trace file name. If not specified it will be generated in /tmp and displayed on STDERR at the end of the script. |
Well, as you might already noticed in corresponding basic usage example, setting a SPX parameter for a command line script simply means setting an environment variable with the same name.
Since the web UI uses advanced JavaScript features, only the following browsers are known to be supported:
- most recent version of any Chromium-based browser.
- most recent version of Firefox.
This is the home page of the web UI, divided into 2 parts:
- the control panel for setting the profiling setup for your current browser session.
- the profile report list as a sortable table. A click on a row allows to go to the analysis screen for the corresponding report.
Click here for a live demo of the analysis screen
The analysis screen can nicely handle profile reports with up to several (5+) millions of recorded function calls with Chromium on my i5 @ 3.3GHz / 8GB desktop. In case you want to profile a long running, CPU intensive, script which tends to generate giant reports, you can enable sampling mode with the suitable sampling period. See SPX_SAMPLING_PERIOD parameter for command line script.
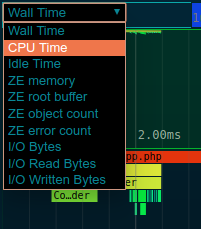
This is simply a combo box for selecting the currently analyzed metric.
By default, function related blocks in the visualizations are colored according to their cost, with a color scale displayed at the top right of the screen.
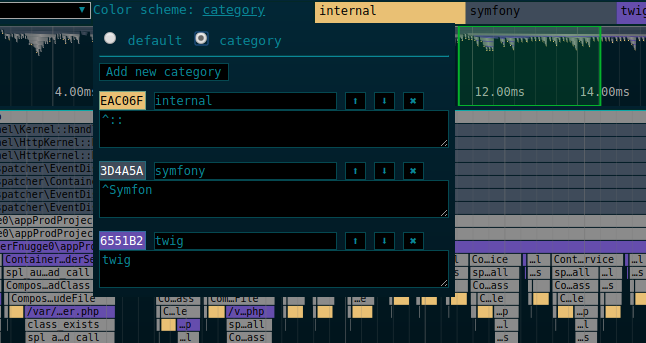
You can also define a custom color scheme by clicking on the color scheme mode link, displayed at the top of the screen just after the metric selector.
A drop-down window will then appear and allow you to switch between default and category mode and define (add/edit/delete) your categories (color, name, pattern list) for the category mode (see the screenshot below).
This visualization is the timeline overview of all called functions. You can change the selected time range by, represented by a transparent green rectangle, by simply dragging it horizontally.
Except for wall time, the current metric is also plotted (current value over time) on a foreground layer.
Supported controls:
- horizontal left click drag: shift the selected time range
- resize click on selected time range rectangle: shift one of the selected time range boundary
This visualization is an interactive timeline which is able to control and keep focus on the selected time range.
Supported controls:
- left click drag: time range shift (horizontal) or depth range shift (vertical)
- middle click vertical drag: time range zoom in/out
- mouse wheel: time range zoom in/out
- hovering a function call to show more details
- double click on a function call: set the current time range as the one of the selected function call
Except for wall time, the current metric is also plotted (current value over time) on a foreground layer.
This visualization is the flat profile for the selected time range and the selected metric, displayed as a sortable table.
The Inc. and Exc. sub-columns respectively correspond to:
- the inclusive resource consumption of the function, including its called functions consumption
- the exclusive resource consumption of the function, excluding its called functions consumption
This visualization, designed by Brendan Gregg, allows to quickly find the hot code path for the selected time range and the selected metric. Metrics corresponding to releasable resources (memory, objects in use...) are not supported by this visualization.
You can highlight a function by clicking on one of its spans within the timeline or Flamegraph widgets or its name within the flat profile widget.
The lack of review / feedback about this concern is the main reason SPX cannot yet be considered as production ready.
SPX allows you to profile web request as well as command line scripts, and also to list and analyze profile reports through its embedded web UI. This is why there is a huge security risk, since an attacker could:
- access to web UI and get sensible information about your application.
- to a lesser extent, make a DoS attack against your application with a costly profiling setup.
So, unless access to your application is already restricted at lower layer (i.e. before your application is hit, not by the application / PHP framework itself), a client triggering profiling or accessing to the web UI must be authenticated.
SPX provides two-factor authentication with these 2 mandatory locks:
- IP address white list (exact string representation matching).
- Fixed secret random key (generated on your own) provided via a request header, cookie or query string parameter.
Thus a client can profile your application via a web request only if its IP address is white listed and its provided key is valid.
In tracing mode (default), SPX is subject to accuracy issues for time related metrics when the measured function execution time is:
- close or lower than the timer precision
- close or lower than SPX's own per function overhead
The first issue is mitigated by using the highest resolution timer provided by the platform. On Linux, FreeBSD & recent macOS versions the timer resolution is 1ns; on macOS before 10.12/Sierra, the timer resolution is only 1us.
The second issue is mitigated by taking into account SPX's time (wall / cpu) overhead by subtracting it to measured function execution time. This is done by evaluating SPX constant per function overhead before starting profiling the script.
However, whatever the platform, if you want to maximize accuracy to find a time bottleneck, you should also:
- avoid profiling internal functions.
- avoid collecting additional metrics.
- try sampling mode with different sampling periods.
- try to play with maximum depth parameter to stop profiling at a given depth.
Stubs for SPX functions to be used with Intelephense
composer require --dev 8ctopus/php-spx-stubs
I have found lot of inspiration and hints reading:
SPX is open source software licensed under the GNU General Public License (GPL-3). See the LICENSE file for more information.

