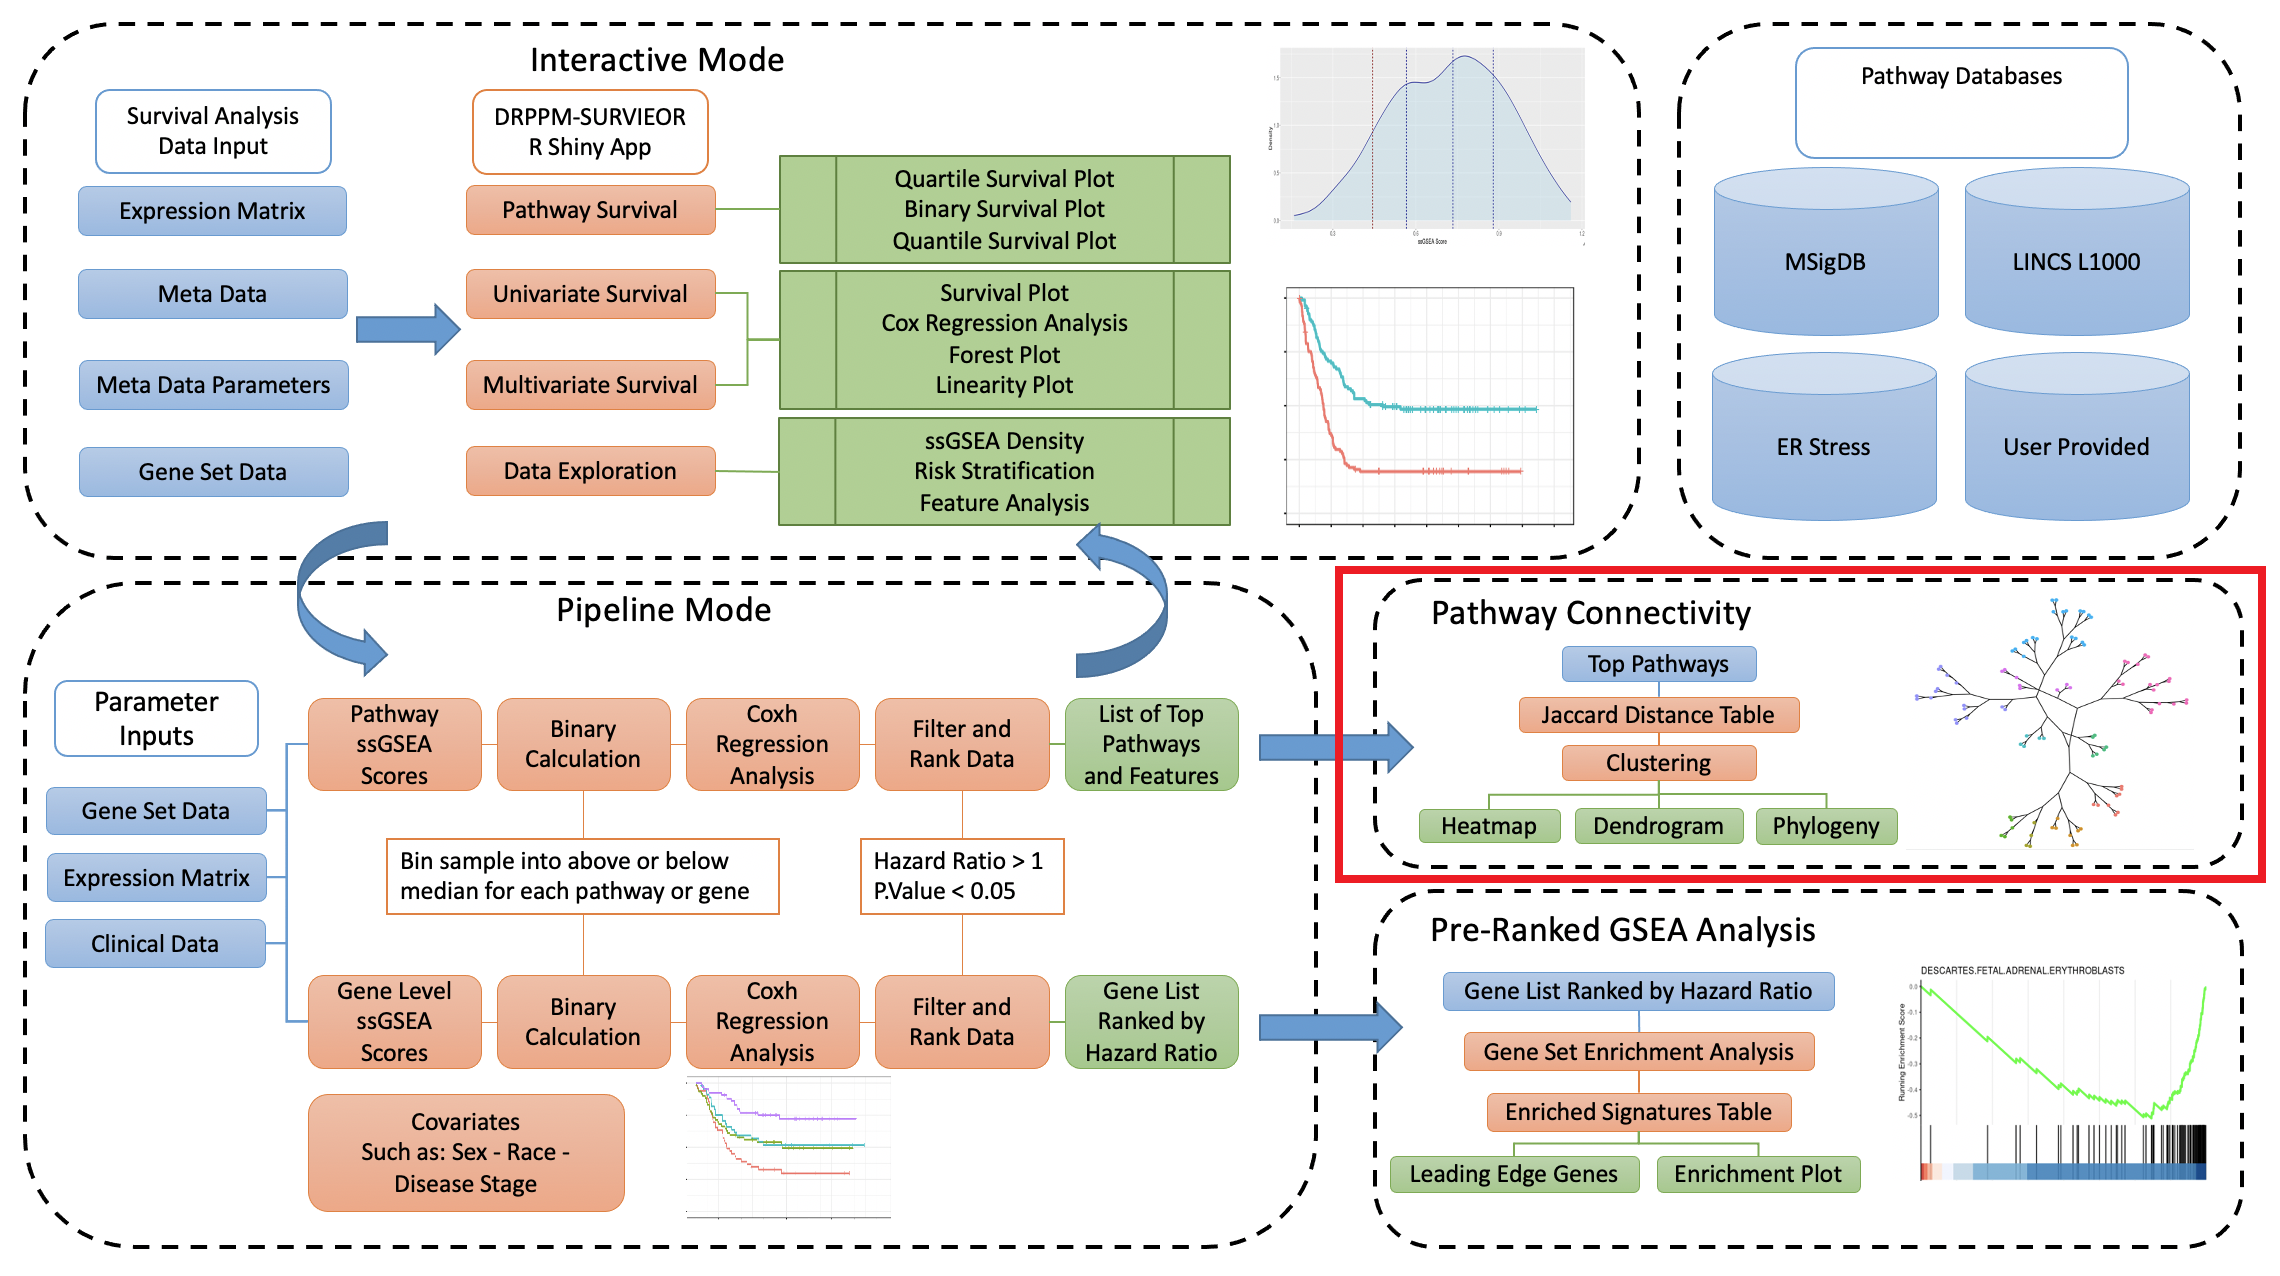
The integration of patient genome expression data, phenotypye data, and clinical data can serve as an integral resource for patient prognosis. DRPPM PATH SURVEIOR: Pathway level Survival Examinator serves to do just that, by examining the interaction of pathway analysis with patient expression and cilinical data to discover prominent features that take part in patient outcome. This utility is comprised of 3 R Shiny apps and a pipeline script which can be employed in a cohesive manor to provide an in-depth analysis towards pathway analysis of patient survival. Gene Set pathways utilized in this workflow include the Molecular Signatures Database (MSigDB), LINCS L1000 Small-Molecule Perturbations, and Clue.io ER Stress signtatures, as well as user provided gene sets.
Here we focus on the Pathway Connectivity portion of this workflow with the DRPPM-Jaccard-Pathway-Connectivity R Shiny App. This app takes a list of gene sets as input and performs a Jaccard distance calculation to determine the proximity on the gene sets to one another. Working in tandem with the DRPPM-PATH-SURVEIOR pipeline, the user may subset a top portion of the gene sets that were output from the comprehensive Cox Proportional Hazard table and use that as input to the Jaccard Connectivity app. This allows the user to gain another perspective on the top gene sets identified and how they cluster together by utilizing visualiztions of heatmaps, dendrograms, and phylogeny-type branched outputs.
An example Jaccard Connectivity R Shiny App is hosted here: http:https://shawlab.science/shiny/DRPPM_PATH_SURVEIOR_Jaccard_Connectivity_App/ where you are welcome to use the example inputs provided in the GitHub or your own to explore.
- R Shiny Base Survival App [Interactive Mode]: https://github.com/shawlab-moffitt/DRPPM-PATH-SURVEIOR
- R Script for Cox Proportional Hazards Ranking [Pipeline Mode]: https://github.com/shawlab-moffitt/DRPPM-PATH-SURVEIOR-Pipeline
- R Shiny Jaccard Connectivity App: https://github.com/shawlab-moffitt/DRPPM-Jaccard-Pathway-Connectivity
- R Shiny Pre-Ranked GSEA App: https://github.com/shawlab-moffitt/DRPPM-PreRanked-GSEA
- Download the Zip File from this GitHub repository: https://github.com/shawlab-moffitt/DRPPM-Jaccard-Pathway-Connectivity
- Unzip the downloaded file into the folder of your choice.
- Set your working directory in R to the local version of the repository
- This can be done through the "More" settings in the bottom-right box in R Stuido
- You may also use the
setwd()function in R Console.
- Clone the GitHub Repository into the destination of your choice.
- Can be done in R Studio Terminal or a terminal of your choice
git clone https://github.com/shawlab-moffitt/DRPPM-Jaccard-Pathway-Connectivity.git- Set your working directory in R to the cloned repository
- This can be done through the "More" settings in the bottom-right box in R Stuido
- You may also use the
setwd()function in R Console.
R- https://cran.r-project.org/src/base/R-4/R Studio- https://www.rstudio.com/products/rstudio/download/
| shiny_1.7.1 | shinythemes_1.2.0 | shinyjqui_0.4.1 | shinycssloaders_1.0.0 |
| DT_0.23 | pheatmap_1.0.12 | readr_2.1.2 | dplyr_1.0.9 |
| plotly_4.10.0 | clusterProfiler_4.0.5 | ggdendro_0.1.23 | factoextra_1.0.7 |
| reshape2_1.4.4 | stringr_1.4.0 | viridis_0.6.2 | RColorBrewer_1.1-3 |
-
Comprehensive Gene Set File (Provided):
- This is a provided file Comprehensive_GeneSet.RData
- This is for use in the back end and provides the genes for the gene sets that are input.
- The gene set names should match the ones provdide when running the DRPPM-PATH-SURVIOER-Pipeline
- If you ran the pipeline with a user provided gene set the genes for those gene sets will unlikely be found to compare distance between gene sets.
-
User Provided List of Gene Sets (.txt/.tsv):
- The only requirements for the file is that it it tab delimited and the first column is the gene set names.
- The app will only use the first column, and ignore other columns
- This can take the ranked Coxh file that is output from the DRPPM-PATH-SURVIOER-Pipeline
- The user can subset this file for the top number of gene sets in the app
- Example Input files are provided here, these are files that were ouput from the example run of the DRPPM-PATH-SURVIOER-Pipeline with the 50 MSigDB Hallmark Gene sets, with and without the use of the "Responder" covariate.
- The only requirements for the file is that it it tab delimited and the first column is the gene set names.
-
Gene Annotation File (Optional):
- A tab delimited file with gene symbols as the first column followed by annotation columns
- It is recommended to use the output from the raw gene expression run of the DRPPM-PATH-SURVEIOR pipeline
- Though any file where the first column is gene symbols will do
- An example file from a raw gene expression run of the DRPPM-PATH-SURVEIOR pipeline](https://github.com/shawlab-moffitt/DRPPM-PATH-SURVEIOR-Pipeline) with the PAN ICI iAtlas Skin Cancer data to use for input can be found here: Pan_ICI_iAtlas_Skin_OS_Genes_coxh_ranked_ForAnnotationInput.txt
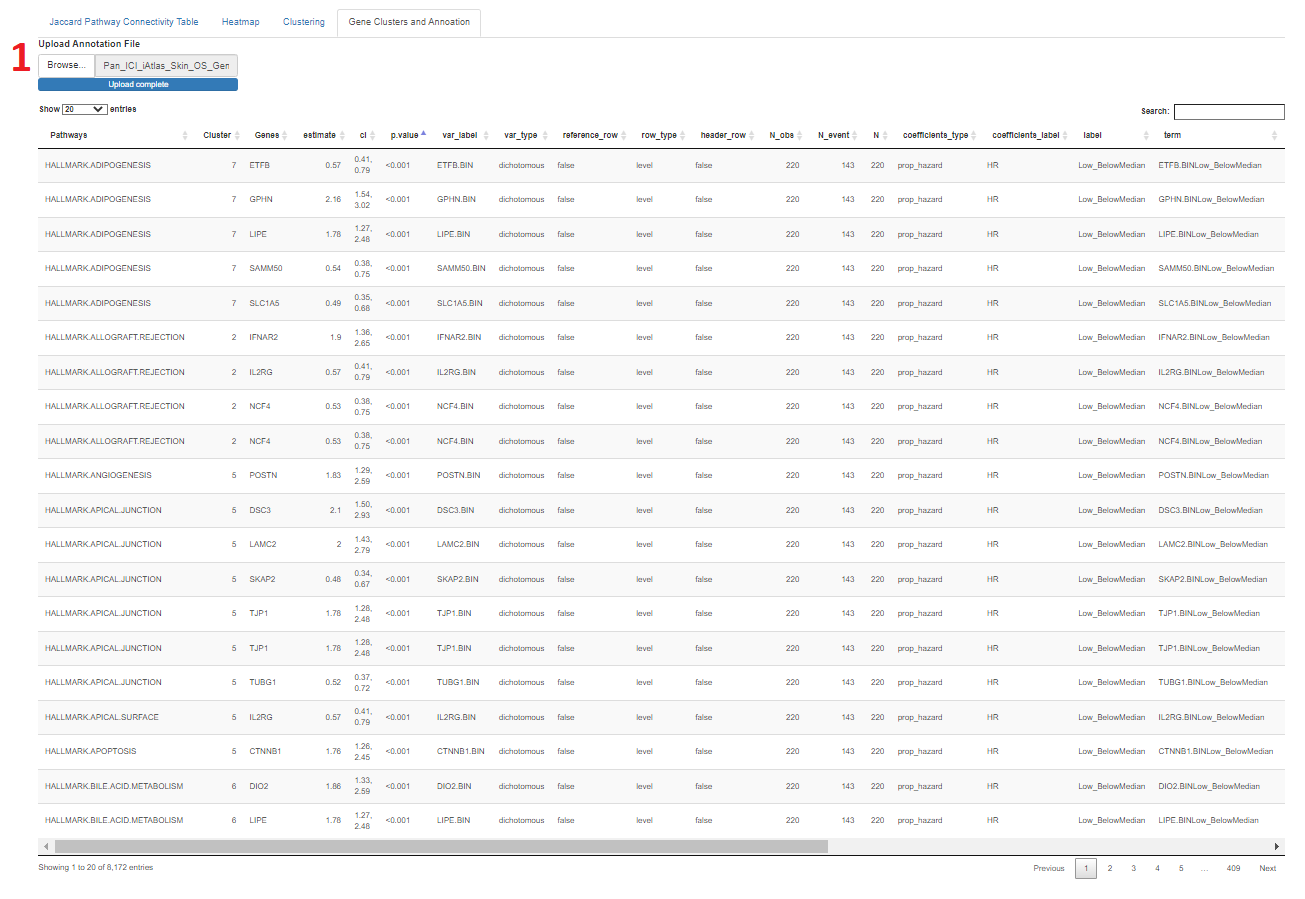
- There is a table that can be used for annotation of genes by the user in the "Gene Clusters and Annotation" tab
- This starts as a three column tables of gene set names and clusters repeating for each gene within the gene set
- The annotation file uploaded will merge the two tables by gene symbol
- It is important to ensure that the comprehensive gene set file that is provided is in the proper location for the app to locate it when running.
- If the Installation Section is followed properly there should be no issue.
- To run the app:
- The user can select the "Run App" button at the top write of the script in R Studio
- Or the user can user the runApp() function in R Console
- When the app is running the user can select to input a file in the user interface and proceed with analysis
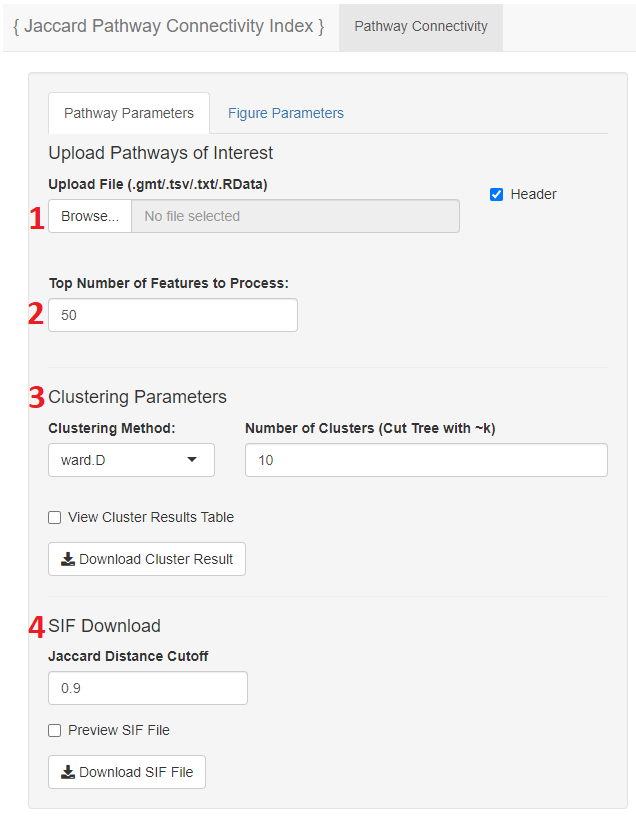
- The user may upload their pathways of interest here
- Please select if the file has a header or not
- Input file described here
- The user can select the top number of gene sets to view from the input file
- This takes the top number of rows from the file to perform the Jaccard Connectivity on
- While the Jaccard calculation should not take long, the larger the subset the more time the Jaccard Connectivity will take to process
- The user has the ability to choose which clustering method they want to use from the hclust() function, as well as the number of clusters they want to form with their data
- The cluster table can be viewed in the app, as well as downloaded
- A distance cutoff can be used input to generate a SIF file
- All gene set pairs below the designated cutoff will be included in the file
- This file can be previewed in the app as well as downloaded
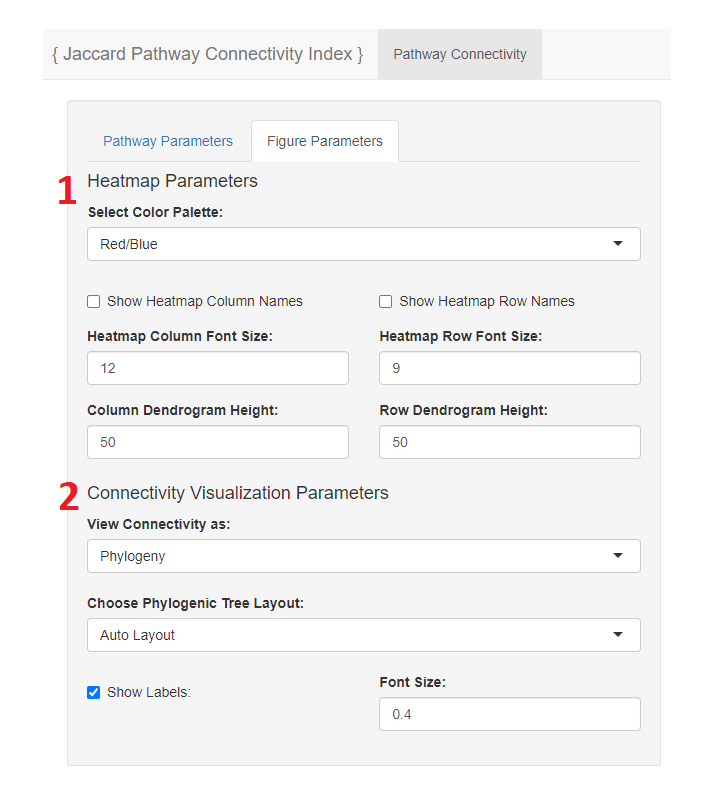
- Figure parameter for theheatmap may be adjusted, such as color palette, column and row names, and dendrogram height.
- The connectivity visualization can be customized to be viewed as a rectangular or circular denrogram or a phylogeny figure.
- If phylogeny is chosen a veriety of options to view the phylogeny figure as is provided.
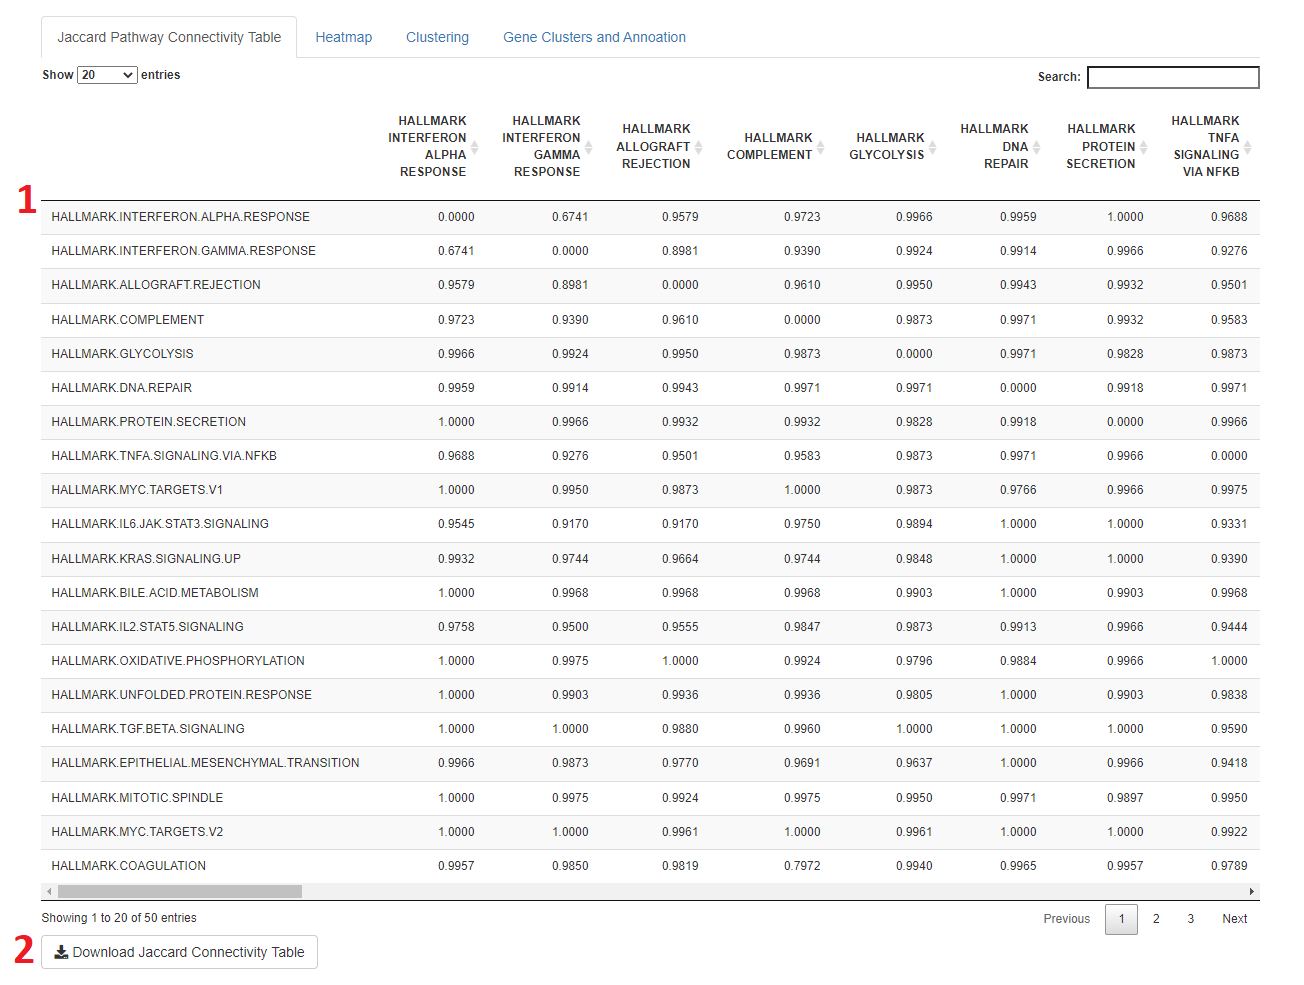
- When a file is uploaded to the app, after a few moments a Jaccard Connectivity able will appear showing the jaccard distance, 0-1, (similarity) between gene sets
- The smaller the number, the more similar the gene set
- The table can be downloaded for further use
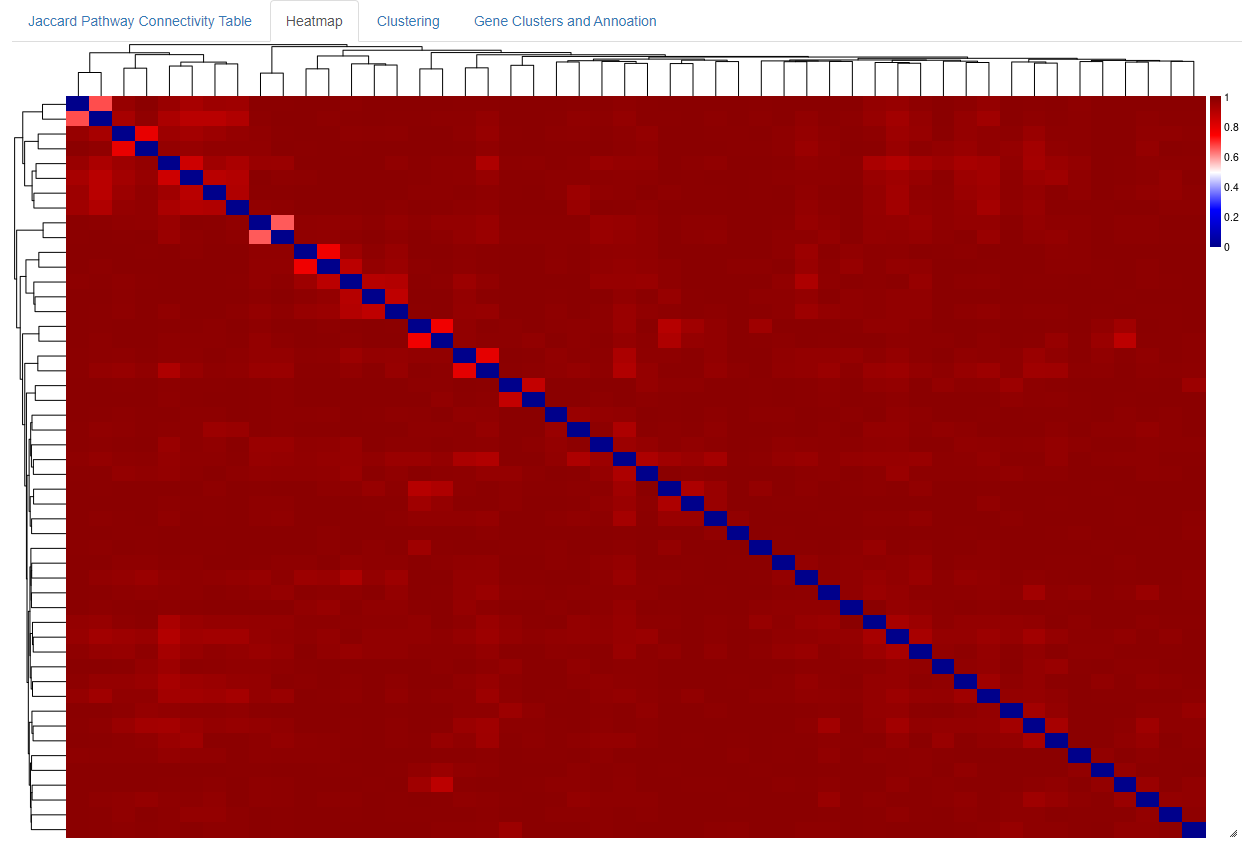
- The heatmap give a global picture of similarit between gene sets
- Clustering can be shown as a phylogenetic object, with or without names displyed. The names can be displayed also by hovering the points
- The visualization is a plotly object, so the user may zoom in to interact with the plot
- A dendrogram is another form of visualization available to see the clustering. This is also made with plotly, so the user may zoom in to examine the branches
- The clusters can also be viewed as a circular dendrogram. This is not a plotly object and can not be interacted with.
- A data frame is displayed on the last tab starting with the gene set, cluster, and gene for each row. This allows users to see what genes are in the gene sets and cluster
- A table provided by the user can be uploaded to annotate the genes. The uploaded table must list the gene symbol in the firsst column, the corresponding column can be any annotation the user chooses.
- It is recommended to use the input from the DRPPM-PATH-SURVEIOR Pipeline raw gene expresison ranking output.
Please email Alyssa Obermayer at [email protected] if you have any further comments or questions.
