R package for generating indicators from OBIS
Animated map of OBIS data limited to 1M randomly selected records per decade:
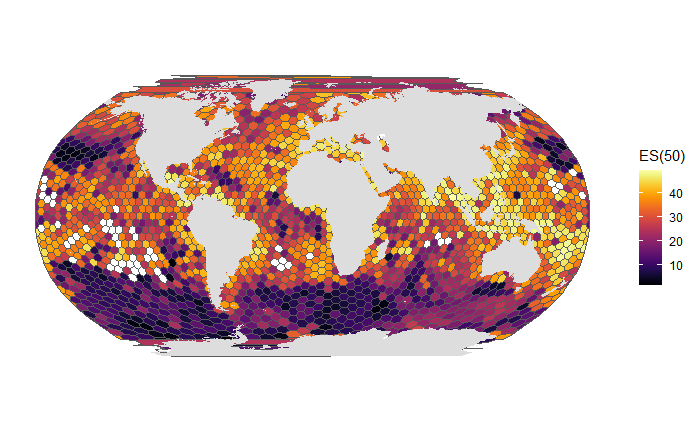
All data from OBIS in one map:
Basic installation is simple:
remotes::install_github("marinebon/obisindicators")But you will also need to install dependencies. You will need to install RTools and devtools to do this. Once those are installed run the following to complete installation of this package and its dependencies:
devtools::install_local()
Note that you will need to install R and the devtools package before being able to install this R package. As of 2022 October, these are the commands that were needed to install all required dependencies on a fresh ubuntu 22 installation:
# dependencies that R can't install for devtools
sudo apt-get install r-base libfontconfig1-dev libcurl4-openssl-dev libharfbuzz-dev libfribidi-dev libxml2-dev libfreetype6-dev libpng-dev libtiff5-dev libjpeg-dev
# dependencies that R can't install for obisindicator's dependencies
sudo apt-get install libgsl-dev libgdal-devinstall.packages("devtools")
devtools::install_local()library(obisindicators)devtools::install_local()
testthat::test_local()When editing locally, you will need to reload the obisindicators from your local copy of the files. To do this use devtools::load_all(). Additionally, you will need to run document() to update things from roxygen docstrings. All of this is summarized in the cheatsheet in RStudio under Help > Cheat Sheets > Package Dev w/ Devtools. You must use the workflow outlined in that pdf or you are gonna have a bad time.
| project | description |
|---|---|
| global-obis-es50 | Global biodiversity assessment. |
| california-coast-ecostress-biodiversity/ | Biodiversity assessment of the CA coast as relevant to NASA EcoSTRESS data. |
| OHW22 Galapagos analysis | Biodiversity assessment in the Galapagos with and without newly collected data. |
| es50 on a globe! | outputs from this library wrapped on an interactive globe in your browser |
- create new vignettes via
usethis::use_vignette("new_vignette_name") - to pre-build a vignette
- set chunk's
evalis false - then put markdown into the vignette to display the output image (or other html)
- assets go in
vignettesor inman/figures[ref)
- set chunk's
#Don Waller conversation 1/12/23
Don talked with Kyle Copas at COP15. He has been aware of GBIF and been involved with iDIV. Happy to get involved again.
His predecessor surveyed 1000 forest and pairaie sites and surveryed plant commnunities. Don Waller resurveyed 400 of these sites multiple times. May do it again
Hundreds of species across hundreds of sites across 50 years. Also lots of plant trait data (up to 30ish traists) published recently as a data base Also constructed phylogenetic tree for all the plant species in Wisconsisn (! sames as NE America)
Excited to see how databases like GBIF are being tied to policies and initiatives. He wrote a chapter on monitoring. He has been peripherally involved with NEON. He is a big believer in on-the-ground data, which NEON is not as much. He is also focused in the bulk of forest diversity, which occurrs in the understory. This can't be quantified by satellite. Really into plant population work.
There are several teams churning out papers based on sPlot, overseen by iDIV. Chris Verhayen, Hilge...someone. sPLOT will take just about any vegetation data. Forestry plot is much more discerning.
He wants to know, how do vegetation and plant functional trait data fit into GBIF?
We are working on trying to get NEON's vegetation plot data shared. Don wasn't aware that existed. Shared NEON bird point count data.
ESA Public Affairs - Don is on it. There is some effort he will tell us about in email. NSCEN: the evolutionary version of NCEAS, in Durham. Headed by Fred Allendorf.
-
Don didn't know there are genetic data in GBIF
-
He recommends we get in touch with Bob Peat's vegetation in NC. Abby says she has spoken with Bob, needs to revive relationship.
Wisconsin is included in Forest Replot. SO if We got Forest Replot, we would get Wisoncins, not sure about Peat data. But Forest Replot can be persnickety about sharing data. Wisconsin data can be shared directly, probably a best starting point. Then we could use that to convince other forest replot folks to contribute.
Wisonsin data is in spreadsheets in two forms.
- Long form (Abby says this is probably more helpful)
- Community matrix
We would probably have event table about quadrats, can use parent/child events Frequency as separate table would also work. They have soil chemistry and landscape (1,3,5 km zones around each site) data. We want all data (including historic)
- There will be taxonomic disagreement over time in this data set (he calls it data synchronization)
- We have filtered data that syncs up with modern taxa names
- Extracting original name might have to be a secondary goal to update via a machine mapping. Don will send links to UW library database and Oppenhauer database.
We could do a writeup highlighting how the data were passed from researcher to researcher.
Steve will start GBIF ticket
To do list for obisindicators fork:
Render better lores maps for vignette Remove hi-res maps Add ES50 vignette Add vignette about how you got to the place you did after trying arrow and dask, etc.