μViewer
from cloudvolume import CloudVolume, view, hyperview

channel_vol = CloudVolume(...)
seg_vol = CloudVolume(...)
img = channel_vol[...]
seg = seg_vol[...]

img.viewer() # works on VolumeCutouts
seg.viewer() # segmentation type derived from info file
view(img) # alternative for arbitrary numpy arrays
view(seg, segmentation=True)
hyperview(img, seg) # img and seg shape must match

>>> Viewer server listening to http://localhost:8080
Point your browser at https://localhost:8080 after starting the viewer as depicted above.
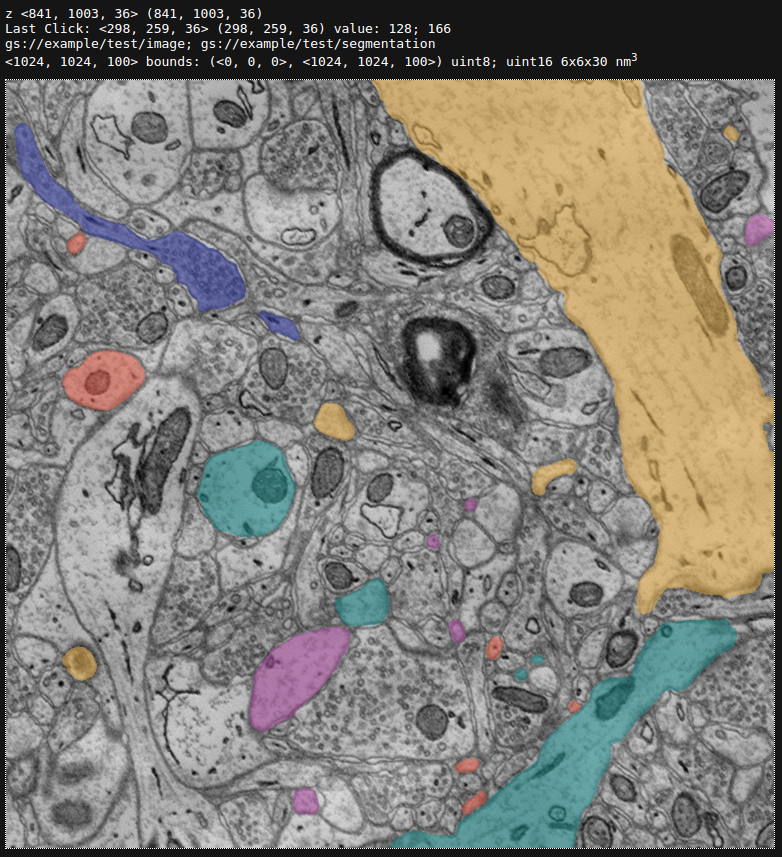
CloudVolume includes a built-in dependency free viewer for 3D volumetric datasets smaller than about 2GB uncompressed. It can be useful if you want to visualize arbitrary numpy arrays, a cutout without the surrounding area, a cutout from a distributed job, or if you are unwilling or unable to set up your files to work with neuroglancer. This capability supplements the save_images feature that can save a numpy array into an image stack.
- Image and Segmentation
- X, Y, Z axial reslicing
- bool, uint8, uint16, uint32, float32, and float64 data types (NaN, -Inf display as black, +Inf white)
- Limited support for 64-bit integer data (converted to float64)
- Single image viewer and "hyperview" which combines an EM image and a segmentation overlay.
- Hover highlight of segmentation and dynamic recoloring
- Neuroglancer keyboard controls
- Mapping of image pixels to neuroglancer coordinates
- Up to 2GB individual volumes (two volumes can exceed this limit in aggregate).
| Control | Command |
|---|---|
| Change Slice | Scroll, comma, period, W, S |
| Change Axis | Space, A, D |
| Freeze Voxel Information | Left Click |
| Recolor Segmentation | L |
| Clear Selected Segmentation | X |
| Change Segmentation Opacity | +, - |


The microviewer server uses the standard Python http.server (formerly the SimpleHTTPServer) and thus requires no dependencies.
The client is in Javascript and is based on the open source custom 2D canvas renderer written for eyewire.org called DataCube. DataCube's represents volumetric images as 1D typed arrays that allows for the computation of 2D axial slices as both ordinary images and as canvas imagedata. The small and self-contained footprint makes it simple to include in many different contexts. The simplicity of the representation makes it easy to apply transforms to the data, though care is required to make such operations fast enough for real time rendering.
Consider using DataCube in your own project: https://github.com/seung-lab/data-cube-x
pip install cloud-volume[mesh_viewer]from cloudvolume import CloudVolume
cv = CloudVolume(...)
mesh = cv.mesh.get(1)
mesh.viewer()CloudVolume also supports a limited OpenGL based viewer for meshes based on vtk. vtk is a large dependency, so we made it optional. Currently we are only plotting the point cloud of the vertices, but over time the viewer will be improved. The plot is interactive; clicking and holding down the left mouse button will rotate the object.

pip install cloud-volume[skeleton_viewer]from cloudvolume import CloudVolume
cv = CloudVolume(...)
skel = cv.skeleton.get(1)
skel.viewer()CloudVolume also supports a limited matplotlib based viewer for skeletons. matplotlib can be more difficult to use on non-linux systems, so we made it optional. The GUI is interactive; you can rotate the skeleton to get a better look at it. The vertices are color coded by the size of the radius from each vertex to the nearest surface (which can include internal holes).

--
Made with <3.