Welcome to my flight delay prediction repository
- Air Carrier: The cause of the cancellation or delay was due to circumstances within the airline's control (e.g. maintenance or crew problems, aircraft cleaning, baggage loading, fueling, etc.).
- Extreme Weather: Significant meteorological conditions (actual or forecasted) that, in the judgment of the carrier, delays or prevents the operation of a flight such as tornado, blizzard or hurricane.
- National Aviation System (NAS): Delays and cancellations attributable to the national aviation system that refer to a broad set of conditions, such as non-extreme weather conditions, airport operations, heavy traffic volume, and air traffic control.
- Late-arriving aircraft: A previous flight with the same aircraft arrived late, causing the present flight to depart late.
- Security: Delays or cancellations caused by evacuation of a terminal or concourse, reboarding of aircraft because of security breach, inoperative screening equipment and/or long lines in excess of 29 minutes at screening areas.
In this repository, I evaluated these reasons and modeled the data using logistic regression and random forest model. Before doing that, let's go over few requirements for this study!
- Chrome Browser and Driver (needs to be the same version)
- Windows Subystem for Linux and run following commands on linux terminal
sudo apt-get install unzipsudo apt install csvkit
- NumPy ➡️
pip install numpy - Pandas ➡️
pip install pandas - JupyterLab ➡️
python -m pip install jupyter - Matplotlib ➡️
pip install matplotlib - Progressbar2 ➡️
pip install progressbar2 - Federal Holidays ➡️
pip install holidays - Selenium ➡️
pip install selenium - Seaborn ➡️
pip install seaborn - Plotly ➡️
pip install plotly - Sklearn ➡️
pip install sklearn
- Airline on-time performance dataset is available on The Bureau of Transportation Statistics’ website. In the process of data scraping, I used the selenium library in Python. This library works with a a Chrome driver that needs to be the same version as your Chrome browser. It downloads the monthly data to the ~/data/flight_data folder. From then on, a shell script concatenates these monthly flight data into a single csv file under the same folder.
date_start = '2018-01' #YYYY-MM format date_end = '2020-11' #YYYY-MM format path, parent_path = wrangling.acquire(date_start, date_end) # Web-scraping with selenium - Weather data was obtained from Iowa State University’s Environmental Mesonet Platform. This platform works like an API service which needs modification of a requested URL for each inquiry. The python script for weather data can be found on this GitHub repo.
weather.data(df, airport, icao, date_start, date_end) - Airport data was obtained from The Bureau of Transportation Statistics’ website manually. This dataset has a substantial amount of information such as airport names, location, time zone etc and it be found here.
- ICAO data was acquired from OpenFlight dataset. The reason why we need this data is because The Environmental Mesonet Platform of Iowa State University requires ICAO codes as station IDs whereas airport data from The Bureau of Transportation Statistics does not have. You can have look at it here.
The full exploratory data analysis can be looked at this jupyter notebook, however, I brought couple of important ones here.
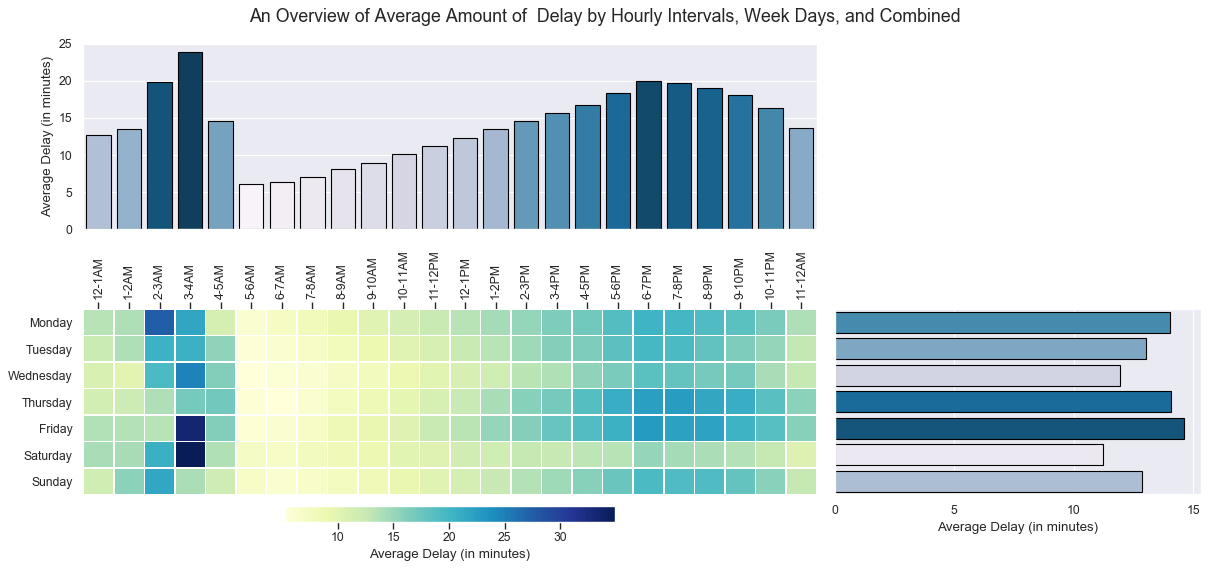
The figure above summarizes average amount of delay in minutes by daily, hourly, and combined time intervals. One can realize that the two histograms around the heat map represent average delay with respect to daily (on the right) and hourly (on the top) axes. It is clearly seen that 3:00AM-4:00AM time slot is the worst time to fly, especially on Friday and Saturday nights, due to long average delays (>30mins). On the other hand, it is best to schedule a flight in the early morning (5:00AM - 10:00AM), because the average delays are way below the yearly average (10 mins). Towards the evening, the delays are monotonously increasing and reaching its peak at 6:00PM-7:00PM. One can interpret this graph as the sum of two gaussian distributions centered at the two peak delay times mentioned above. The standard deviation during the night is much smaller than the evening. I believe this is related to the low density of flights during the night.
Day to day variation of the delays is much smaller (< 4mins) than the variation during the day. The best days to travel are Saturday and Wednesday that can be associated with weekend oriented travels where Friday evening and Monday morning are busier. Due to seat availability and cost, the increase in mobility is extending to Thursday and Tuesday. Long weekends may also have some effect in this increase.
From hourly interval perspective,
- delays are higher between 2:00 AM - 4:00 AM,
- early morning flights have less probability to be delayed (5:00 AM - 10:00 AM),
- probability of delay constantly increases between 5:00 AM and 7:00 PM,
- its relative peak is at between 6:00 PM - 7:00 PM.
From daily interval perspective,
- average amount of delay per day are so close to each other,
- the minimum delay happens on Saturdays,
- Saturdays happen to have minimum delays in evening flights,
- Thursdays and Fridays seem to have higher chance of having delay.
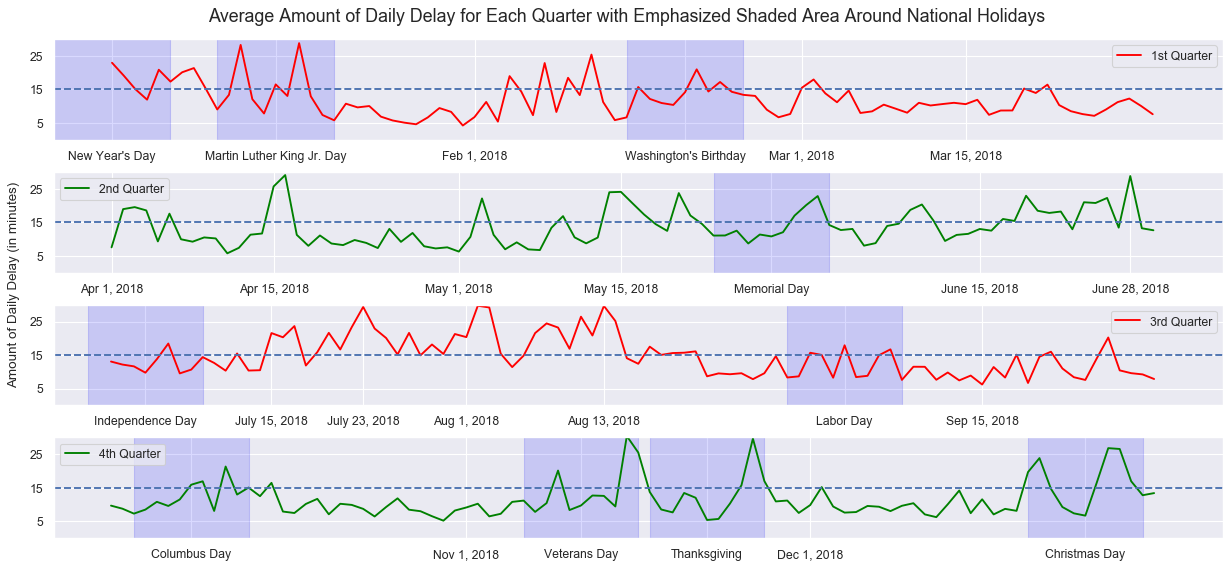
The graph above shows average amount of delay per day in four quarters of a year. Blue shaded area represents plus and minus five days from national holidays (in total 10 days). Federal Aviation Administration (FAA) considers any flight that is late more than 15 minutes as a delay. That's why I also emphasized 15 minutes with a dashed line in the plot. The increase in average delays before and after the national holidays can be associated with higher traffic density of the airports. This can be seen in the following figure.
In this figure, the maximum wind speeds for each direction oberved in top 12 US airports are shown as a black solid line. The colored dots represent the amount of weather caused delay for corresponding wind speed and direction measured. In this figure, green dominant areas show that airport operation continues well under corresponding weather. Therefore, airports like Chicago O'Hare, Hartsfield-Jackson Atlanta, Dallas Fort Worth and George Bush are operating well for most of the wind speeds. On the other hand, Los Angeles, San Francisco, Phoenix Sky Harbor and McCarran are affected by even relatively low speeds. This difference is related to the design of the airport including its position, direction and length of the airport runways, type of the winds, and technological advancement of the airport. For example, Los Angeles and San Francisco are placed near ocean, therefore the winds from ocean can cause more problem even at low speeds due to immediate weather change. On the other hand, Chicago O'Hare is a large airport with several runways and still expanding. Its history shows that runway lengths and directions are changed to operate at high speed winds from North.
Intead of focusing whole dataset, I prefer to only work on a subset of dataset which I call slicing our problem. Slicing can reduce the number of the features along with better prediction. I chose to slice our problem per origin airport and month of the year basis. After grouping data per origin airport and month of the year, there are few things need to be done on the data. I outlined those steps below:
- One Hot Encoding: Since I slice our problem per origin airport and month of the year, I do not need month column and origin airport column. I applied pandas get_dummies method on the remaining categorical variables.
- Data Splitting: The second step involves splitting the label encoded dataset into train and test datasets. In this project I split them equally with 75%-25% ratio. Also, I split them in such a manner that the fractions of both classes remain almost same in train and test datasets.
- Resampling: Since out data is imbalanced, where classes in the target variables is not distributed equally, I try random over sampling techniques to overcome this issue. One can also use random under sampling technique or other techniques such as SMOTE or SMOTENN in imbalanced-learn library, I decided to keep computational expenses low at this stage.
- Hyperparameter Tuning with Cross Validation: Sometimes, rather than resampling, weighting the training samples works best using grid search algorithm. In the weighting technique, more weights are given to minority class examples. In our preliminary results, I see that random over resampling and hyperparameter tuning work best for logistic regression, so I stick with this method among all models.
- Scaling: Instead of using standard scaler from sklearn framework, I used maximum absolute scaler to keep our dummy variables same.
| Performance Metrics | Baseline | Logistic Regression | Random Forest |
|---|---|---|---|
| Precision (Delayed Class) | 0.80 | 0.70 | 0.75 |
| Recall | 0.50 | 0.74 | 0.77 |
| F1-Score | 0.61 | 0.72 | 0.76 |
| AUC | 0.83 | 0.87 | 0.90 |
| AP | 0.76 | 0.81 | 0.86 |
| Training Accuracy | 0.79 | 0.80 | 0.87 |
| Testing Accuracy | 0.79 | 0.80 | 0.84 |


