Pre-requisites:
- git
- ansible v 2.9
- python3
- oc you can download from linux=https://downloads-openshift-console.apps.ocuat.corp.domain.ca/amd64/linux/oc.tar windows=https://downloads-openshift-console.apps.ocuat.corp.domain.ca/amd64/windows/oc.zip mac=https://downloads-openshift-console.apps.ocuat.corp.domain.ca/amd64/mac/oc.zip > unzip oc.zip > tar xvf oc.tar > sudo mv oc /usr/bin
Instructions: (1) login to your ocp with > oc login -u user -p pass --insecure-skip-tls-verify=false --server=https://api.ocuat.corp.domain.ca:6443 # This will go away in Ansible Tower
(2) > git clone -b ocp-resource-usage-advisory --single-branch ssh:https://YOUR_ID@codereview/infrastructure-dora-metrics
    > cd infrastructure-dora-metrics/dora
        # This will go away in Ansible Tower

(3) run (copy and paste to your linux cli):

  (3a) > ns='["ns1","ns2","nsx"]'
       > ansible-playbook main.yml -e "ocptoken=`oc whoami -t` svr='ocuat' startdate='2021-06-29 00:00' enddate='2021-07-06 06:00' ns=`echo $ns` id='xxxxxxxx'" --ask-vault-pass -v
           # please ask the author for the vault password
           # --ask-vault-pass will go away in Ansible Tower

    -OR-

  (3b) > ansible-playbook main.yml --ask-vault-pass -v
           # this will use the defaults variables
           # please ask the author for the vault password
           # --ask-vault-pass will go away in Ansible Tower
    -OR-

  (3c) > echo xxxxx > ~/.vault_pass
           # please ask the author for the vault password
       > export ANSIBLE_VAULT_PASSWORD_FILE=~/.vault_pass
           # you may add this in your .bashrc
       > ansible-playbook main.yml -v
Ansible parameters:
ns = namspace in list # this got default variable
url = confluence company url # this got default variable
id = confluence page id to modify # this got default variable
ctoken = token of the service id that can modify the confluence page # this got default variable
ocptoken = ocp token # this will got from your linux cli so be sure to ocp login first
svr = server name of the ocp # this got default variable
startdate = start date of the metrics (if you specifiy startdate, it should be startdate='2021-06-01 12:00')
enddate = end date of the metrics (if you specifiy enddate, it should be enddate='2021-06-08 12:00')
# note: there are only 7 days of data for now, otherwise you will get no data available
# putting blank on the startdate='' and enddate='' will automatically calculate 7 days on the current date (and time minus 3 hours)
# also the time should be 3 hours deducted from the current time, if it 15:00, it should be 12:00
Metric Used Explanation:
- avg(pod:container_cpu_usage:sum{namespace='namespace1',pod=~'deploymentconfig.*'}) # line 227 after the remark '# metric used'.
- the main metric "pod:container_cpu_usage:sum" is the same as the cpu usage when you click from the Openshift 4.
- the default per pod metric is "pod:container_cpu_usage:sum{pod='httpd-1-qxrlk',namespace='test-sandbox'}" for example, to get the average you need to put avg() (see above main metric) and do wildcard (see above main metric) so that you deal with per deploymentconfig and not per pod.
- it average ON ALL PODS used including [pod]-build and [pod]-deploy because it consume cpu as well. so don't do manual calculation only on one pod or one deploymentconfig (multiple pods if there are two or more pods), add the [pod]-build and [pod]-deploy.
Note:
- If you put two namespace and one have no data or half of the timeframe, the rest will fail with no data available or one will have error on graph as "could not be converted to date".
- The programs are ansible module python (get_metrics and push_metrics), see each modules to see more help.
Bugs:
- The charts of confluence cannot be customize it need Confluence Wiki Software license.
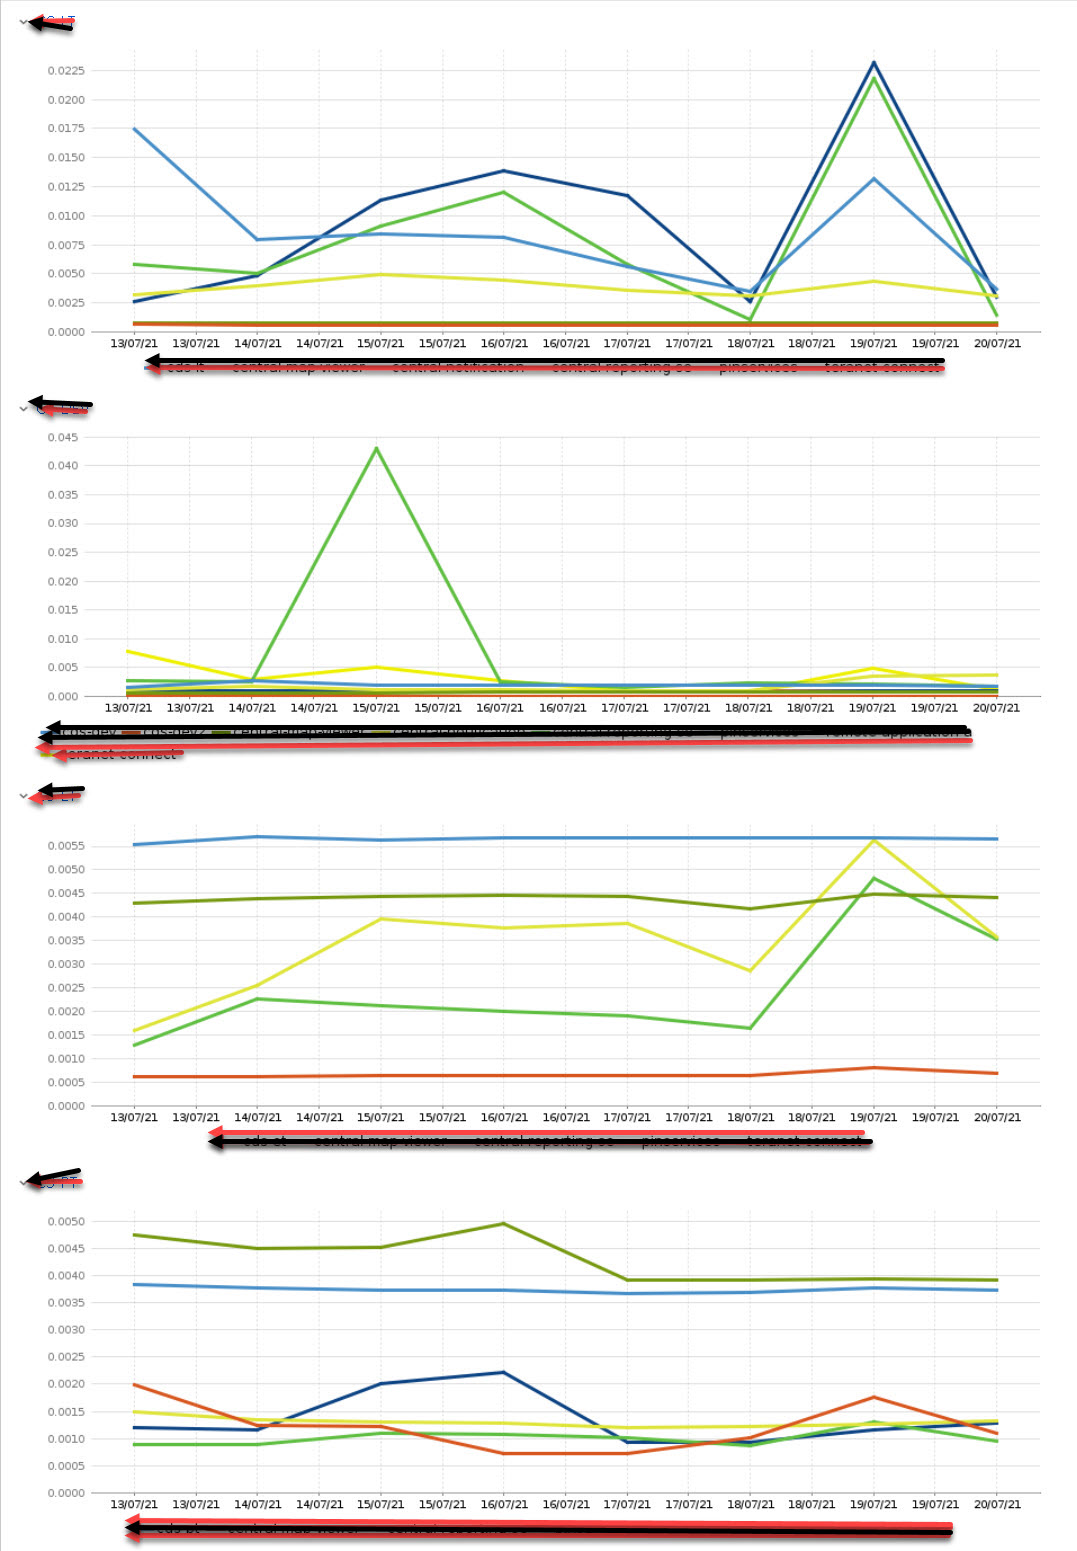
Sample Confluence Graph Output:
