The Packet Analyzer App is a PyQt-based graphical user interface (GUI) application that utilizes the Scapy library for packet sniffing and analysis. The app provides real-time visualization of packet data, including line plots, pie charts, and bar charts, allowing users to monitor network activity.
- Real-Time Analysis: The app captures and analyzes packets in real-time, providing dynamic visualizations.
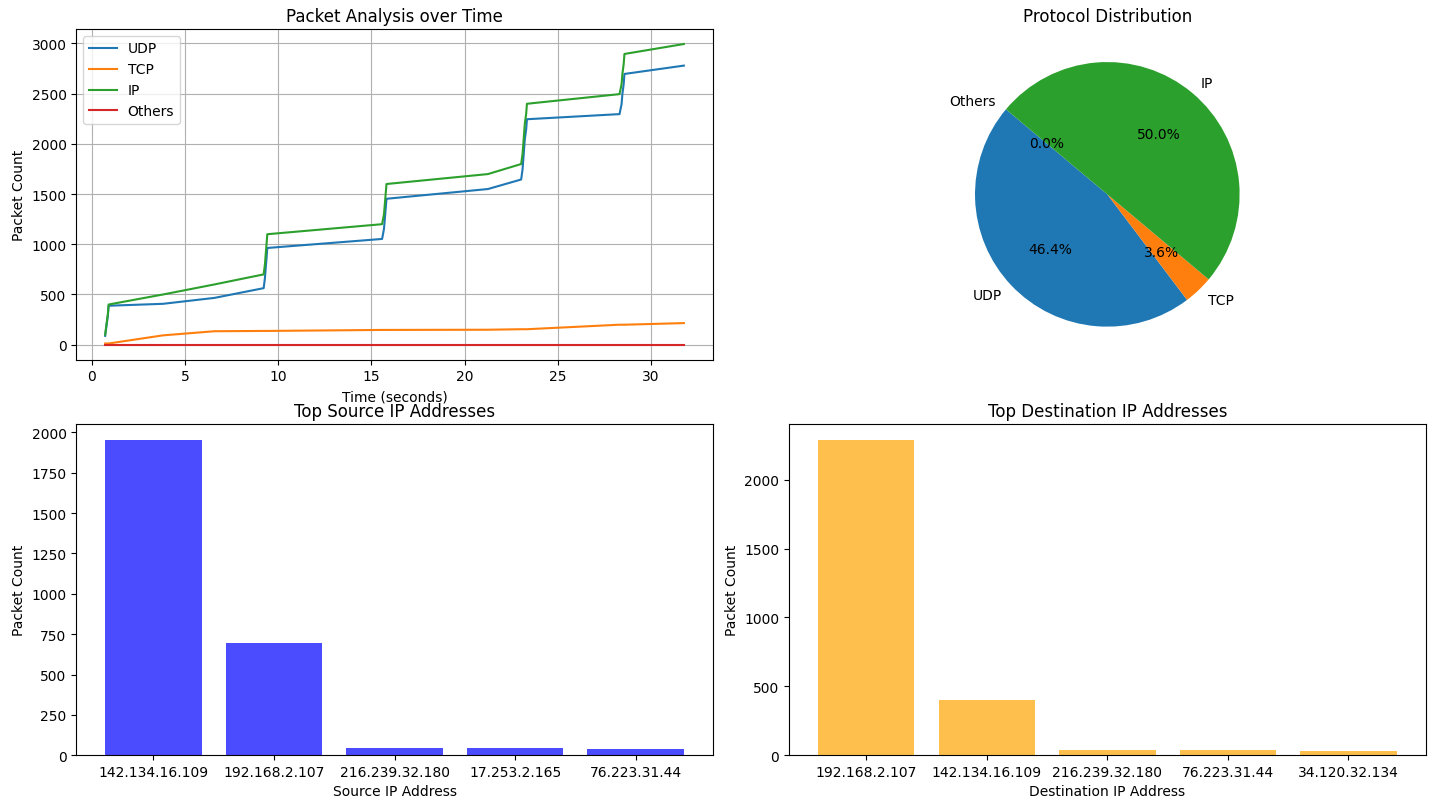
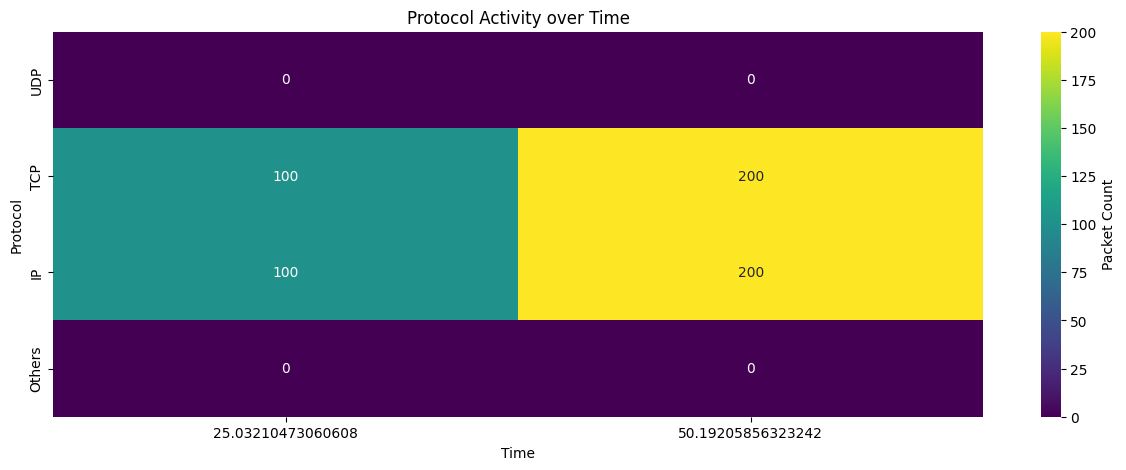
- Multiple Graphs: Displays line plots for UDP, TCP, IP, and other protocols, along with pie charts and bar charts for additional insights.
- Top Source and Destination IPs: Highlights the top source and destination IP addresses based on packet counts.
-
Ensure you have Python installed on your system.
-
Install required packages:
pip install PyQt5 scapy matplotlib seaborn
Running the app:
python main.py - Launch the app by running the script.
- Click the "Start Analysis" button to initiate packet analysis.
- Visualizations will be updated in real-time during the analysis.
- After completion, the final analysis results, including line plots, pie charts, and bar charts, will be displayed.
- Duration: Adjust the
duration_secondsvariable in the script to change the analysis duration. - Stylesheet: Modify the stylesheet in the
initUImethod to customize the appearance of the "Start Analysis" button.
- PyQt5: GUI framework for the application.
- Scapy: Packet manipulation library for packet sniffing.
- Matplotlib: Plotting library for creating visualizations.
- Seaborn: Statistical data visualization library for improved aesthetics.
- No known issues at the moment.
This Packet Analyzer App is licensed under the MIT License.
Special thanks to the developers of Scapy, PyQt, Matplotlib, and Seaborn for their valuable contributions.