This repository contains a bash script that will install and configure Telegraf, InfluxDB and Grafana from the official repos.
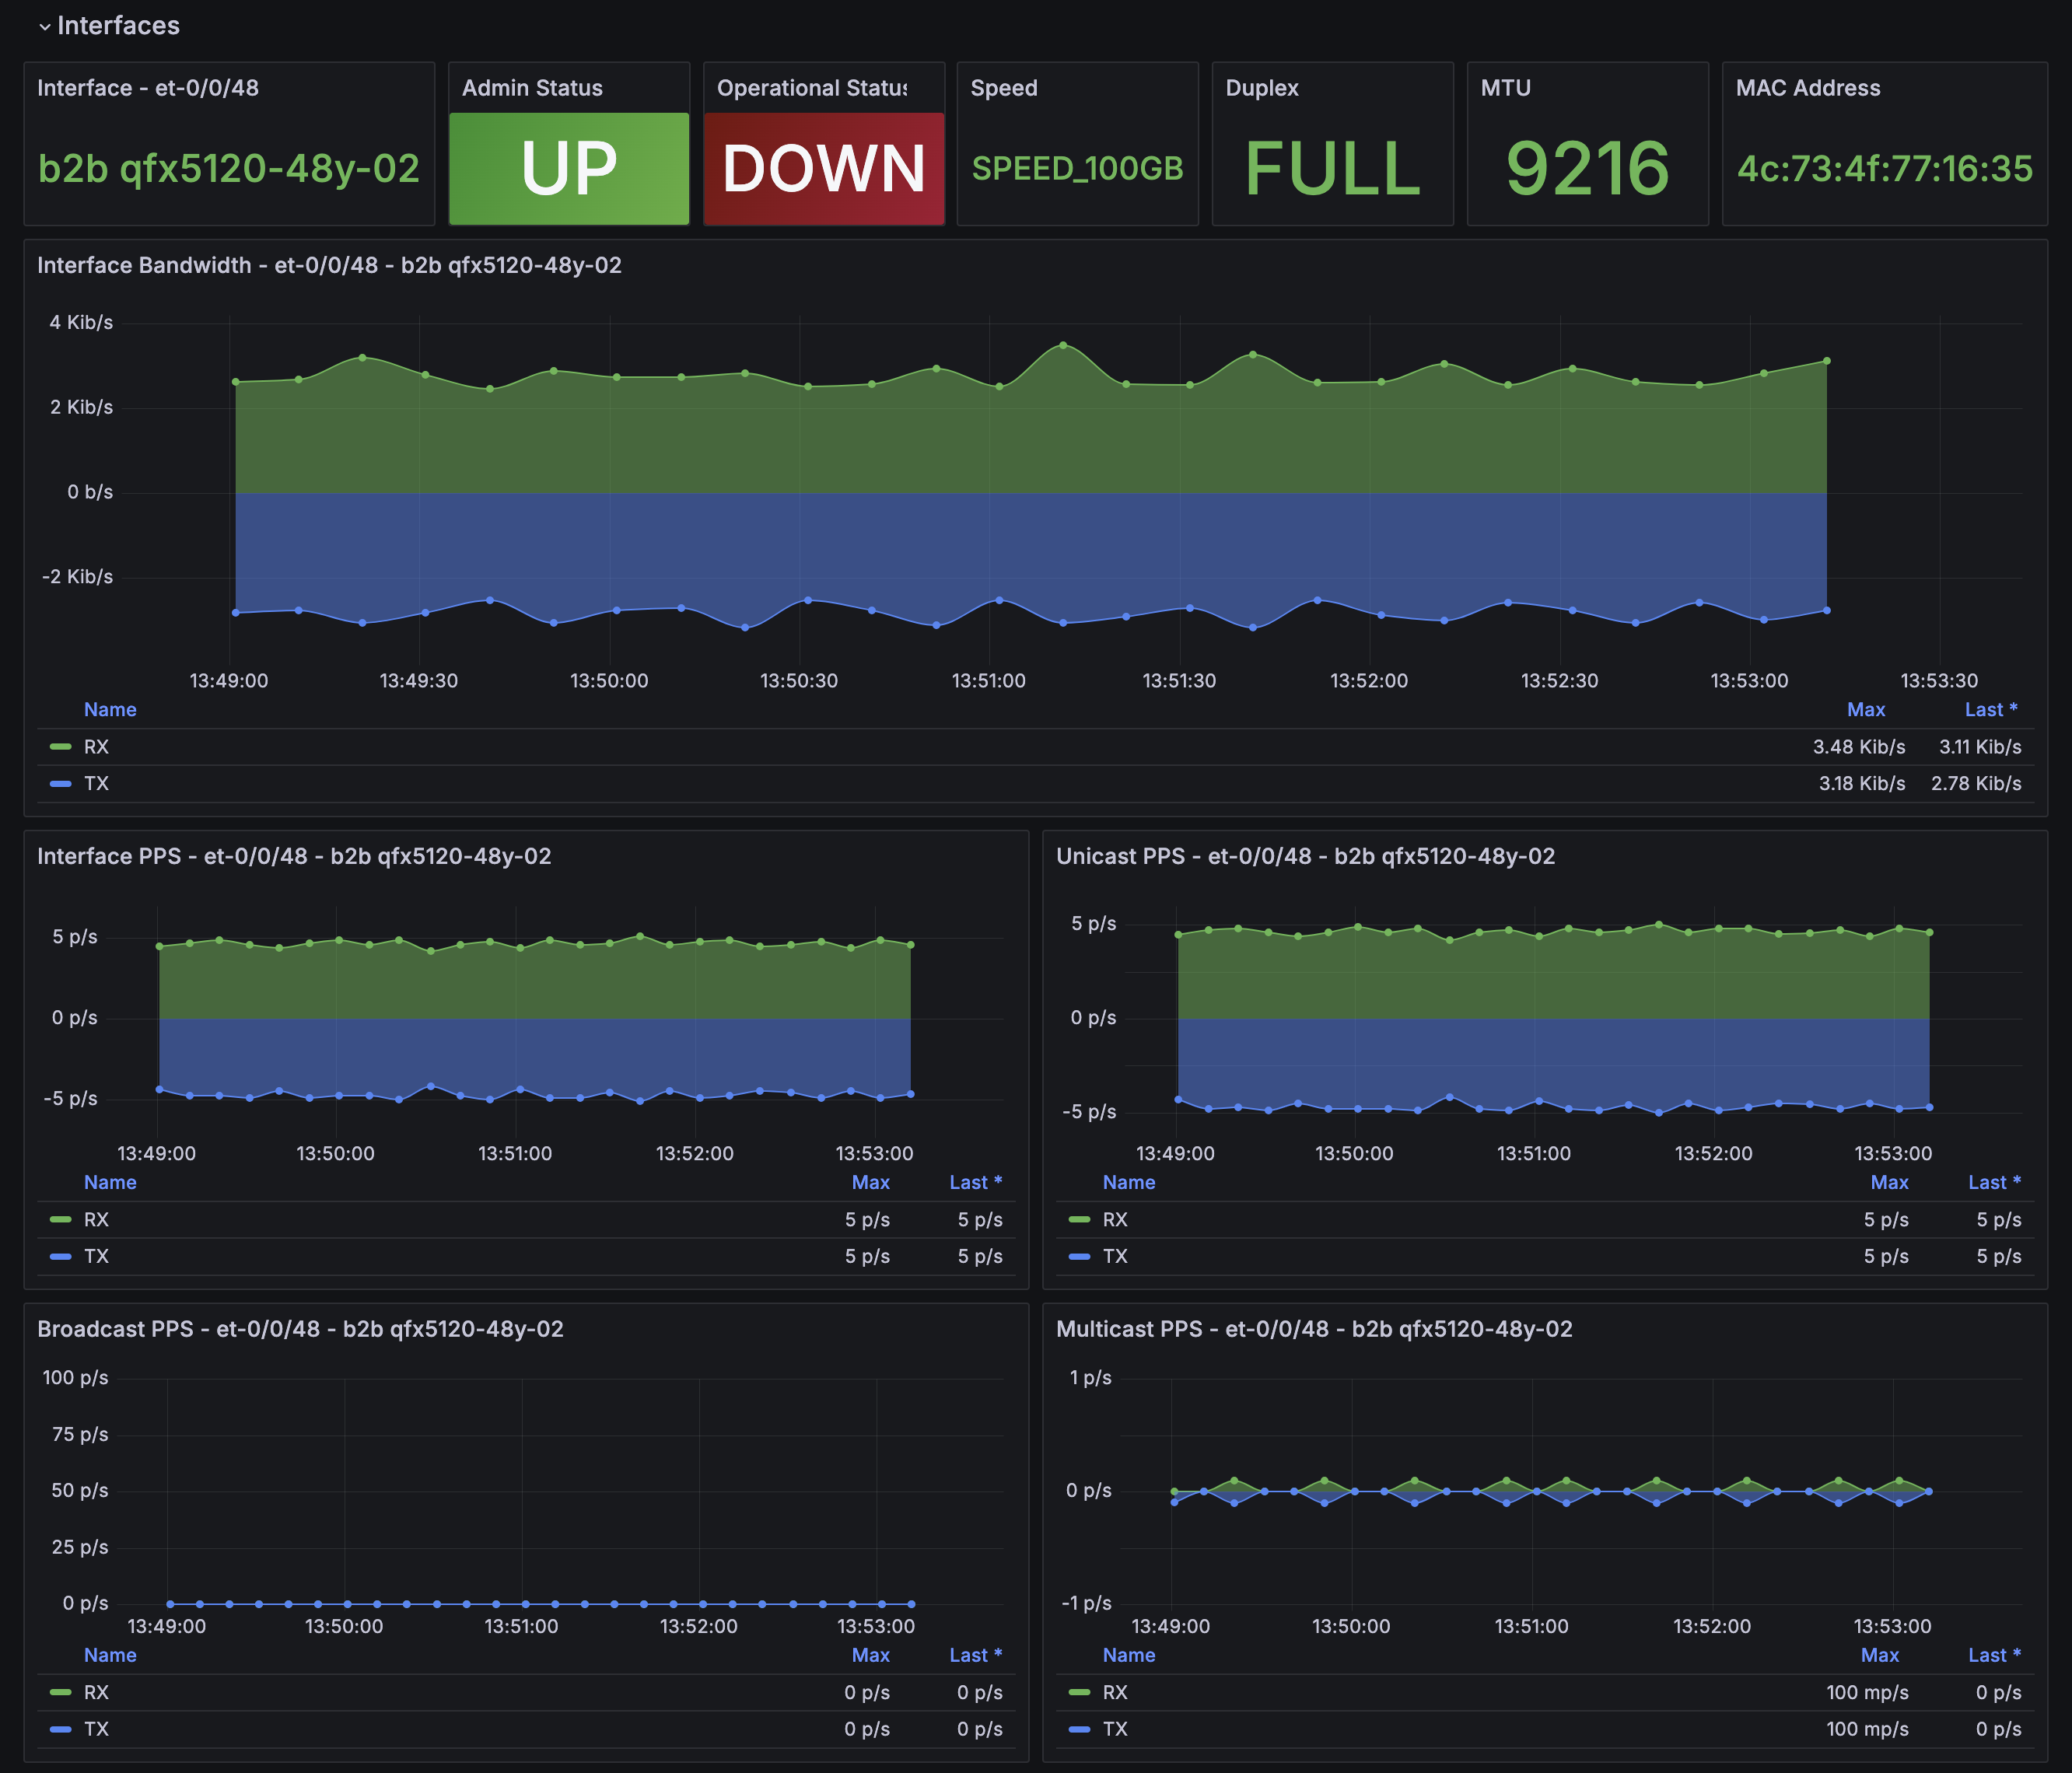
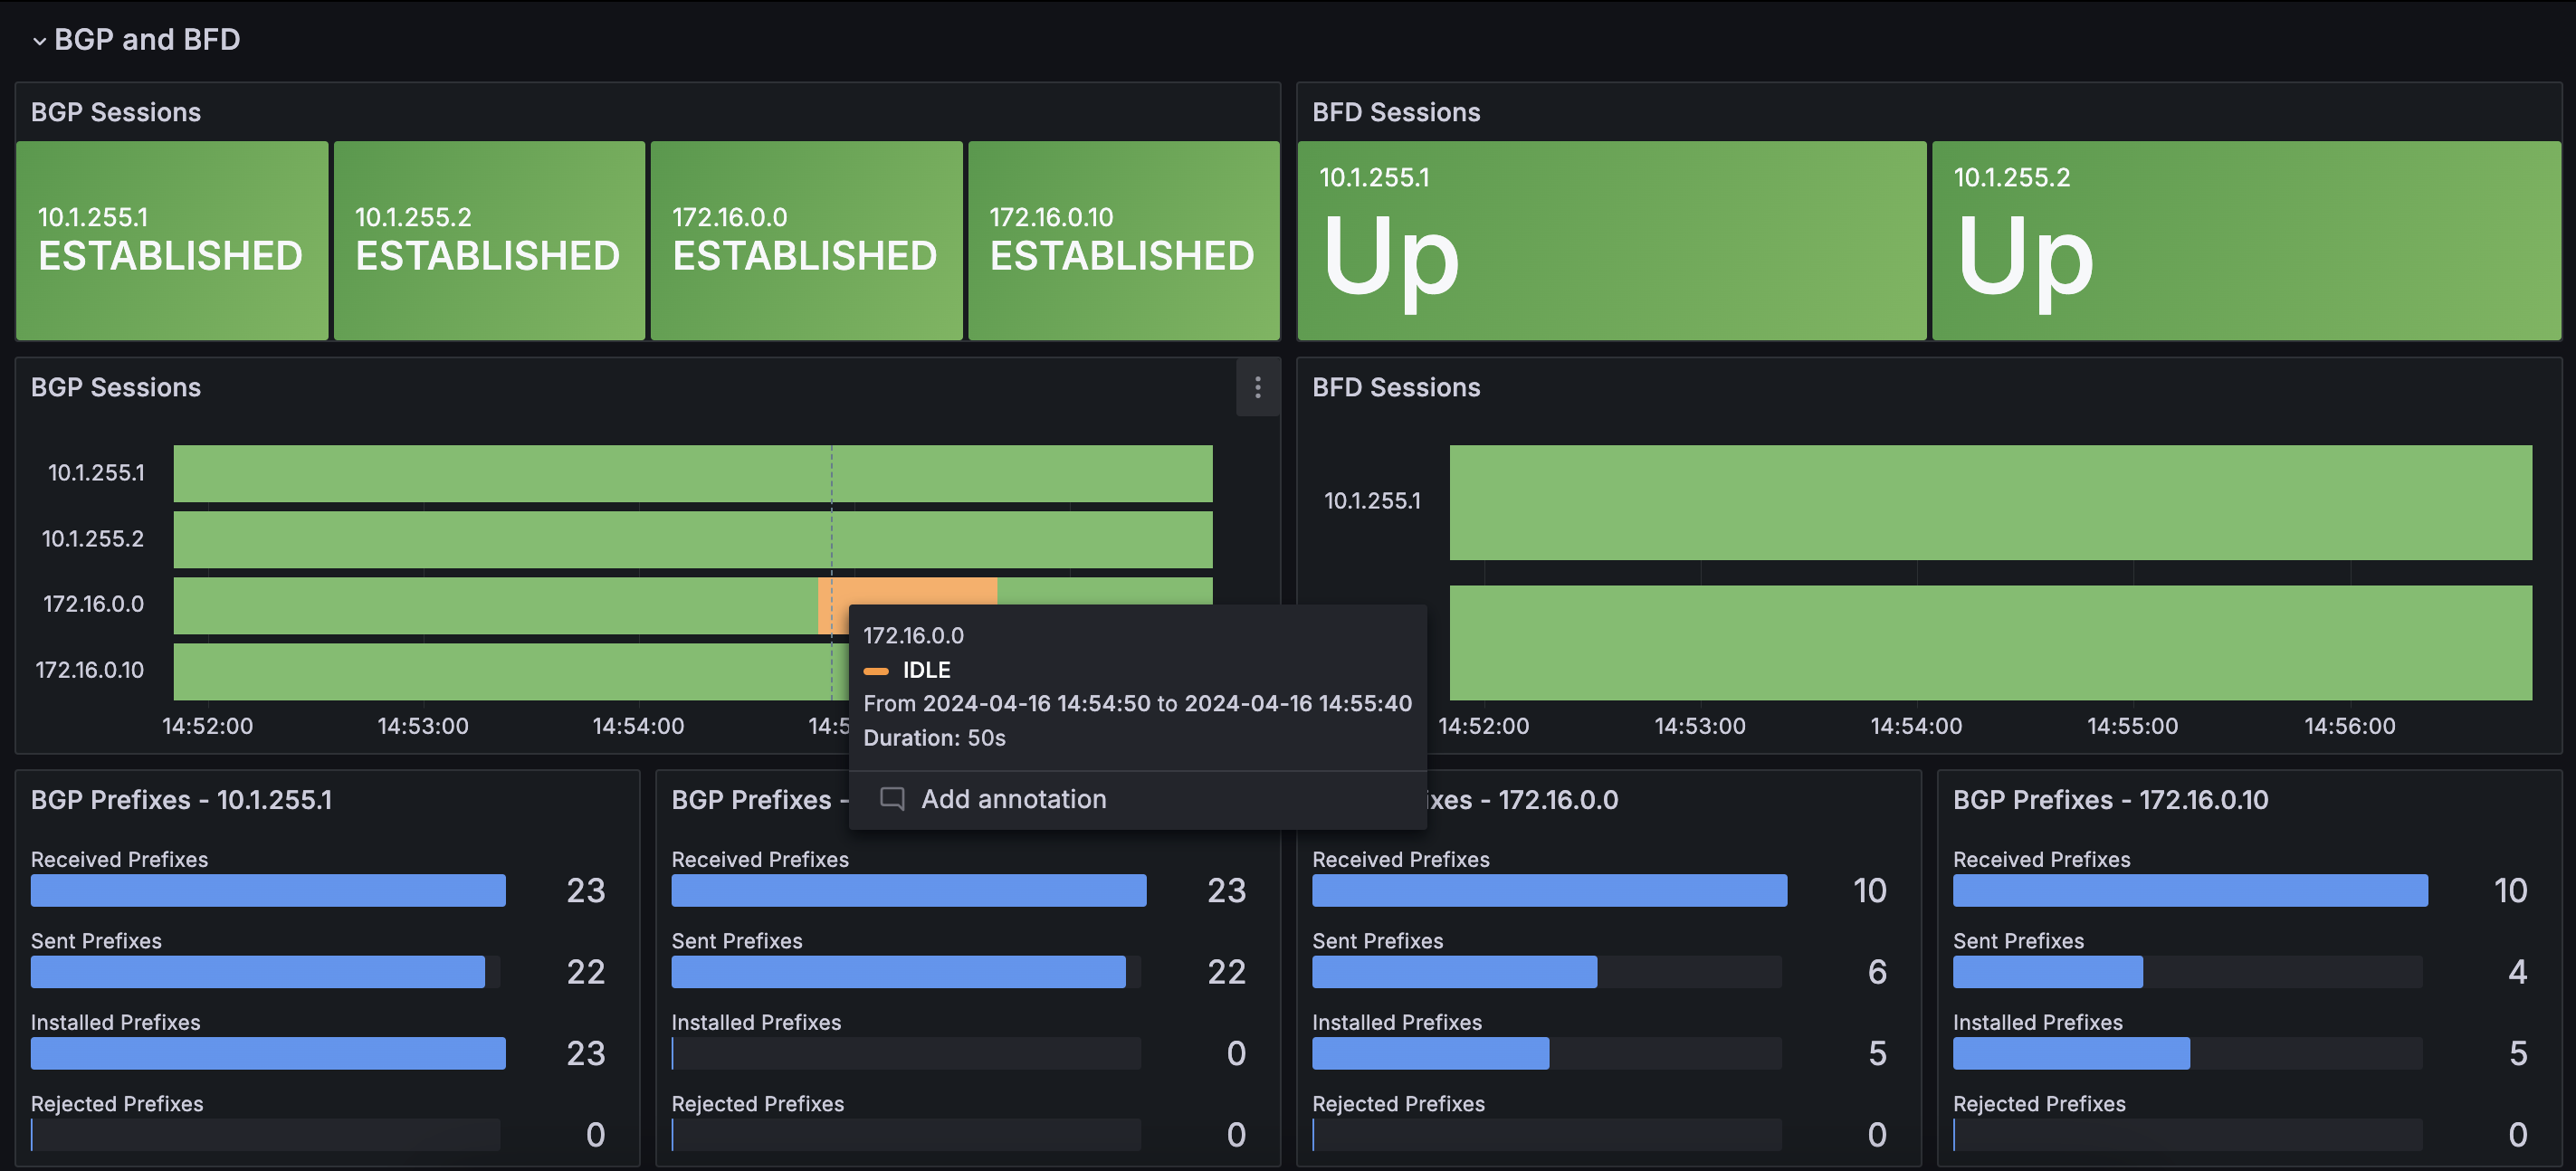
A pre-built Grafana dashboard is provided to monitor Streaming Telemetry from Juniper devices.
Components:
- Telegraf-latest
- InfluxDB 1.8x-latest
- Grafana Enterprise-latest
InfluxDB 1.8 is used because Grafana lacks support for the visual query builder in InfluxDB 2.x due to its use of the Flux query language.
Once InfluxDB 3.0 community edition is released, I'll update the installation script to use it as it employs standard SQL.
- Ubuntu Server 22.04.4 LTS
- Juniper devices capable of Streaming Telemetry using gNMI/gRPC/Openconfig
- Junos 21.4R3 or higher
git clone https://github.com/rogerwiklund/jti-tig.git
cd jti-tig
chmod +x install.sh
sudo ./install.sh
Example:
This script will install and configure Telegraf, InfluxDB and Grafana from the official repos.

Enter the _full_ FQDN for this server (example: grafana01.acme-corp.com): grafana01.acme-corp.com
Create a new database for InfluxDB (example: jti): jti
Create a new user for InfluxDB (example: admin): admin
Enter the password for the InfluxDB user: secret
Enter the database retention period in days (example: 90d): 30d
Enter the FQDN or IP of a Juniper device capable of Streaming Telemetry (you can add more after the installation): qfx01.acme-corp.com

Collected Information:
FQDN: grafana01.acme-corp.com
InfluxDB Database: jti
InfluxDB Username: admin
Password: *** (hidden)
Database Retention Period: 30d
Juniper Device FQDN/IP: qfx01.acme-corp.com

Do you want to continue? (yes/no): yes
- After the installation go to https://fqdn and login to Grafana with default credentials (admin/admin).
- Download the jti_dashboard.json from this repository and import it to Grafana.
The installation script configures telegraf to use clear-text communication and to skip authentication.
Use the Junos below config to get started. All example configs are using JTI via dedicated OOB port with mgmt_junos vrf.
set system services extension-service request-response grpc clear-text port 32767
set system services extension-service request-response grpc routing-instance mgmt_junos
set system services extension-service request-response grpc skip-authentication
To enable encryption you need to upload certificates from TIG to each Juniper device:
sudo scp /etc/ssl/grafana-selfsigned.* user@juniper-device:/var/tmp/
Modify /etc/telegraf/telegraf.d/<device>-inputs.jti.conf to use encryption.
"insecure_skip_verify = true" must be used for self-signed certificates.
enable_tls = true
insecure_skip_verify = true
Load certificates and modify Junos config to enable SSL.
request security pki local-certificate load certificate-id grafana filename /var/tmp/grafana-selfsigned.crt key /var/tmp/grafana-selfsigned.key
set system services extension-service request-response grpc ssl port 32767
set system services extension-service request-response grpc ssl local-certificate grafana
set system services extension-service request-response grpc ssl use-pki
set system services extension-service request-response grpc routing-instance mgmt_junos
set system services extension-service request-response grpc skip-authentication
Modify /etc/telegraf/telegraf.d/<device>-inputs.jti.conf to use authentication
username = "user"
password = "pass"
client_id = "telegraf"
Remove skip-authentication from Junos
delete system services extension-service request-response grpc skip-authentication
Modify any RE firewall filter to allow TCP/32767 from TIG source.
Restart Telegraf.
sudo chown telegraf:telegraf /etc/telegraf/telegraf.d/*
sudo systemctl restart telegraf
sudo systemctl status telegraf <- check for errors
Juniper devices are stored in /etc/telegraf/telegraf.d/<device>-inputs.jti.conf
You can group multiple devices in a single inputs file, like QFX, EX, MX, SRX etc.
servers = ["leaf01.acme-corp.com:32767","leaf02.acme-corp.com:32767"]
You can also have one file per devices. This give you the most flexibility over what sensors and frequency to pick.
After you have added more input files, run:
sudo chown telegraf:telegraf /etc/telegraf/telegraf.d/*
sudo systemctl restart telegraf
sudo systemctl status telegraf <- check for errors
Telegraf is configured to subscribe to four sensors that are supported across all Juniper devices.
Frequency is set to 10000ms.
Sensor paths are quite broad and can be set to be more specific in order to save disk space. See Juniper Telemetry Explorer section.
sensors = [
    "/interfaces/",
    "/components/",
    "/network-instances/",
    "system_alarms /system/alarms/alarm/",
   ]
If you have SRX devices you can add security sensors below to monitor flow and SPU usage.
"security_spu /junos/security/spu/cpu/usage",
"security_flows /junos/security/spu/flow/usage",
Telegraf processors are configured to normalize data for easier manipulation in Grafana.
Config is located in /etc/telegraf/telegraf.d/processors.conf
https://apps.juniper.net/telemetry-explorer/


