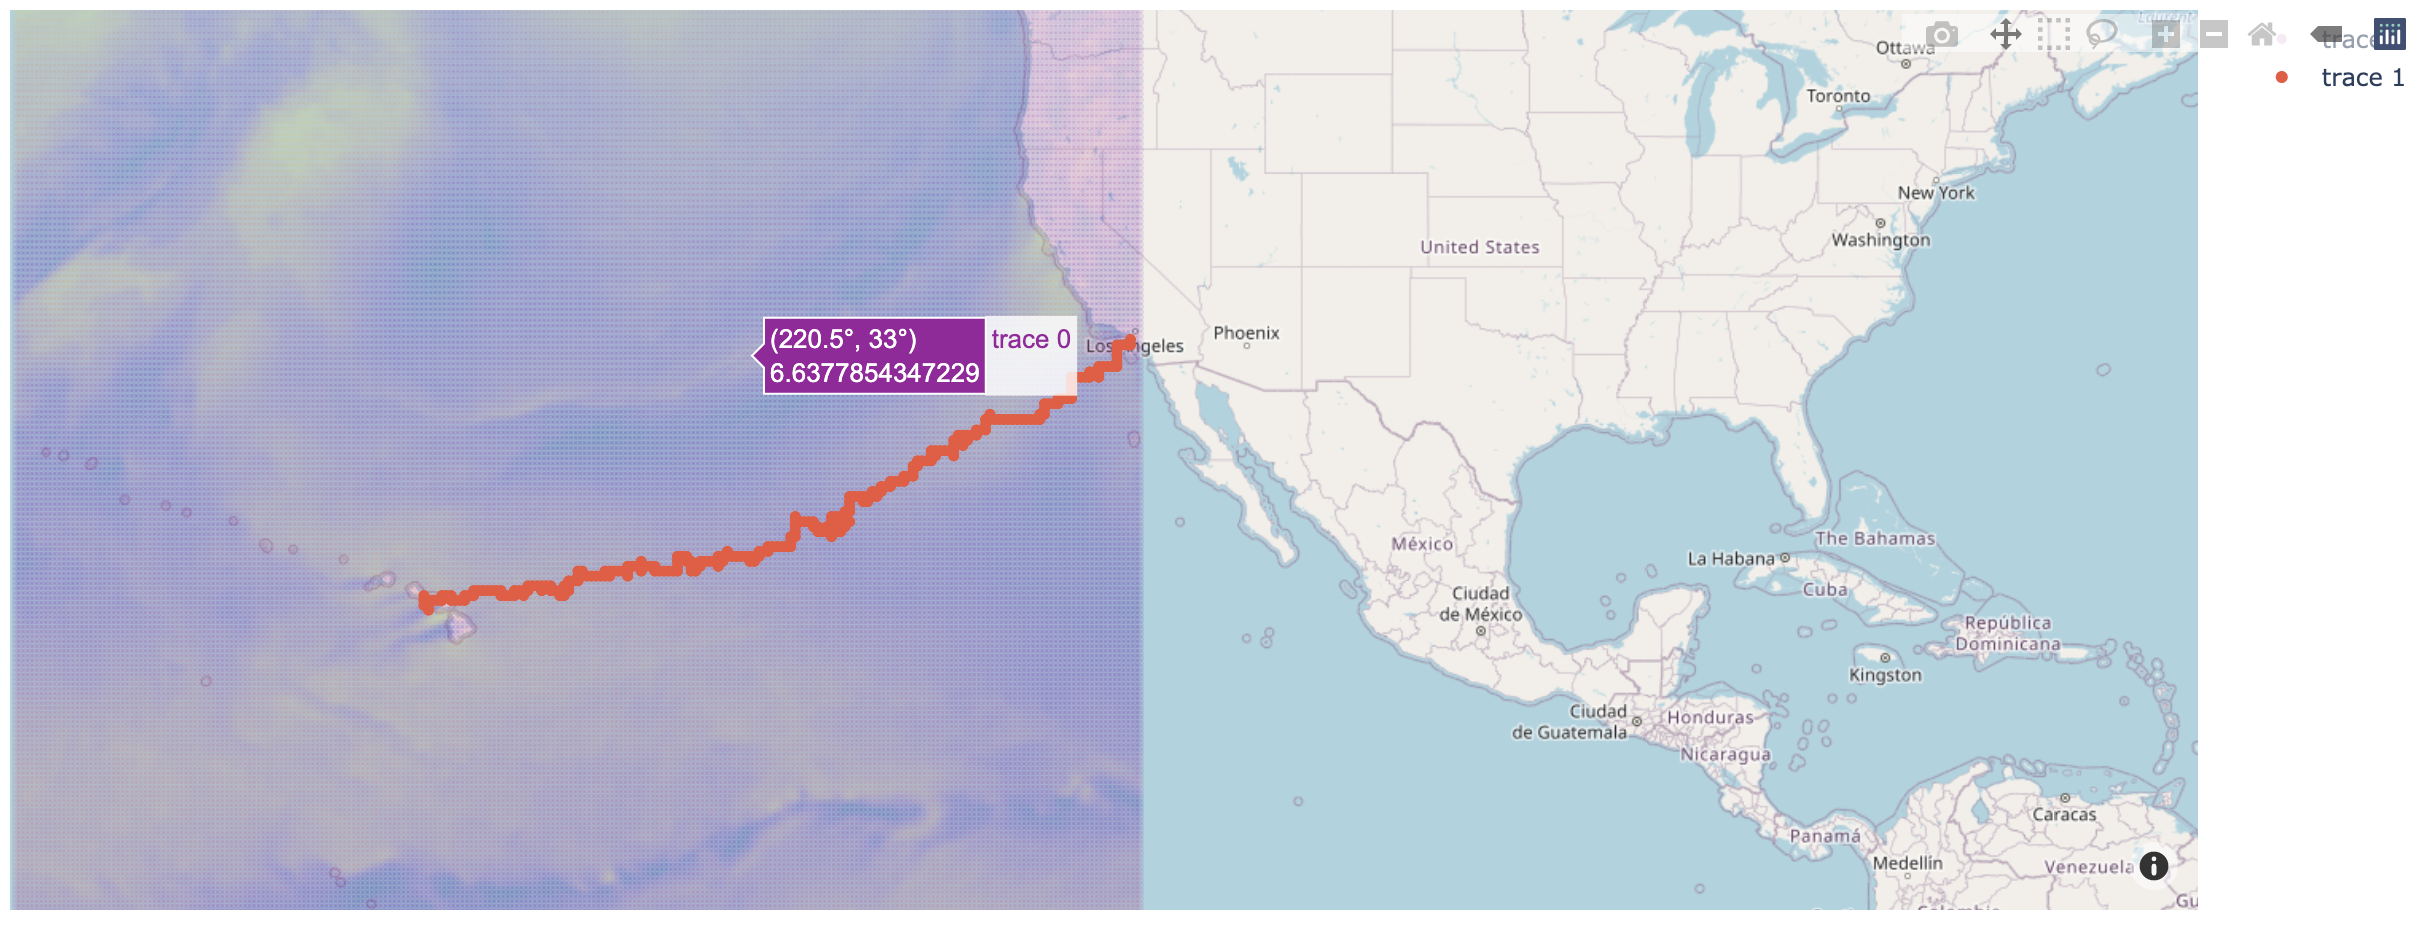
FasTack was completed as a project for the Insight Data Science Fellowship program (NY 2020B). You can see it in action here.
FasTack finds the best route between start and end coordinates for sailing races based on wind conditions from GFS data. The code is currently set up to optimize the route used by the Transpacific Yacht Race between the Pt. Fermin buoy (33.70˚N, 118.29˚W) in San Pedro, CA and the Diamond Head buoy (21.25˚N, 157.81˚W) off the coast of Oahu, but could be adujsted for other race coordinates. The user can access up to date weather and route info on https://fastack.app:8050/ as in the output below.
National Oceanic and Atmospheric Association Global Forecasting System weather data is obtained from the GrADS Data Server. Several data sources are available on GrADS, but FasTrak utilizes GFS because it has the highest granularity. Data are extracted from the server via OpenDAP and read using the netCDF4 package.
FasTack uses reinforcement learning via value iteration. Sailboat1.py contains code for a basic value iteration model, and Q-learning is implemented in SailboatQ.py. The files are based on the source code for the Grid World and Grid World with Q-learning, respectively.
The route can be visualized with corresponding weather data using InteractiveMapper.py. FasTackapp.py and DynamicRoute.py plot a dynamic, multi-day route that requires re-optimization of the route from a new start location for each subsequent weather file. This can be used to simulate an actual race in pseudo real-time. DynamicRoute.py plots each new route as a "leg" following re-optimization to show how the final route is built, and FasTackapp.py plots an animation of the forward progress of the agent (boat) along the final route with a color change indicating each update.
Note that only 10 days of weather data are available on the GrADS server, so the weather file used in the code must be updated to one that is currently available.
FasTack is a Dash Plotly app hosted on AWS. InteractiveMapper.py generates the plotly plot, which is called into and deployed via InteractiveMapperApp.py on the ec2 instance.
PlottingWorkbook.ipynb includes additional code for both route and weather data visualization. Note that wind vector visualization is not currently supported by the quiver function in plotly and can only be accomplished via Basemap. To see function outputs, view this file with Jupyter nbviewer.
All required packages are included in requirements.txt. Note that latest versions of the netCDF4 and pygrib are best installed by cloning the GitHub repository and follwing the "Quick Start" instructions for installation (also true for ec2 instance). For this reason, they are commented out in requirements.txt, but the links are included for the user's convenience. Basemap is installed directly from GitHub via requirements.txt.
