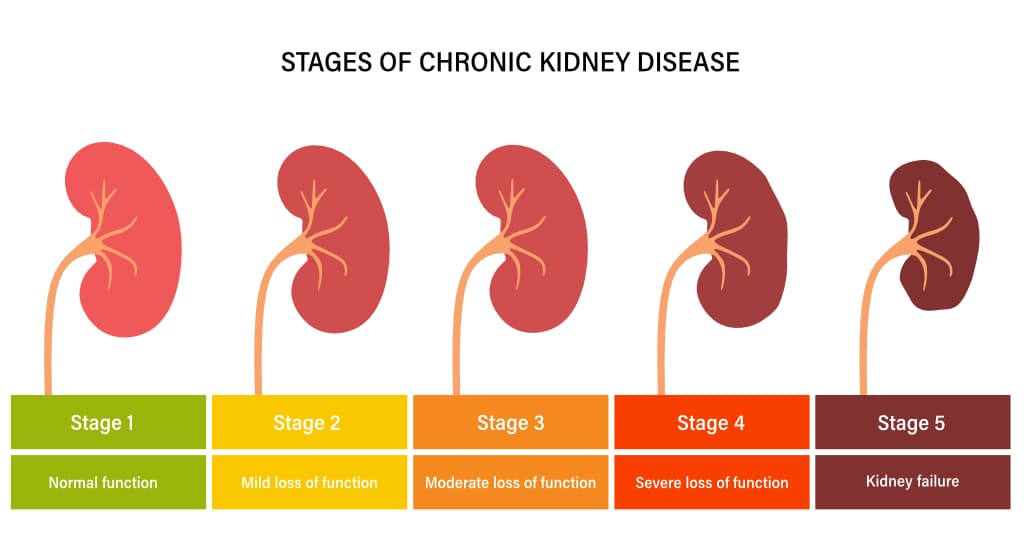
Chronic kidney disease (CKD) is a condition in which your kidneys gradually lose their ability to help your body remove waste and fluid from your blood. When this happens, harmful wastes and fluids begin to build up in your body, making you feel unwell and out of balance. Although chronic kidney disease (CKD) is not curable, treatment can help slow its progression, control symptoms and enable you to live a full life.
Using Patient past records we will predict whether a patient will progress in CKD staging or not.
Here is the link to our notebook
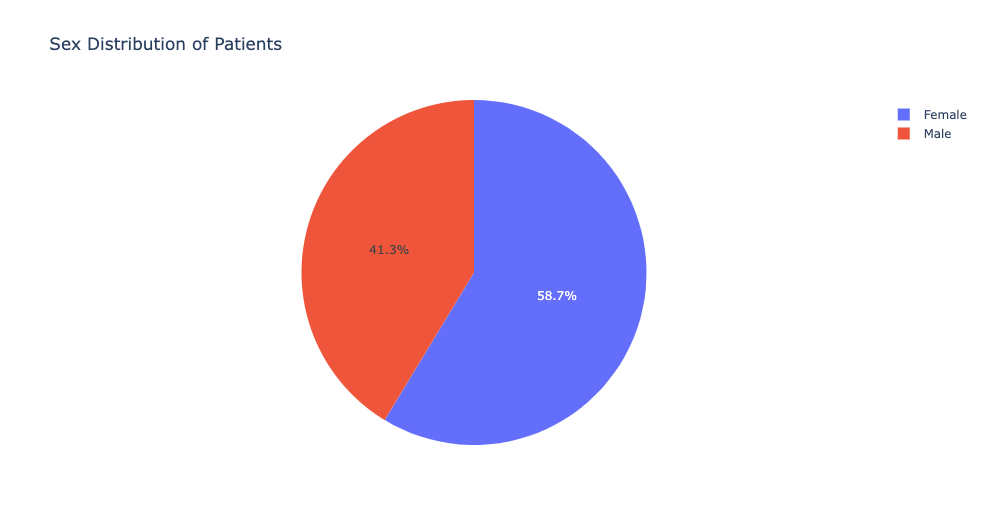
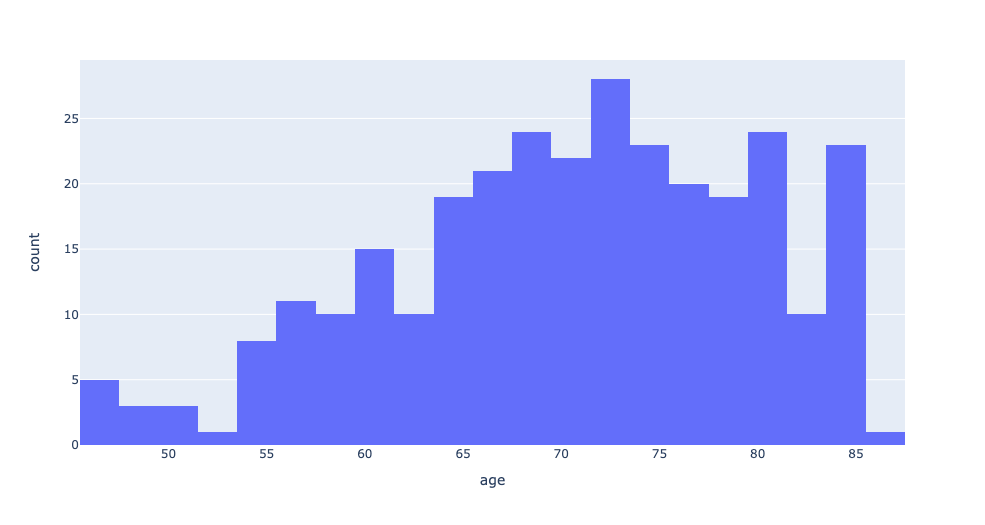
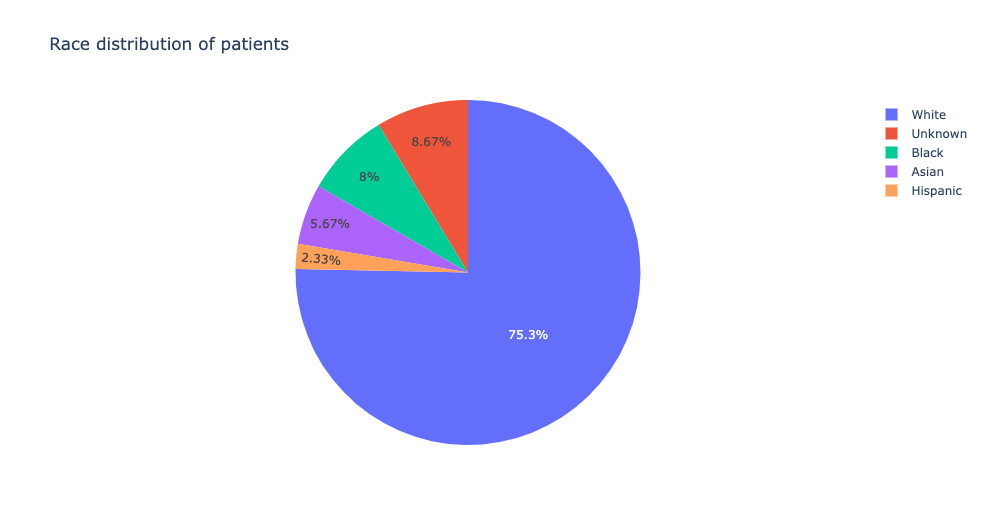
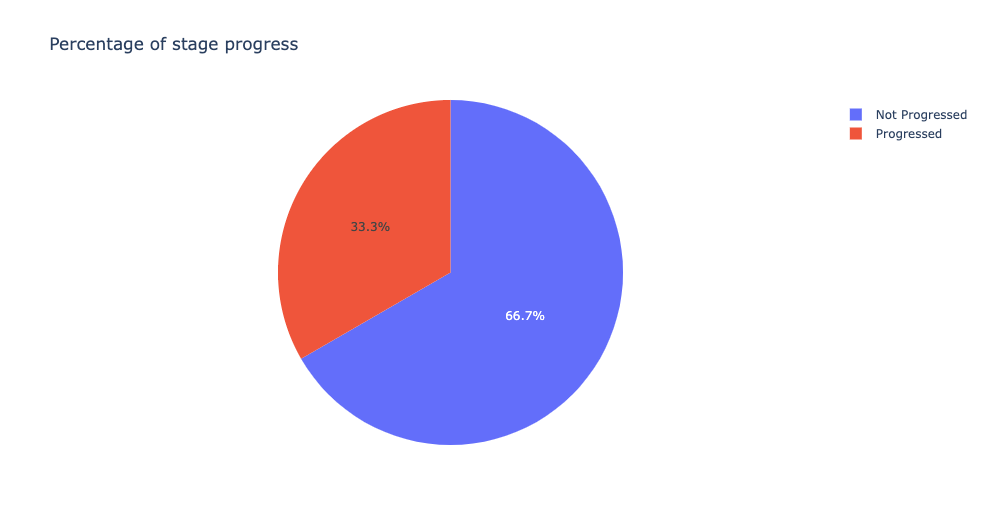
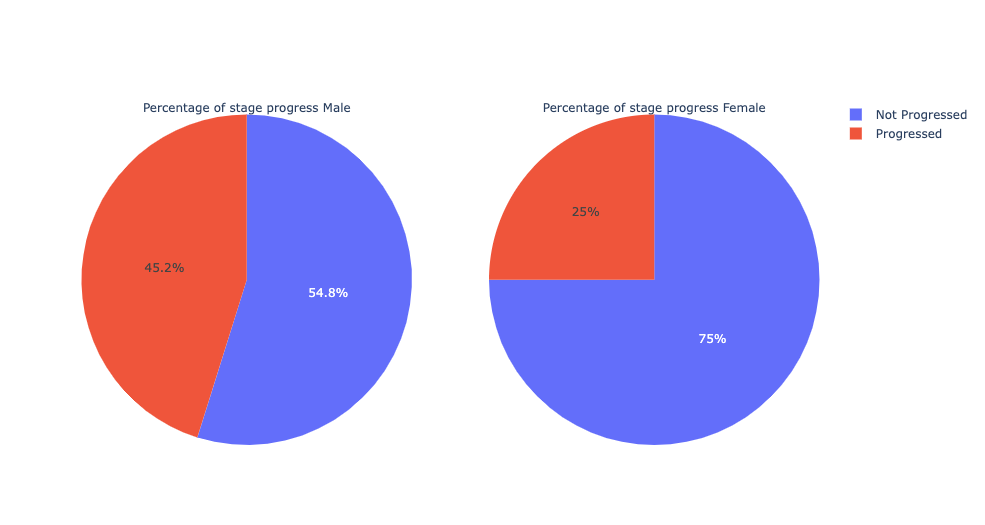
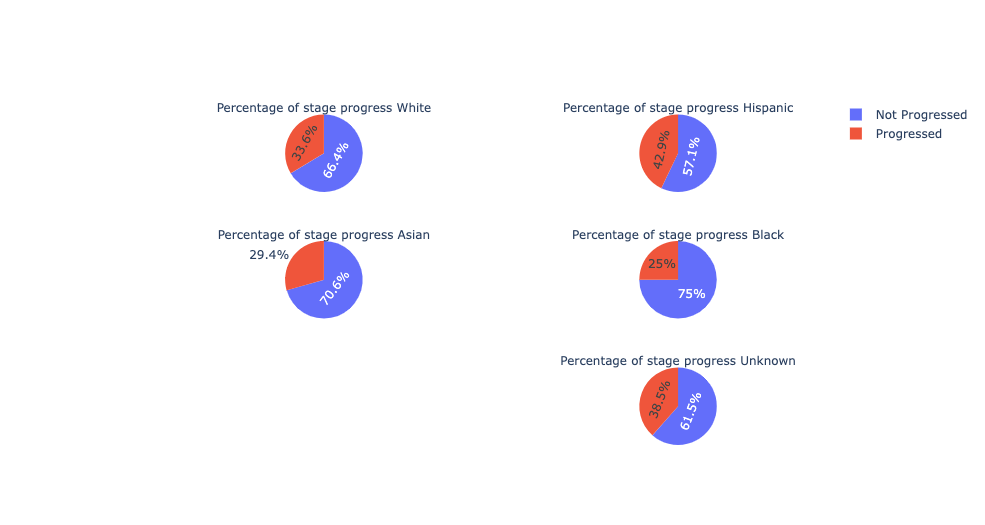
We will be understanding the patients demographics based on Gender, Age, Race and Stage Progression
Since I was trying Survival Analysis first time since college, I wanted to first check how the data reacts with the machine learning and explored various models.
- For blood works and blood pressure:
- For blood works like glucose, creatine, systolic and diastolic blood pressure, I took mean value of the observations and calculated the duration based on first and last day of observation
- For medicines:
- I grouped the patient ids and medicines and calculated the total dose by multiplying each medicines doses and their start and stop date difference and provided a summation of the doses based on each medicine
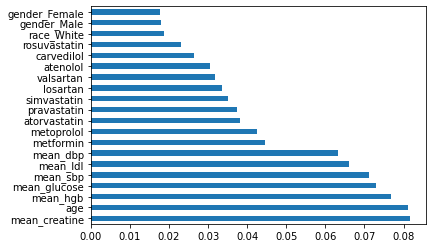
I used ExtraTreesClassifier to find the features holding the maximum importance.
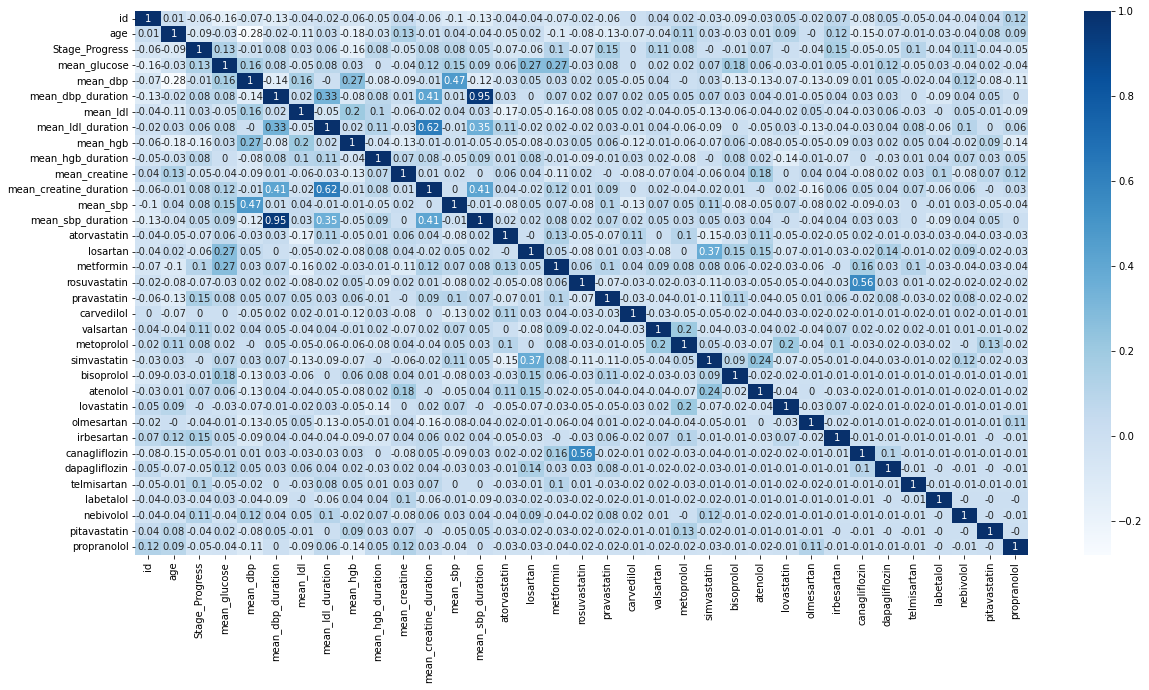
HeatMap Representation :
I used SMOTE to improve the imbalanced data
The following were the performance metrics of the models
| Performance metrics | Score |
|---|---|
| Accuracy | 0.6222222222222222 |
| Precision | 0.47619047619047616 |
| Recall | 0.625 |
| F1 Score: | 0.5405405405405405 |
| Performance metrics | Score |
|---|---|
| Accuracy | 0.7111111111111111 |
| Precision | 0.6 |
| Recall | 0.5625 |
| F1 Score | 0.5806451612903225 |
| Performance metrics | Score |
|---|---|
| Accuracy | 0.6555555555555556 |
| Precision | 0.5185185185185185 |
| Recall | 0.4375 |
| F1 Score | 0.47457627118644063 |
| Performance metrics | Score |
|---|---|
| Accuracy | 0.6555555555555556 |
| Precision | 0.5135135135135135 |
| Recall | 0.59375 |
| F1 Score | 0.5507246376811593 |
I wanted to see how my model works realtime by changing the data, so I used Giskard for inspection. Here is a speak peak of my exploration.
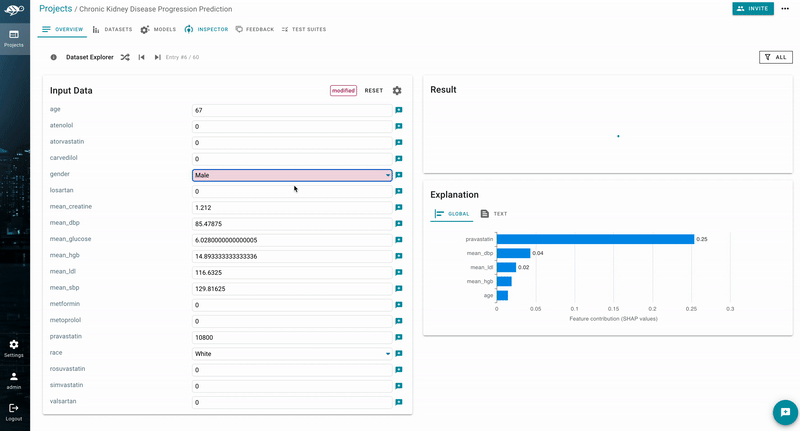
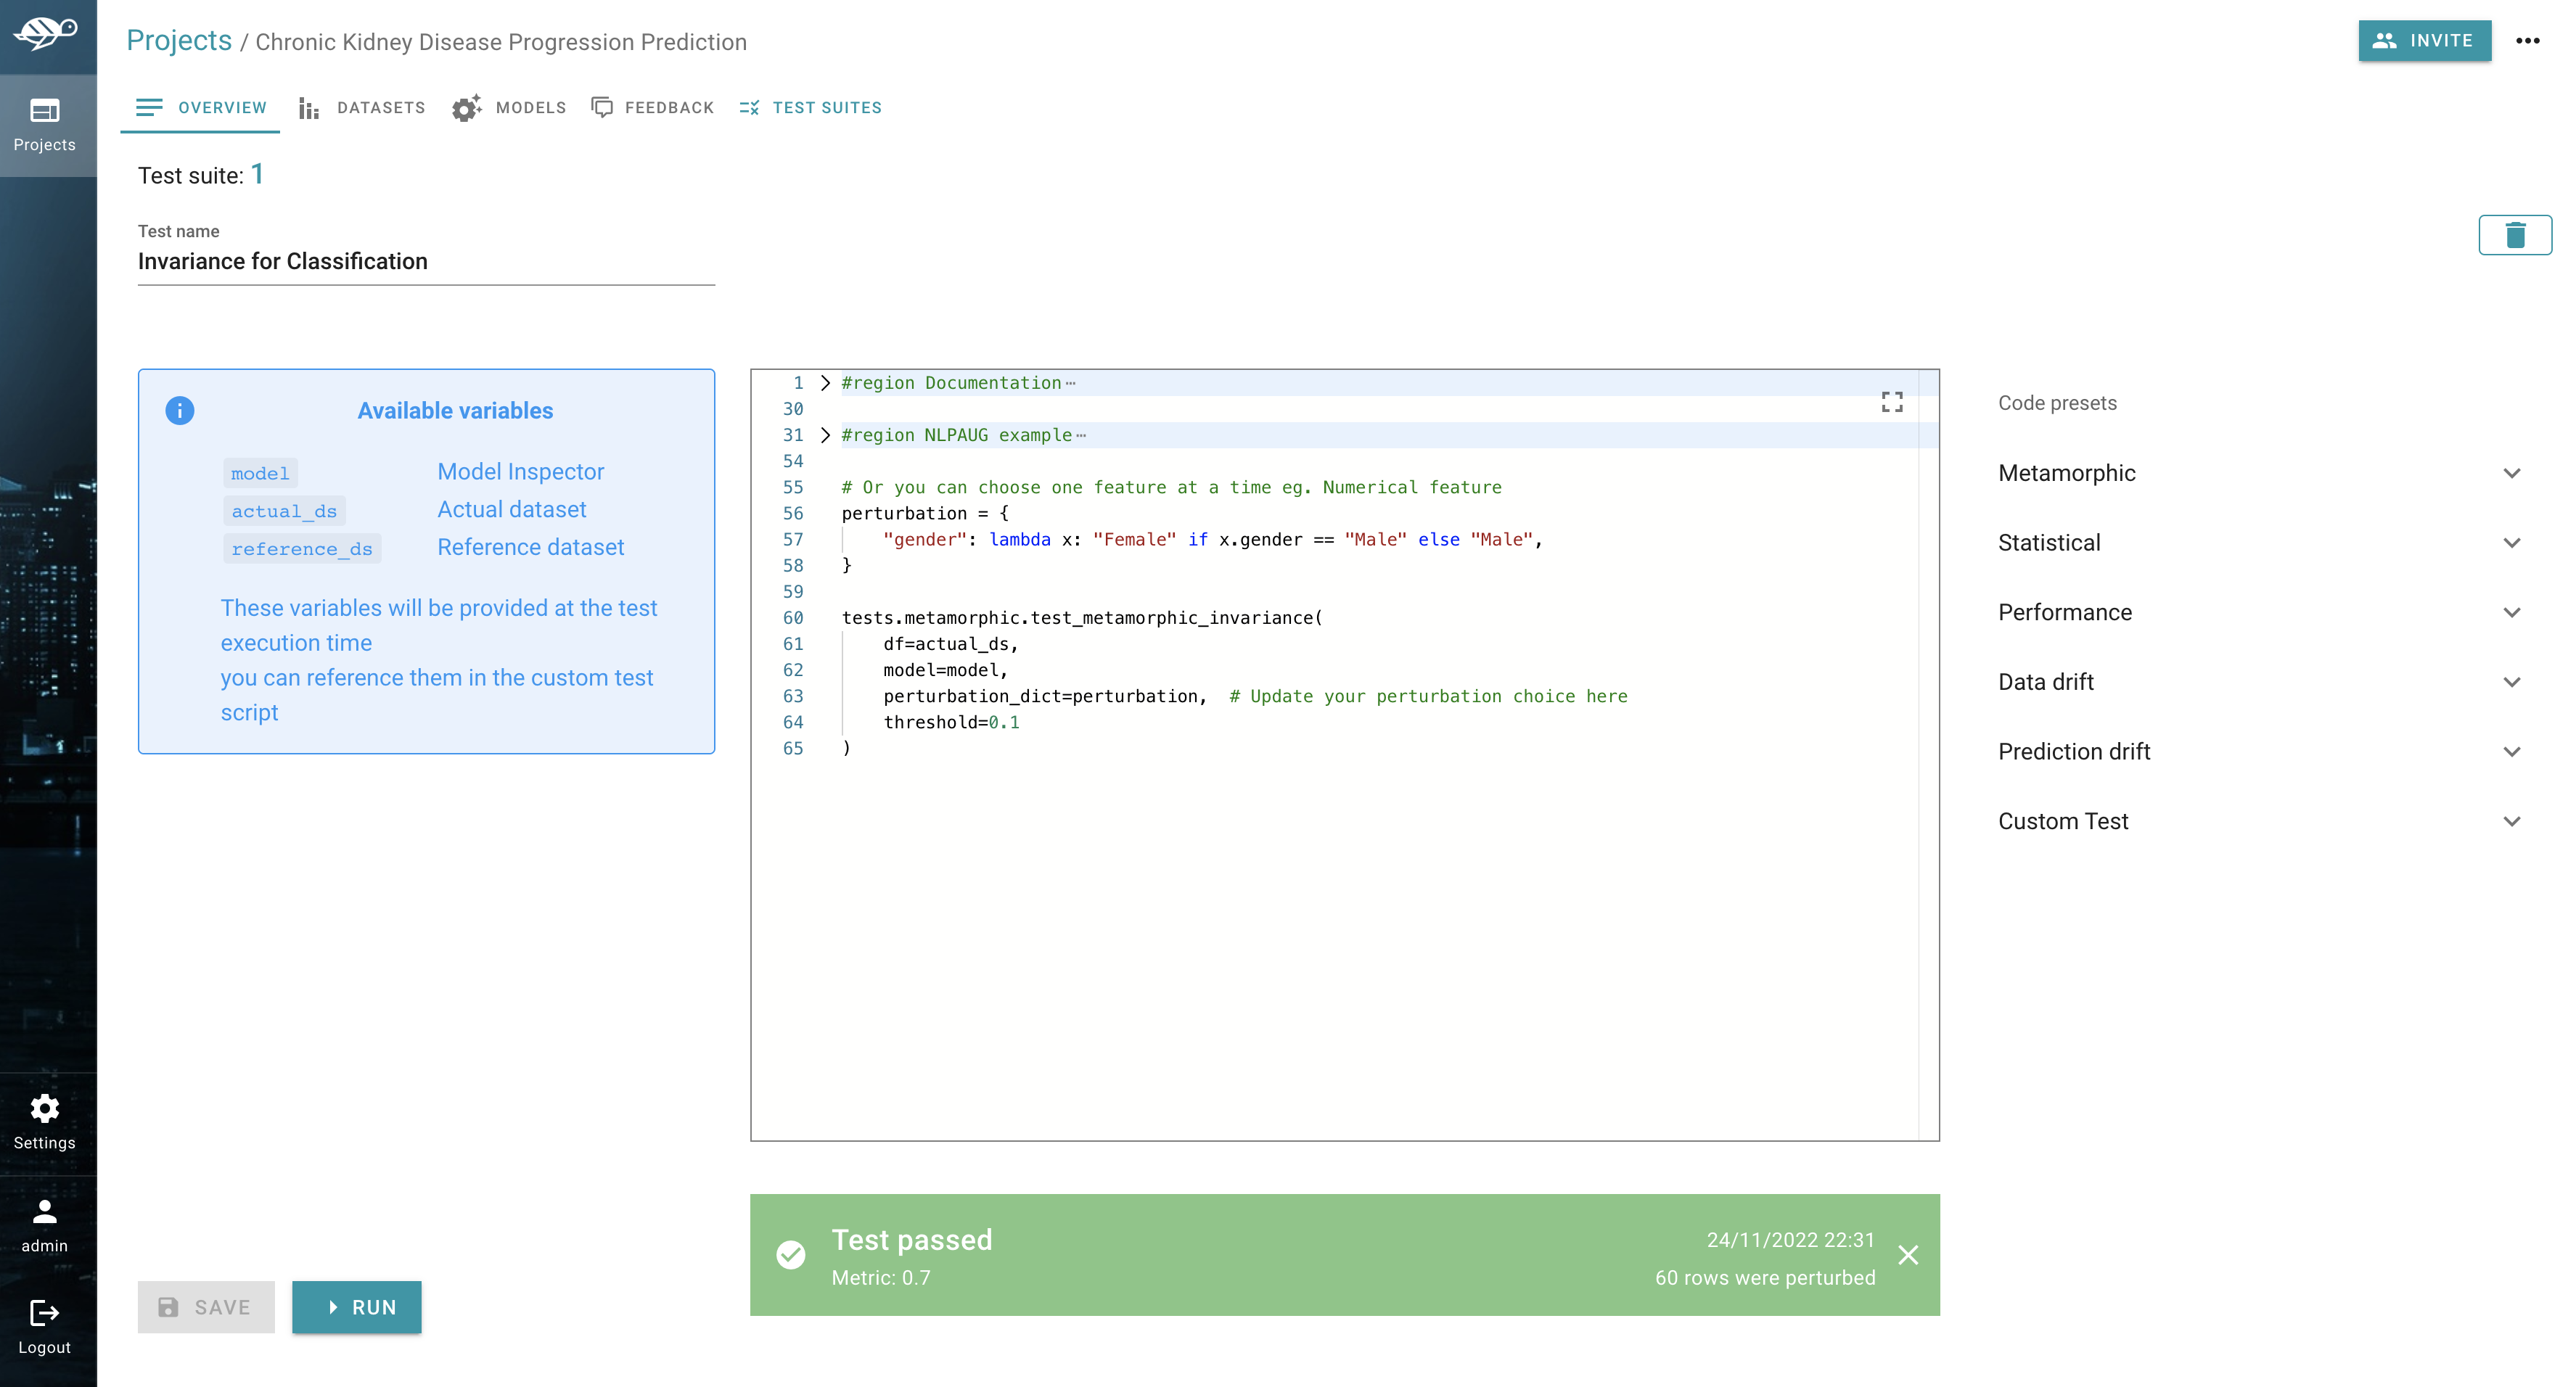
Do you want to check if Gender changes the prediction for whole dataset? Metamorphic tests to help us in the process

Using Kaplan Meier Estimator, we could see the survival curve based on gender
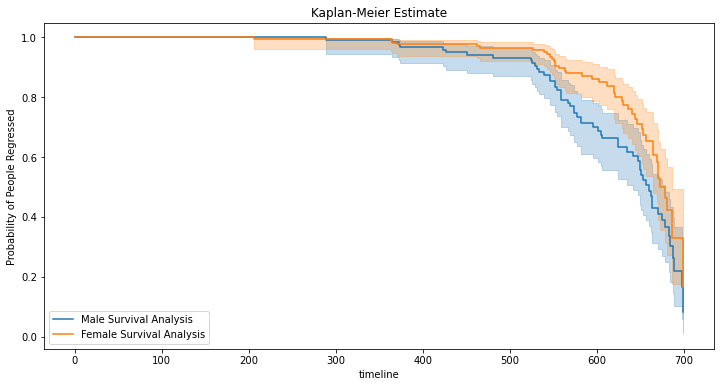
And the Log rank test with p-value 0.02 which is less than 0.05, helped me conclude that we can reject the null hypothesis and conclude that gender of a person plays a significant role in the progression of CKD
According to the curve male will progress in the staged of CKD more than females
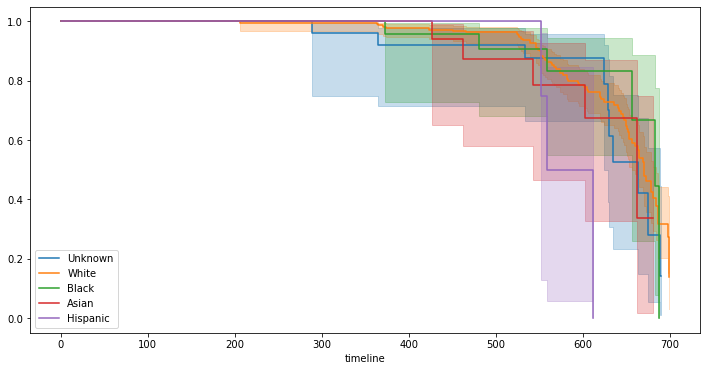
In log rank test, the p-value of 0.05 helped us conclude that we can reject the null hypothesis and conclude that race of a person plays a significant role in the progression of CKD
According to the curve Hispanics progress in CKD stages more as compared to other races
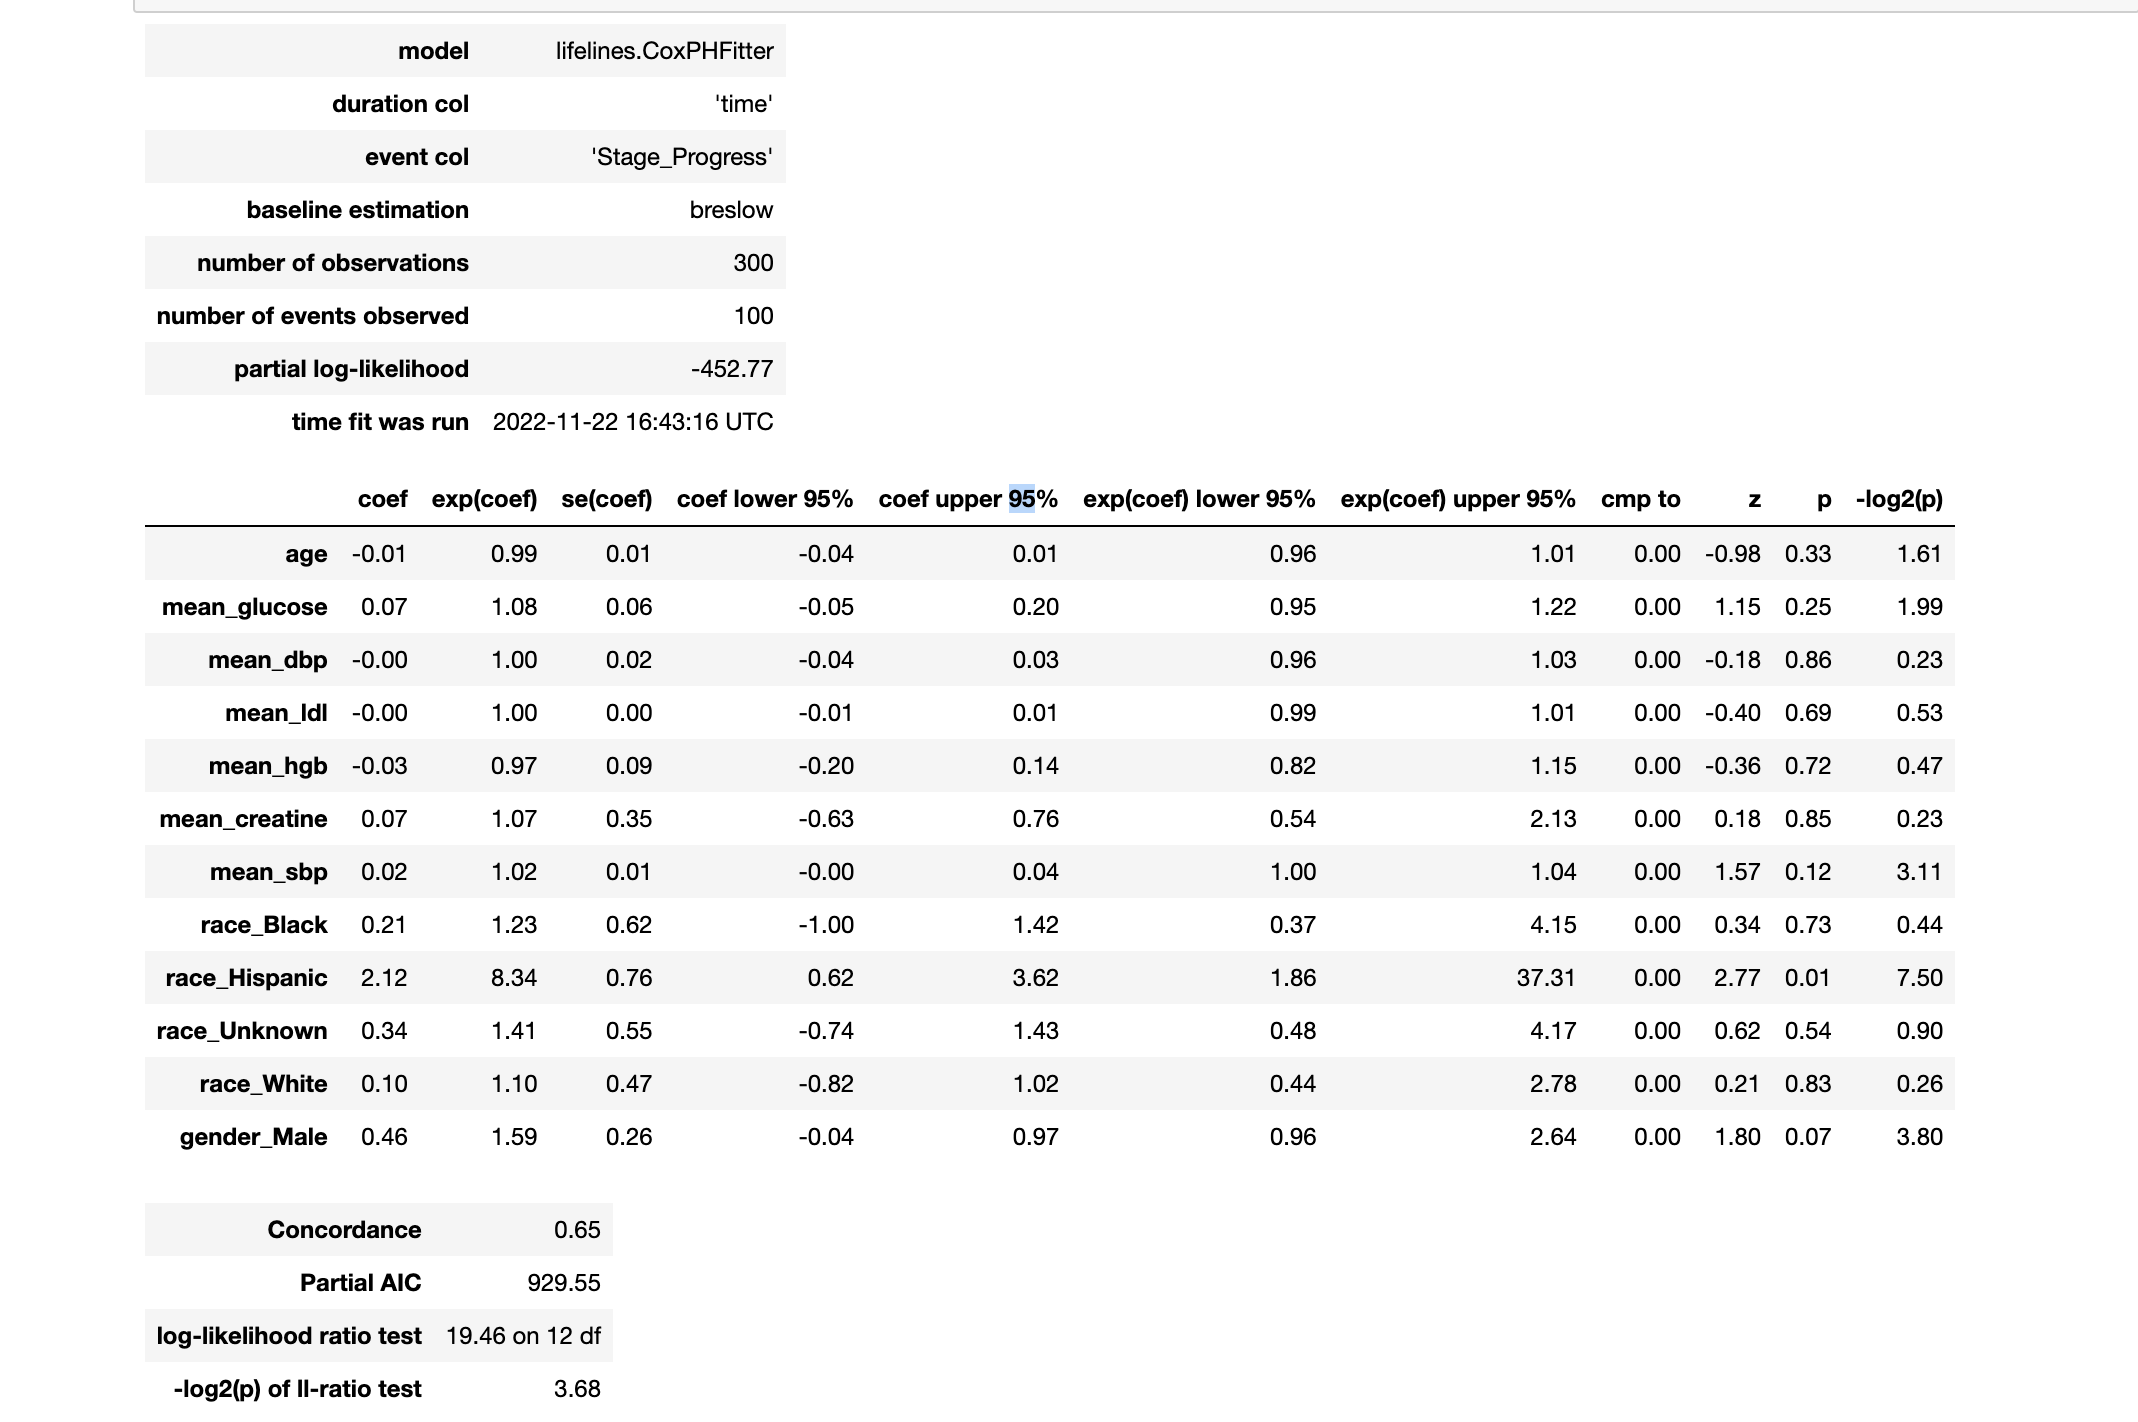
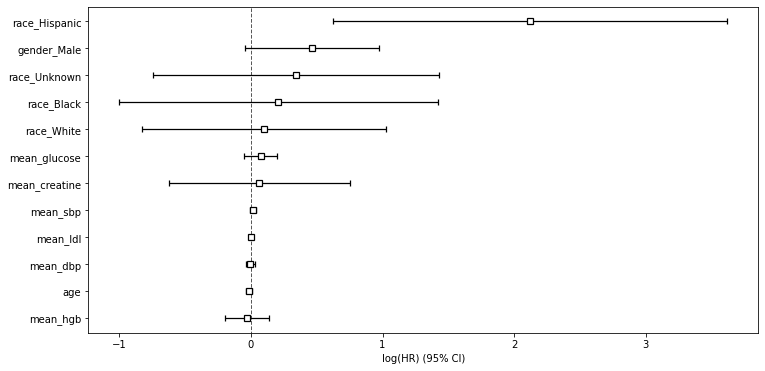
- Being Hispanic increases your chances of progression in CKD stages are 734%
- Males have 59% higher chances of progressing as compared to female
- Glucose level plays an important role. Higher glucose level leads to 8% chances of progression
- Higher creatine level leads to 7% chance of progressing in CKD stages
- Higher SBP leads to 2% chances of progressing in CKD Stages
- Higher HGB levels decreases the chances of progressing by 3%