The Point85 Overall Equipment Effectiveness (OEE) applications enable:
- collection of equipment data from multiple sources to support OEE calculations or general purpose data acquisition
- resolution of a collected data value into an availability reason or produced material quantity to provide input to the performance, availability and quality components of OEE
- calculation of the OEE key performance indicator (KPI) for the equipment using an optional work schedule for defining the scheduled production time
- monitoring of equipment availability, performance and quality events
Sources of equipment availability, performance and quality event data include:
- Manual: operator data entry
- OPC DA: classic OLE for Process Control (OPC) Data Acquisition (DA)
- OPC UA: OLE for Process Control Unified Architecture (UA)
- HTTP/HTTPS: invocation of a web service via an HTTP request
- RMQ Messaging: an equipment event message received via a RabbitMQ message broker
- JMS Messaging: an equipment event message received via an ActiveMQ message broker
- MQTT Messaging: an equipment event message received via an MQTT message server
- Kafka Messaging: an equipment event message received via a Kafka server
- Web Socket Messaging: an equipment event message received via a web socket server
- Email/Text Messaging: an equipment event message received via an email server
- Database Interface Table: a predefined table for inserting OEE events
- File Share: a server hosting OEE event files
- Modbus: a Modbus master communicating with its slaves.
- Cron Job: a cron job scheduled to execute at specified points in time
- GE Proficy Historian: a historian server for equipment events
The Point85 applications supporting OEE are:
- Designer: a GUI application for defining the plant equipment, data sources, event resolution scripts, manufacturing work schedule, availability reasons, produced materials and units of measure for data collectors. The designer also includes a dashboard and trending capabilities.
- Collector: a Windows service or Unix deamon to collect the equipment event data and store it in a relational database
- Monitor: a GUI application with a dashboard to view the current equipment OEE and status
- Operator Desktop: a desktop GUI application for manual entry of equipment events
- Operator Web: a web-application for manual entry of equipment events
- Operator Android: Android application for manual entry of equipment events
- Operator iOS: iOS application for manual entry of equipment events
- Operator Windows: Windows application for manual entry of equipment events
- Operator Linux: Linux application for manual entry of equipment events
- Operator macOS: macOS application for manual entry of equipment events
- Operator Chrome: Chrome/Edge browser application for manual entry of equipment events
In addition, two GUI test applications assist in the development of an OEE solution:
- Tester: a GUI application for testing data sources
- Collector UI: a front-end GUI for a data collector
For more information about the Designer and other OEE applications, please refer to the Point85 OEE User Guide in the docs folder. A getting started tutorial, Point85 OEE Getting Started Guide, is also available in the docs folder. In addition, a document in this folder titled PackML and Point85 OEE describes a possible implementation the Point85 Overall Equipment Effectiveness (OEE) solution for equipment with a PackML interface.
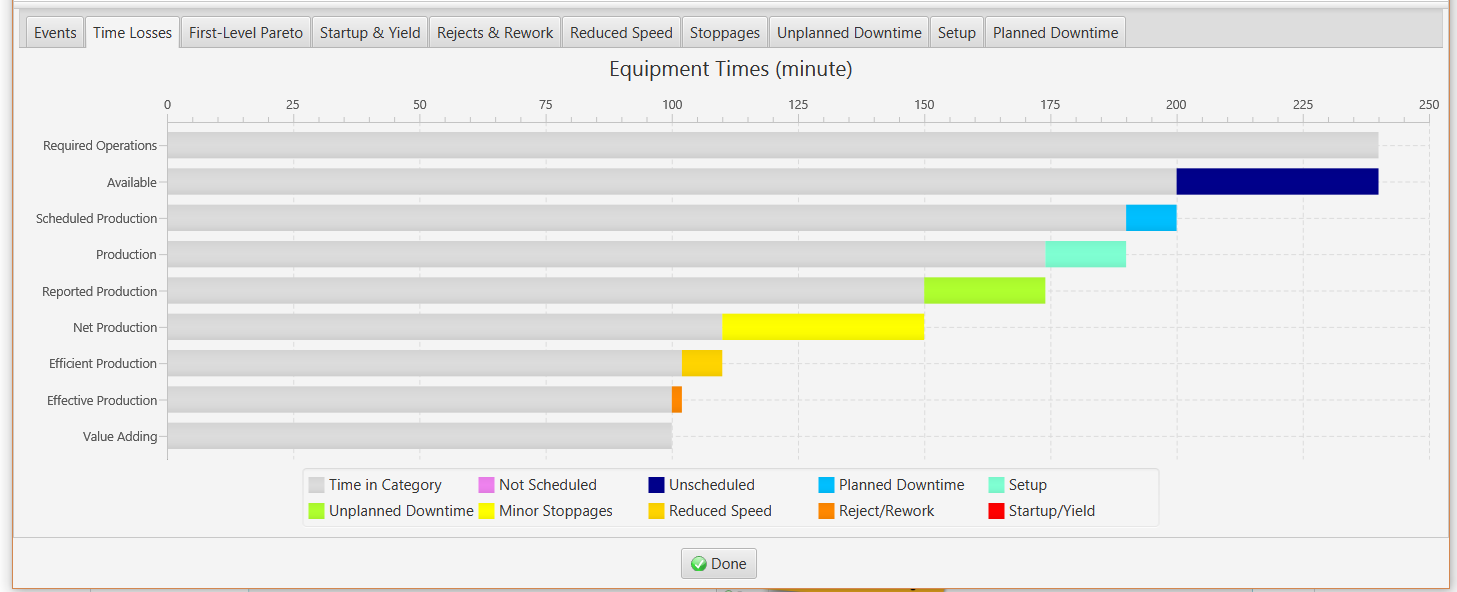
OEE is the product of equipment availability, performance and quality each expressed as a percentage. The time-loss model is used to accumulate time in loss categories (or “no loss” if the equipment is running normally). A data source provides an input value to a data collector’s resolver JavaScript function that maps that input value to an output value (reason or production count).
For availability and performance, the output value is a reason that is assigned to one of the following loss categories:
- Value Adding: the “no loss” or “running OK” category.
- Not Scheduled: this is non-working time. Non-working periods (e.g. holidays) typically are planned in the work schedule that is assigned to a plant entity.
- Unscheduled: working time when the equipment is not scheduled for normal production (e.g. an R&D or laboratory test run).
- Planned Downtime: working time when the equipment is not scheduled for normal production but the activity is intended to support production (e.g. planned preventive maintenance).
- Unplanned Downtime: working time when the equipment is not available due to an unexpected fault (e.g. motor failure or jam).
- Setup: working time when the equipment is being changed over in order to run new material.
- Stoppages: minor or short periods of time when the equipment is not producing as expected (such as a blocked or starved condition).
- Reduced Speed: the equipment is producing, but not at its design speed or ideal run rate.
For quality or yield, the data source provides a production count in the good, reject/rework or startup & yield categories in the defined units of measure for the material being produced. This count has an equivalent time loss calculation by using the defined ideal or nominal speed.
The diagram below is an overview of the system achitecture:
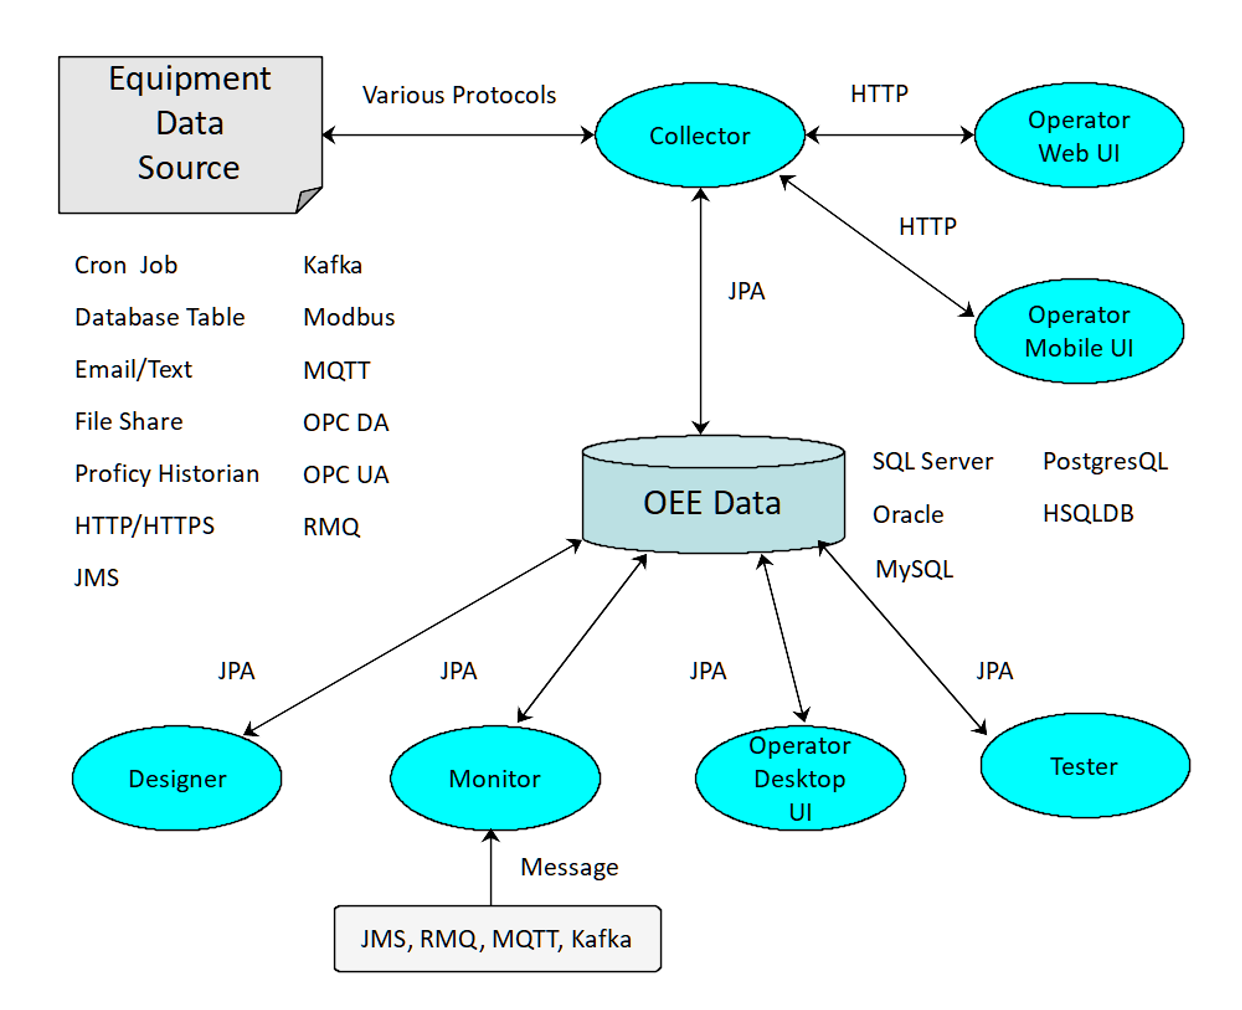
The OEE applications can be grouped into design-time and run-time. The design-time Designer application is used to define the plant equipment, data sources, event resolution scripts, manufacturing work schedule, availability reasons, produced materials and units of measure for data collectors. The designer also includes a dashboard and trending capabilities.
An automated run-time data collector receives an input value from a data source source and executes a JavaScript resolver on this input to calculate an output value. The output value is a reason (mapped to an OEE loss category) for availability or performance events, a new production count (good, reject/rework or startup) for quality events or a material/job change event. For the case of a custom event, the output value is ignored. The event data is stored in a relational database where it is available for OEE calculations. Microsoft SQL Server, Oracle, MySQL, PostgresQL and HSQLDB are currently supported.
A web-based manual data collector running in a web server records the OEE events based on information entered by an operator. Similar to the automated collector, this data is also stored in the relational database. If the system is configured for messaging, the event data is also sent to a RabbitMQ, JMS, MQTT or Kafka message broker to which a run-time monitor application can subscribe. A monitor displays a dashboard for viewing equipment OEE events. It also displays collector notifications and status information.
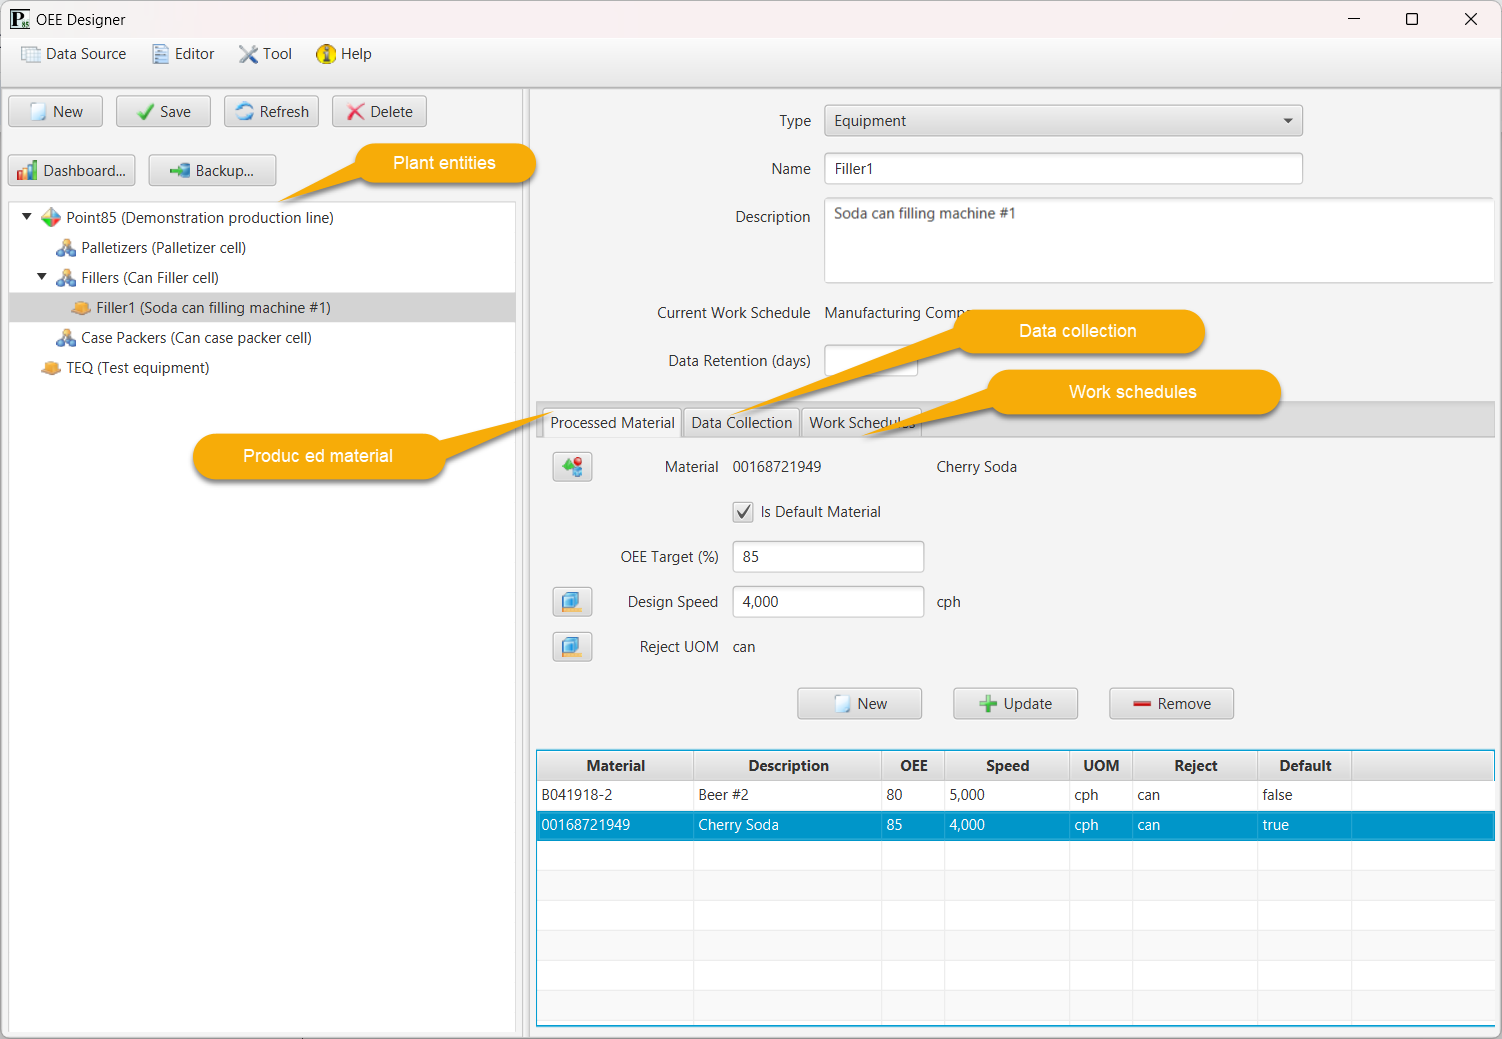
The Designer is focused on configuring all aspects of equipment in order to enable OEE calculations. It has editors for defining the plant model. For example, the plant entity editor is:
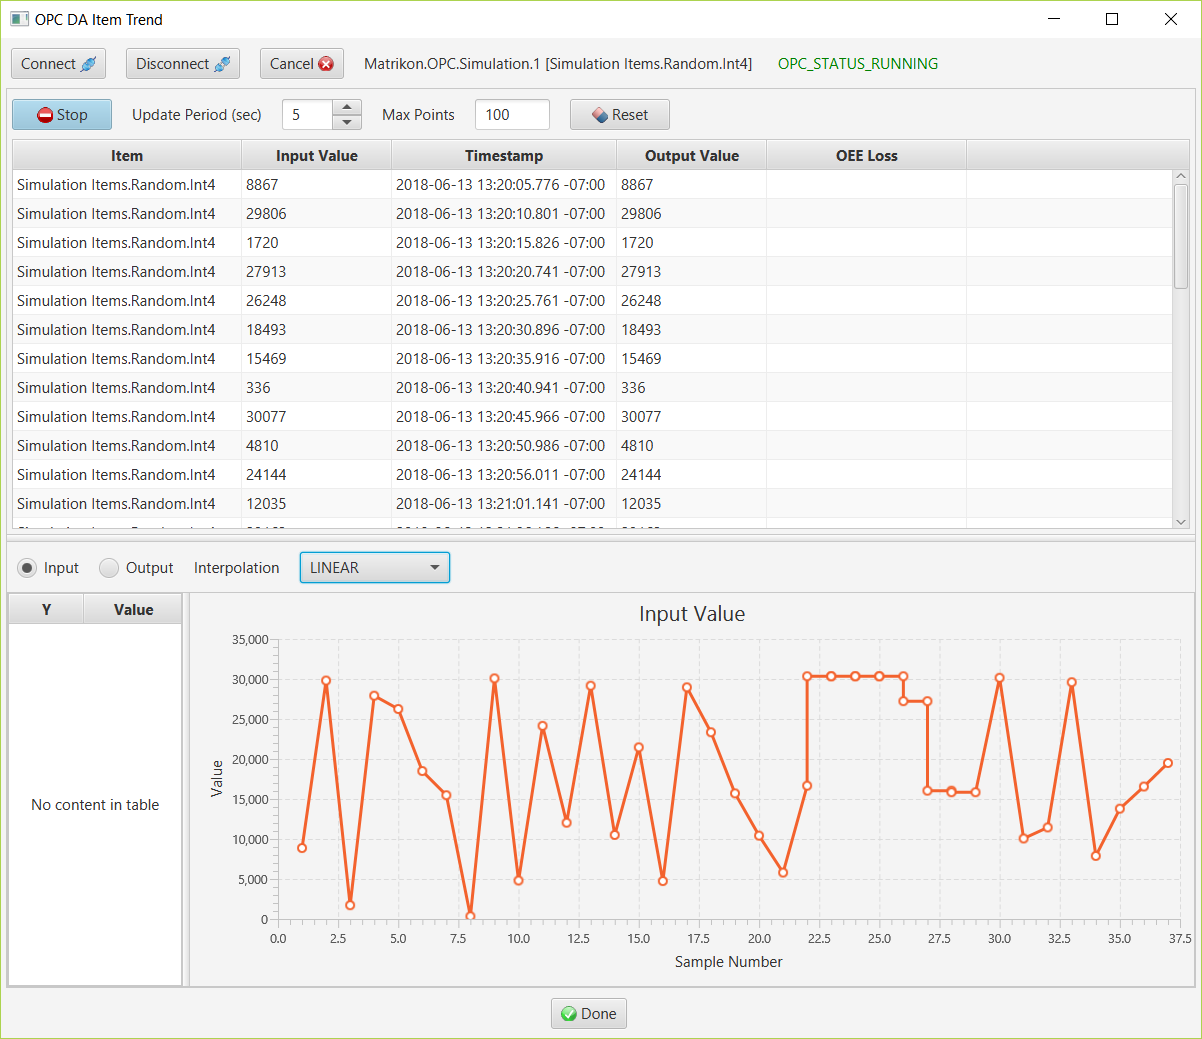
The Designer has a trending capability to observe the input and output values of a configured data source. For example, an OPC DA variable trend is:
The Collector application runs as a Windows service or Unix daemon on the configured host computer. A Collector executes equipment event resolver scripts upon receipt of an input value and stores the availability, production, material or job change event data in the database. This data is used for OEE calculations.
The Monitor application has three main functions, to observe:
- Equipment performance via metrics available in the dashboard.
- Notifications from the data collectors for abnormal conditions
- Data collector status.
An example of dashboard tiles is:

Production and availability events can be shown in chronological order, for example:

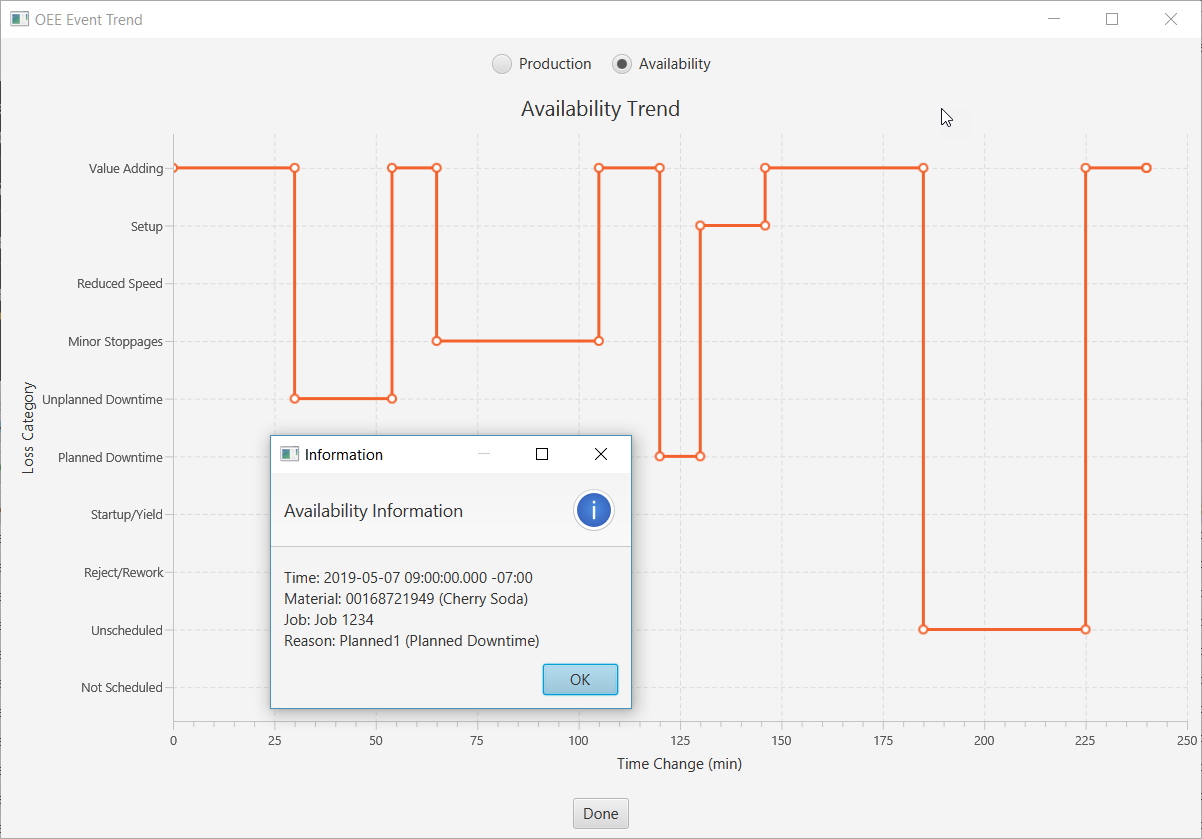
Production and availability events can also be shown in a trend chart, for example:
The time-losses tab shows a bar chart of the OEE loss categories:
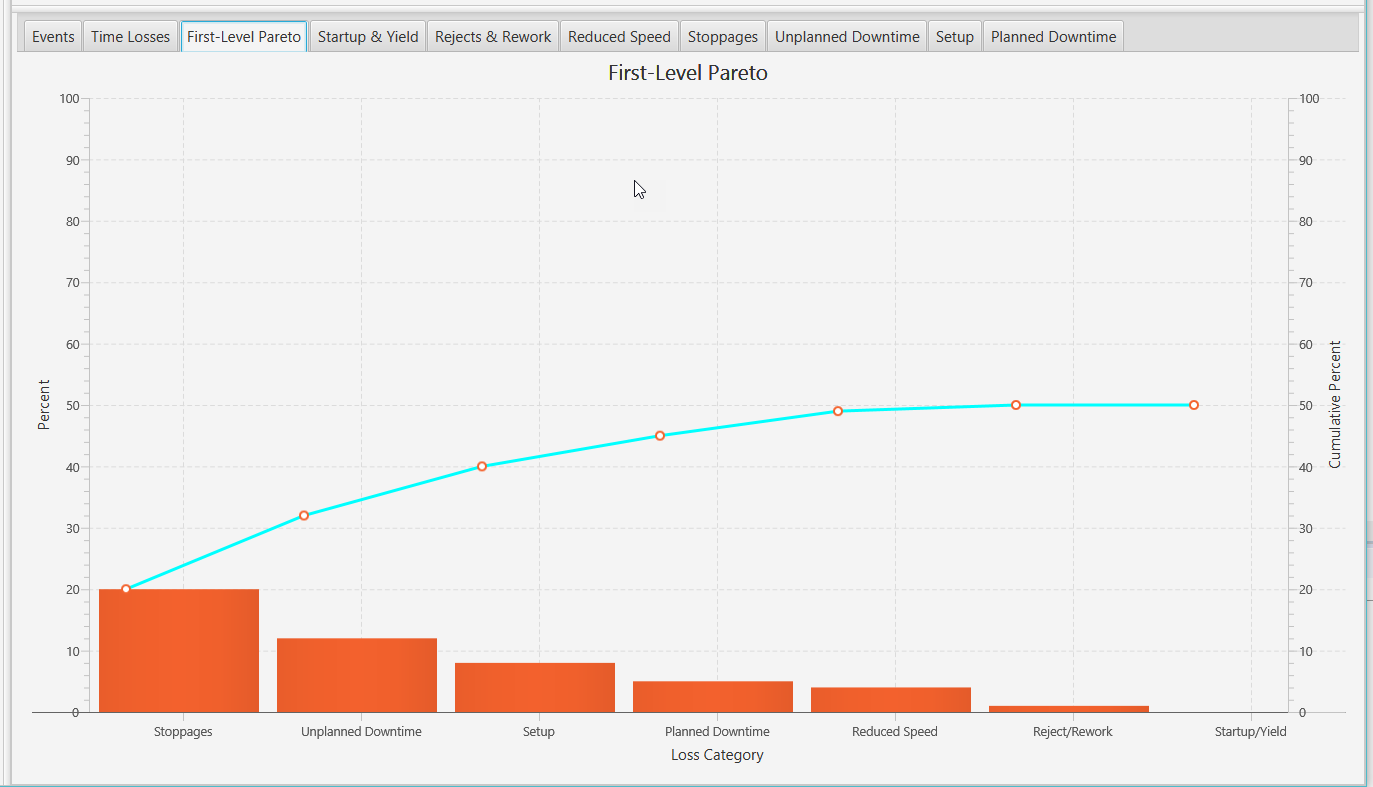
A first-level Pareto chart show the time losses in percentage terms, for example:
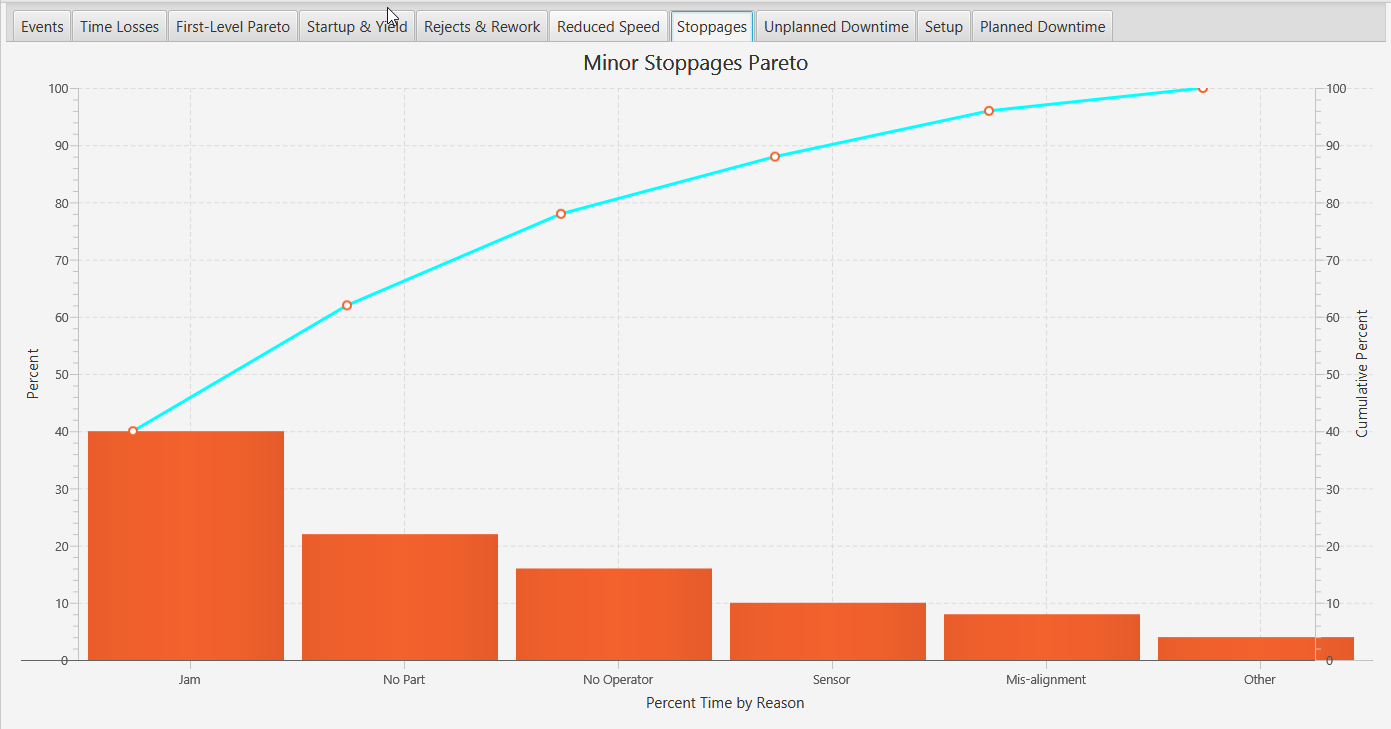
A second-level Pareto displays the reasons for an availability category, for example:
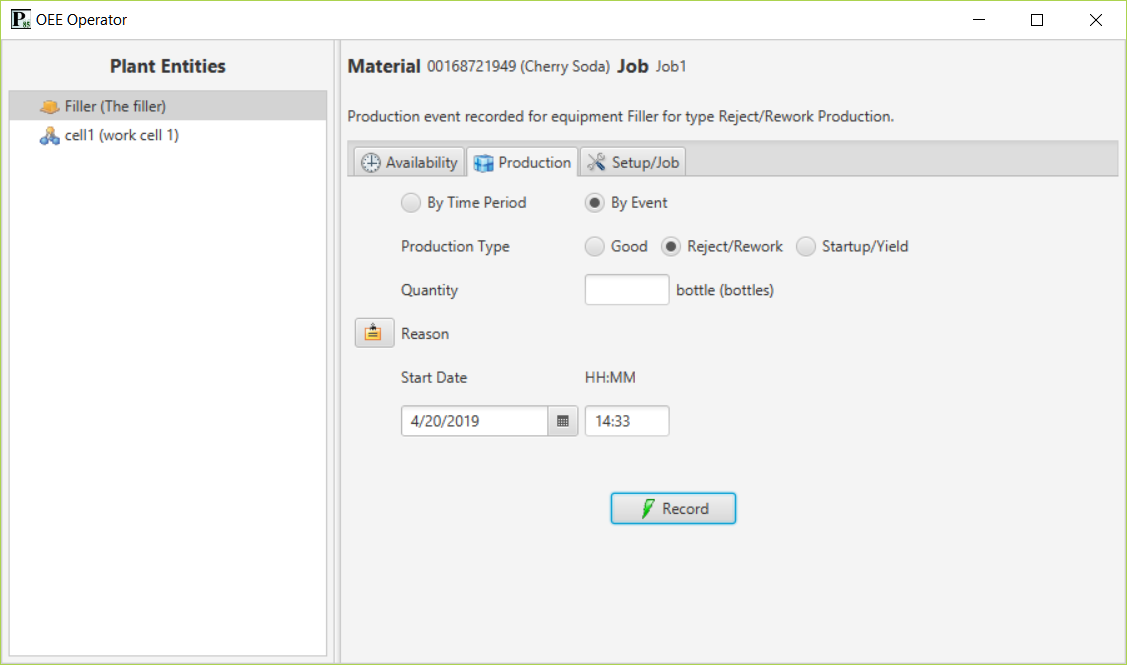
The Operator application is a desktop application that allows a user to enter availability, performance, production, material change and job events. The events can be recorded in chronological order as they happened or in summary form over a period of time by duration of the event.
For example, the screen for entering a reject production event is:
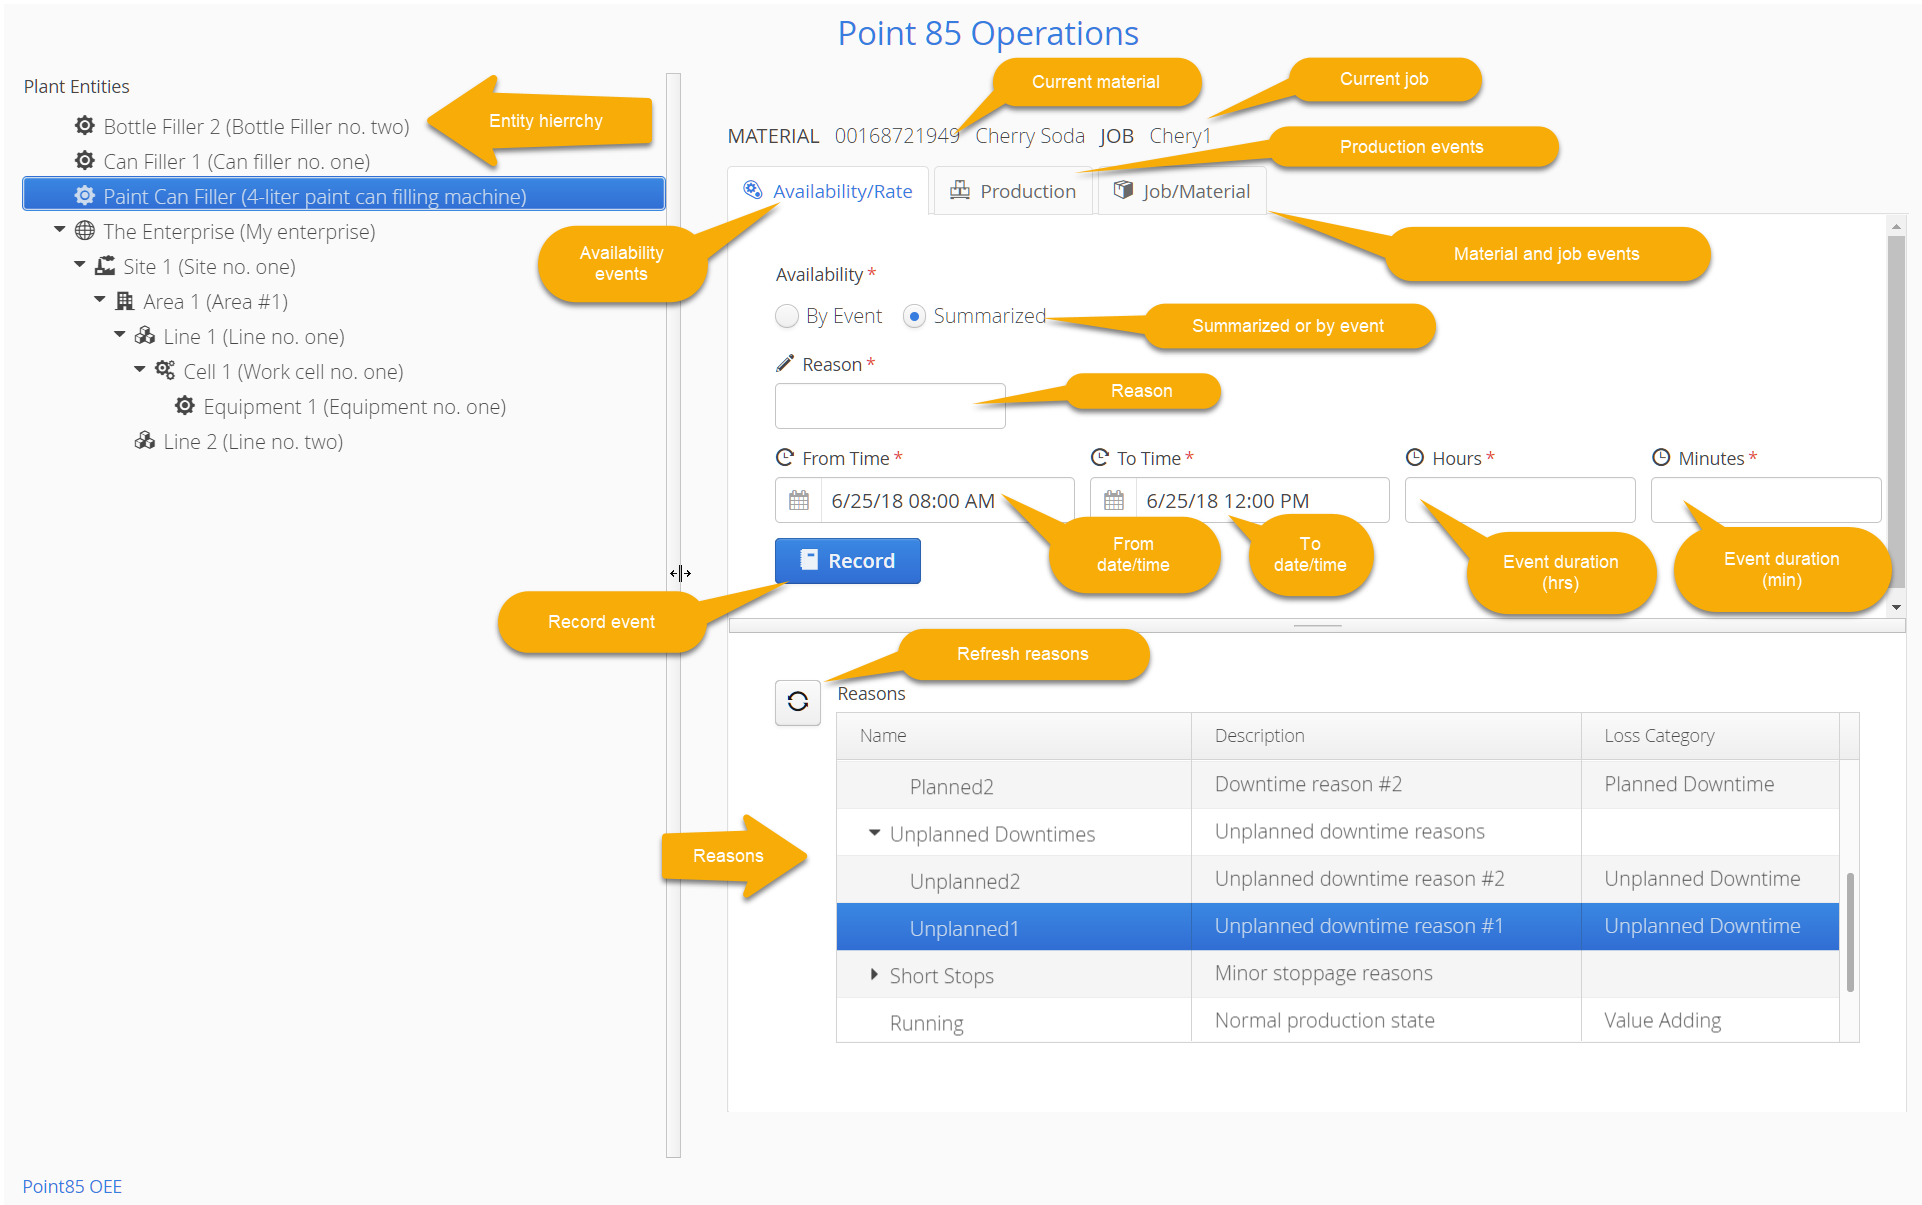
The Operator web application is browser-based and allows a user to enter availability, performance, production, material change and job events. The events can be recorded in chronological order as they happened or in summary form over a period of time by duration of event.
For example, the screen for entering summarized availability is:
The Operator iOS and Android mobile applications allow a user to enter availability, performance, production, material change and job events. The events can be recorded in chronological order as they happened or in summary form over a period of time by duration of event. On Google Play Store and Apple App Store, search for "Point85".
For example, the screen for entering summarized availability is:

Desktop applications are also available for Linux, Windows and macOS. For macOS search the Apple App Store for "Point85". The Linux, Windows and Chrome/Edge apps are available for download at the OEE Mobile project release page: https://github.com/point85/OEE-Mobile/releases.
A demonstration HTTP server is running a Collector at IP address 52.37.56.187 on port 8182 and can be used for the operator apps.
All applications with user-visible text use resource bundles for localization. The locale is the default locale of the desktop or web server machine. Each application has two default resource bundles, one for text named (app name)Lang.properties and one for errors/exceptions named (app name)Error.properties with US English text.
The Java Persistence 2.2 API (JPA) as implemented by the Hibernate ORM framework together with the Hikari connection pool is used to persist OEE information to the database. Hibernate and JPA abstract-away database specific aspects of inserting, updating, reading and deleting records in the tables. The API is designed to work with any relational database supported by Hibernate.
Version 3.11.0 adds a REST API for materials, reasons, plant entities and equipment. Please see the Release Notes.txt file for release history and additional details.
The desktop applications are packaged in the oee-.zip file in the latest Git release link at https://github.com/point85/OEE-Designer/releases. Download the oee-.zip file and expand the archive into a folder of your choice. Next, download the Point85 OEE Getting Started Guide and follow instructions in that document. Additional information may be found in the Point85 OEE User Guide.
- Java FX applications: https://github.com/point85/OEE-Designer
- OEE domain library: https://github.com/point85/OEE-Domain
- Collector service: https://github.com/point85/OEE-Collector
- Web application: https://github.com/point85/OEE-Operations
- Flutter applications: https://github.com/point85/OEE-Mobile