ESFET is a tool you can use to evaluate the efficiency, fairness and stability of adaptation rules implemented in the dash.js player.
The tool is based on the dash.js player(1), an open source dash client from the DASH Industry Forum (DASH-IF). Besides the dash player provided by the DASH-IF, ESFET has five main components as shown in figure above. Each component runs on a Docker container. The first one (2) uses Nginx as both an HTTP server to serve media content to the DASH player and a reverse proxy to redirect player's requests with playback data to the tool's backend component (3).
Before each request the player asks the adaptation mechanism if it must increase, decrease or keep the current representation and then sends the playback data, meaning the new representation, bitrate and current timestamp to the ESFET backend. The backend then adds the client id to the data set and stores this data in a time series database (4).
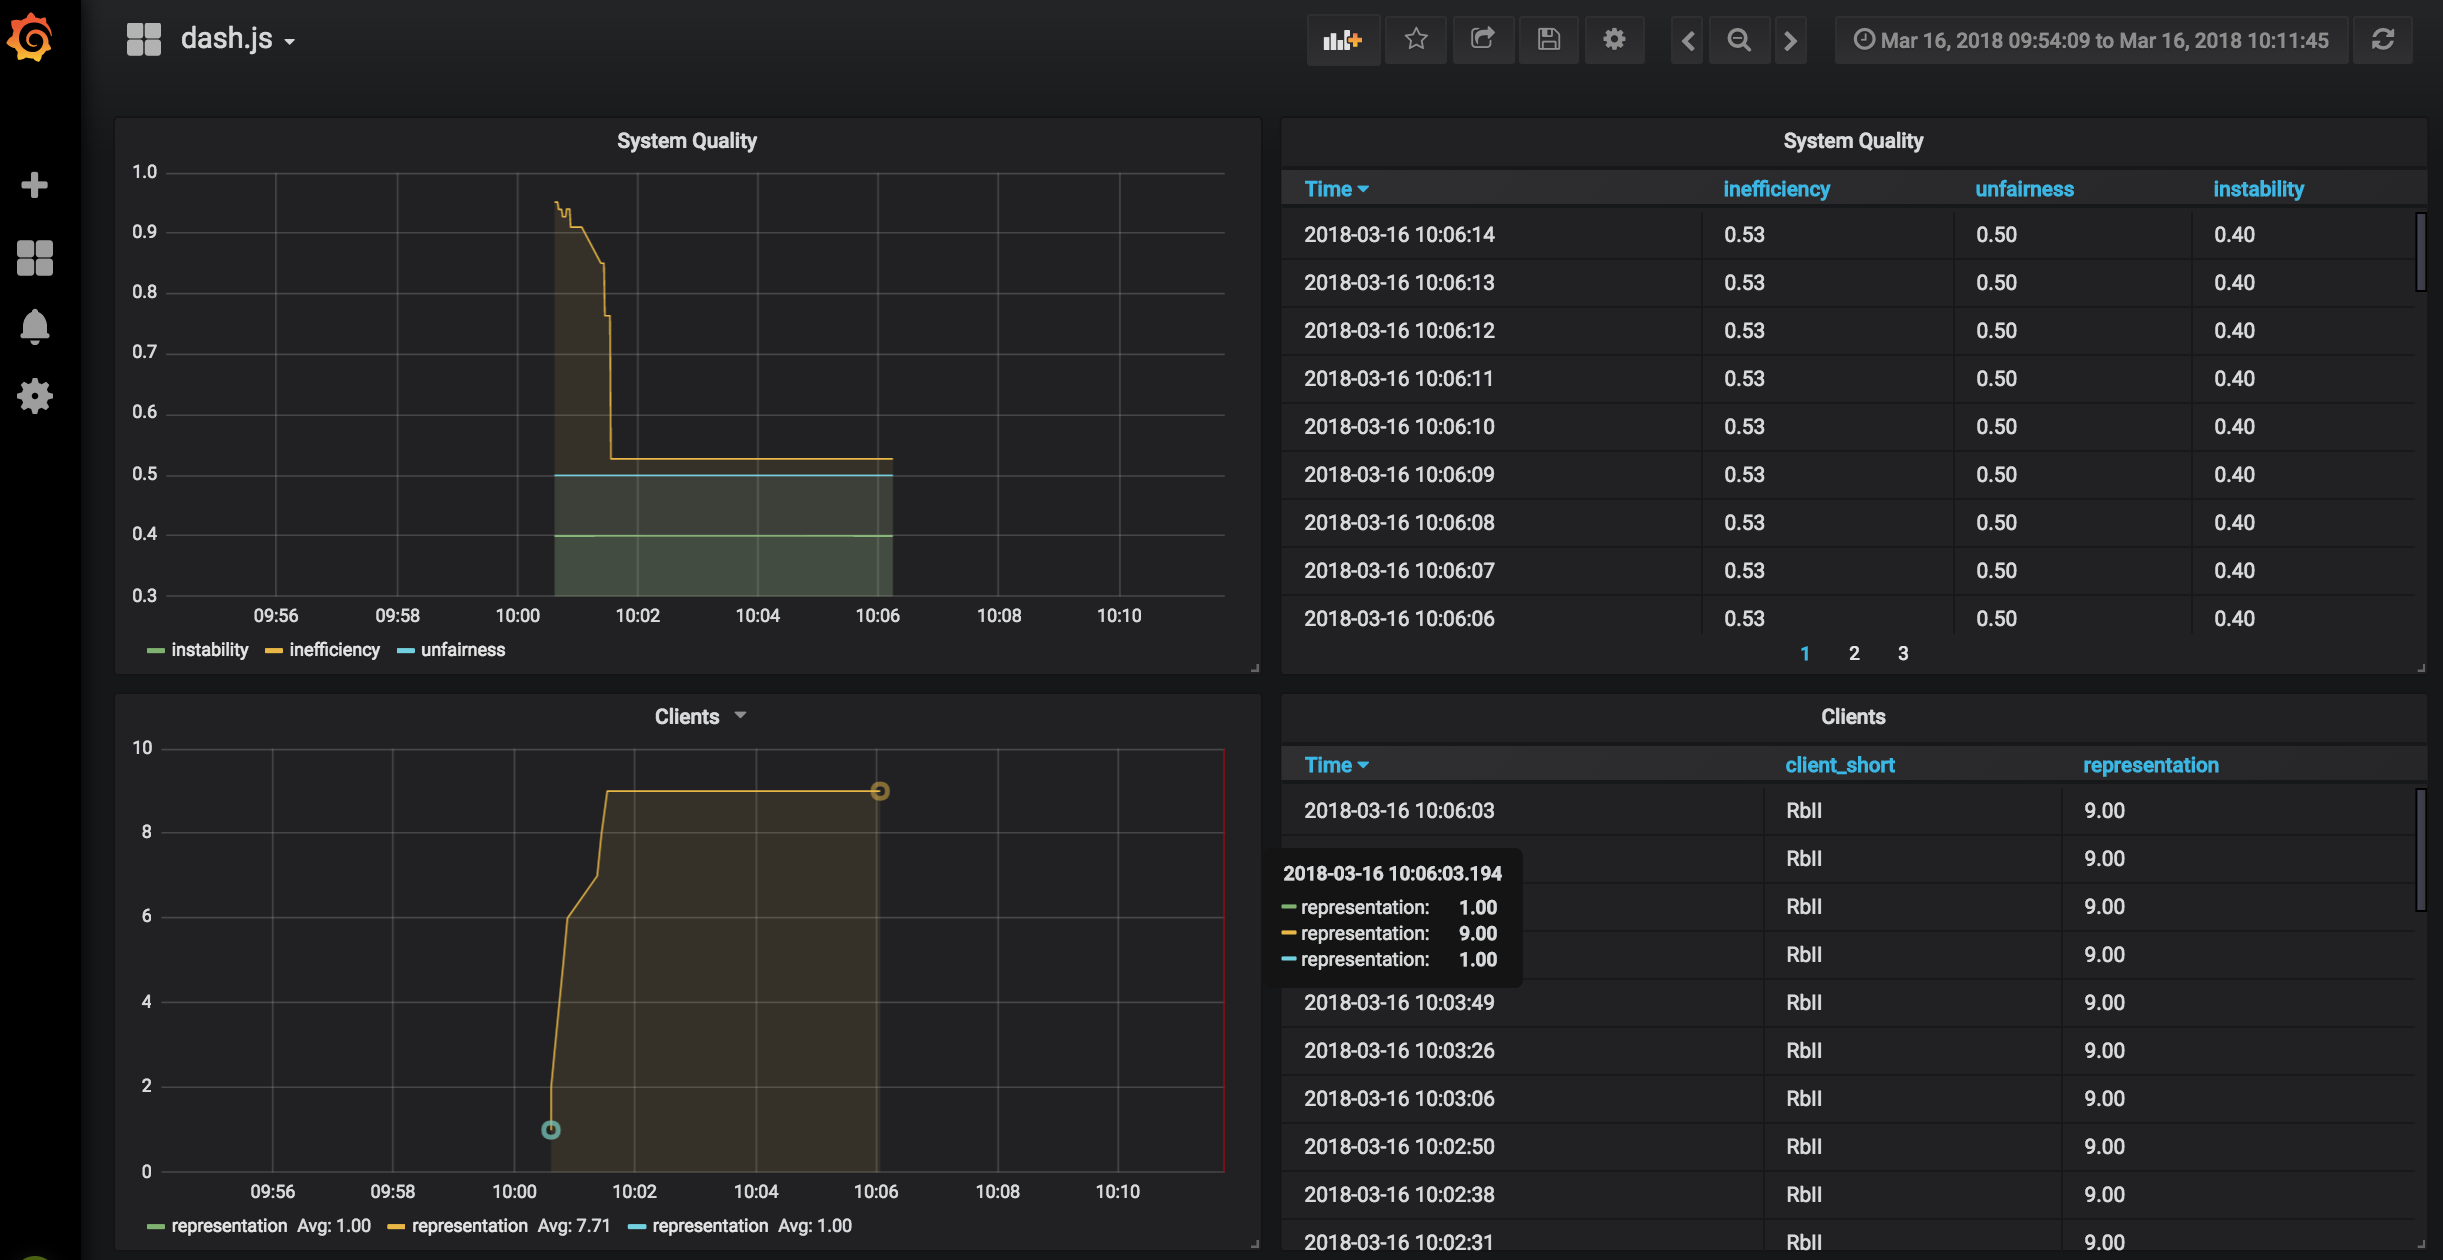
The metrics engine component (5) runs continuously in the background aggregating the quality metrics for all the players at each point in time. The last component is a Dashboard(6) that reads the data from the time series database and combines them in charts that can be used to evaluate the adaptation method performance.
- Requirements
The proposed solution is based on containers so you will need to install docker in your machine.
Docker: https://www.docker.com/community-edition
Docker Compose: https://docs.docker.com/compose/install/
- Step by step
- Build and run the containers
cd docker
docker-compose up --build -d
- Configure grafana
Access the dashboard: https://host_name:3000 (admin/admin)
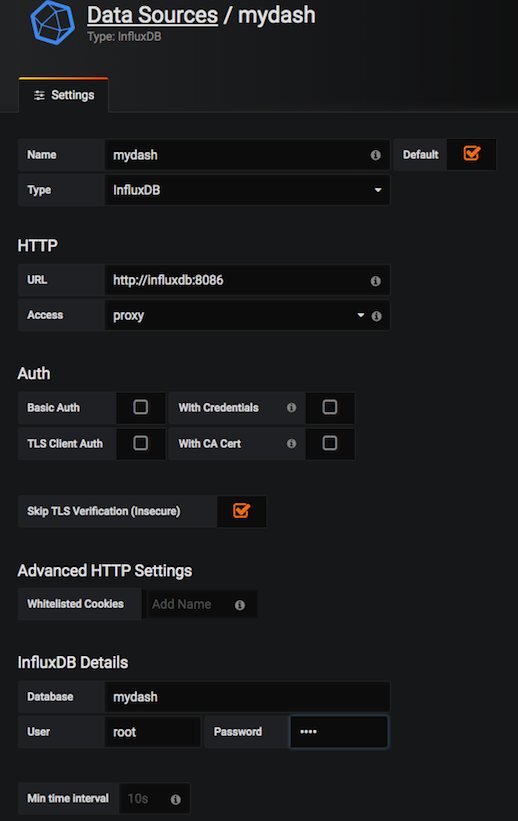
If it's the first time accessing grafana, follow the tool's step-by-step to point the database to influxdb as shown in the following screen (influxdb user/password: root/root).
- Import the dashboard
In the Grafana screen select Create then click on Import.
Select the file ./config/dashboard.json to reuse a dashboard already created, then select the database (mydash) created in step 2 as shown in the following picture:
After importing the dashboard you will see it in Grafana, probably there will be no data in the charts because its the first time you use it.
- Access the player (https://host_name/) then load and play the demo video to see the metrics in your dashboard.
More information:
- to stop the containers: docker-compose down
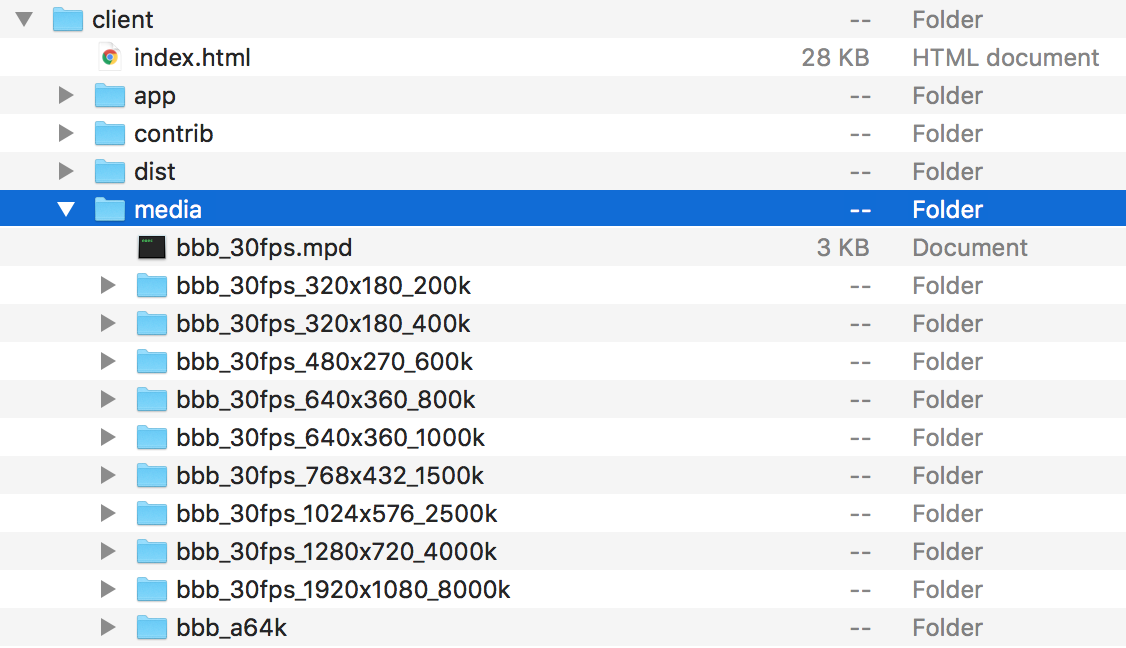
If you want to run your tests using local media files you just need to store DASH manifest and the media files in the ./client/media folder, as can be seen here:
Then change url of the manifest file in this part of the ./client/app/main.js source file:
Here is a sample of Big Buck Bunny files you can use to do your tests locally:
https://www.dropbox.com/s/63ucebayyi3bbsz/bbb_30fps.zip
If you want to create your own adaptation rule, it's important to know that ./client folder has a copy of the dash.js player which you can use to test you adaptation method. In order to create new adaptation rules you need to add them into ./client/app/rules folder. In order to define which adaptation method the client will use you just need to define it into ./client/index.html file as in this example where I'm defining the Smoothed Throughput Method:


