This repository contains the analysis scripts to reproduce the results presented in our PuG 2024 poster contribution entitled "Phenome-wide association study of pain- and anxiety-linked endocannabinoid gene variation FAAH C385A". The individual-level data incorporated in this work have been obtained from the UK Biobank resource under application number 423032.
code - contains preparation files, functions, and analysis scripts
envs - contains conda .yml files to recreate our environments
results - contains result files (individual-level results are not provided due to data privacy policies)
run.sh - main analysis file for FAAH C385A phenome-wide associations
Analyses were run on Debian GNU/Linux 11 (bullseye) with kernel version 5.10.0-23-amd64. Scripts to install the required bioinformatic tools are provided in folder code/prepare/. We recommend mamba for installing conda environments. The following tools are required to reproduce our results:
Navigate to your preferred local folder and clone this repository via the following commands:
git clone https://github.com/pjawinski/ukb_faah
cd ukb_faah
- please see the primary analysis file run.sh for a step-by-step guide through the individual analysis procedures.
 Fig. 1 Results of the phenome-wide association analysis for FAAH C385A in up to 340,863 unrelated white-British ancestry UK Biobank individuals. The solid horizontal line indicates the Bonferroni-adjusted level of significance (p<2.3e-06), correcting for 21,624 tested associations.
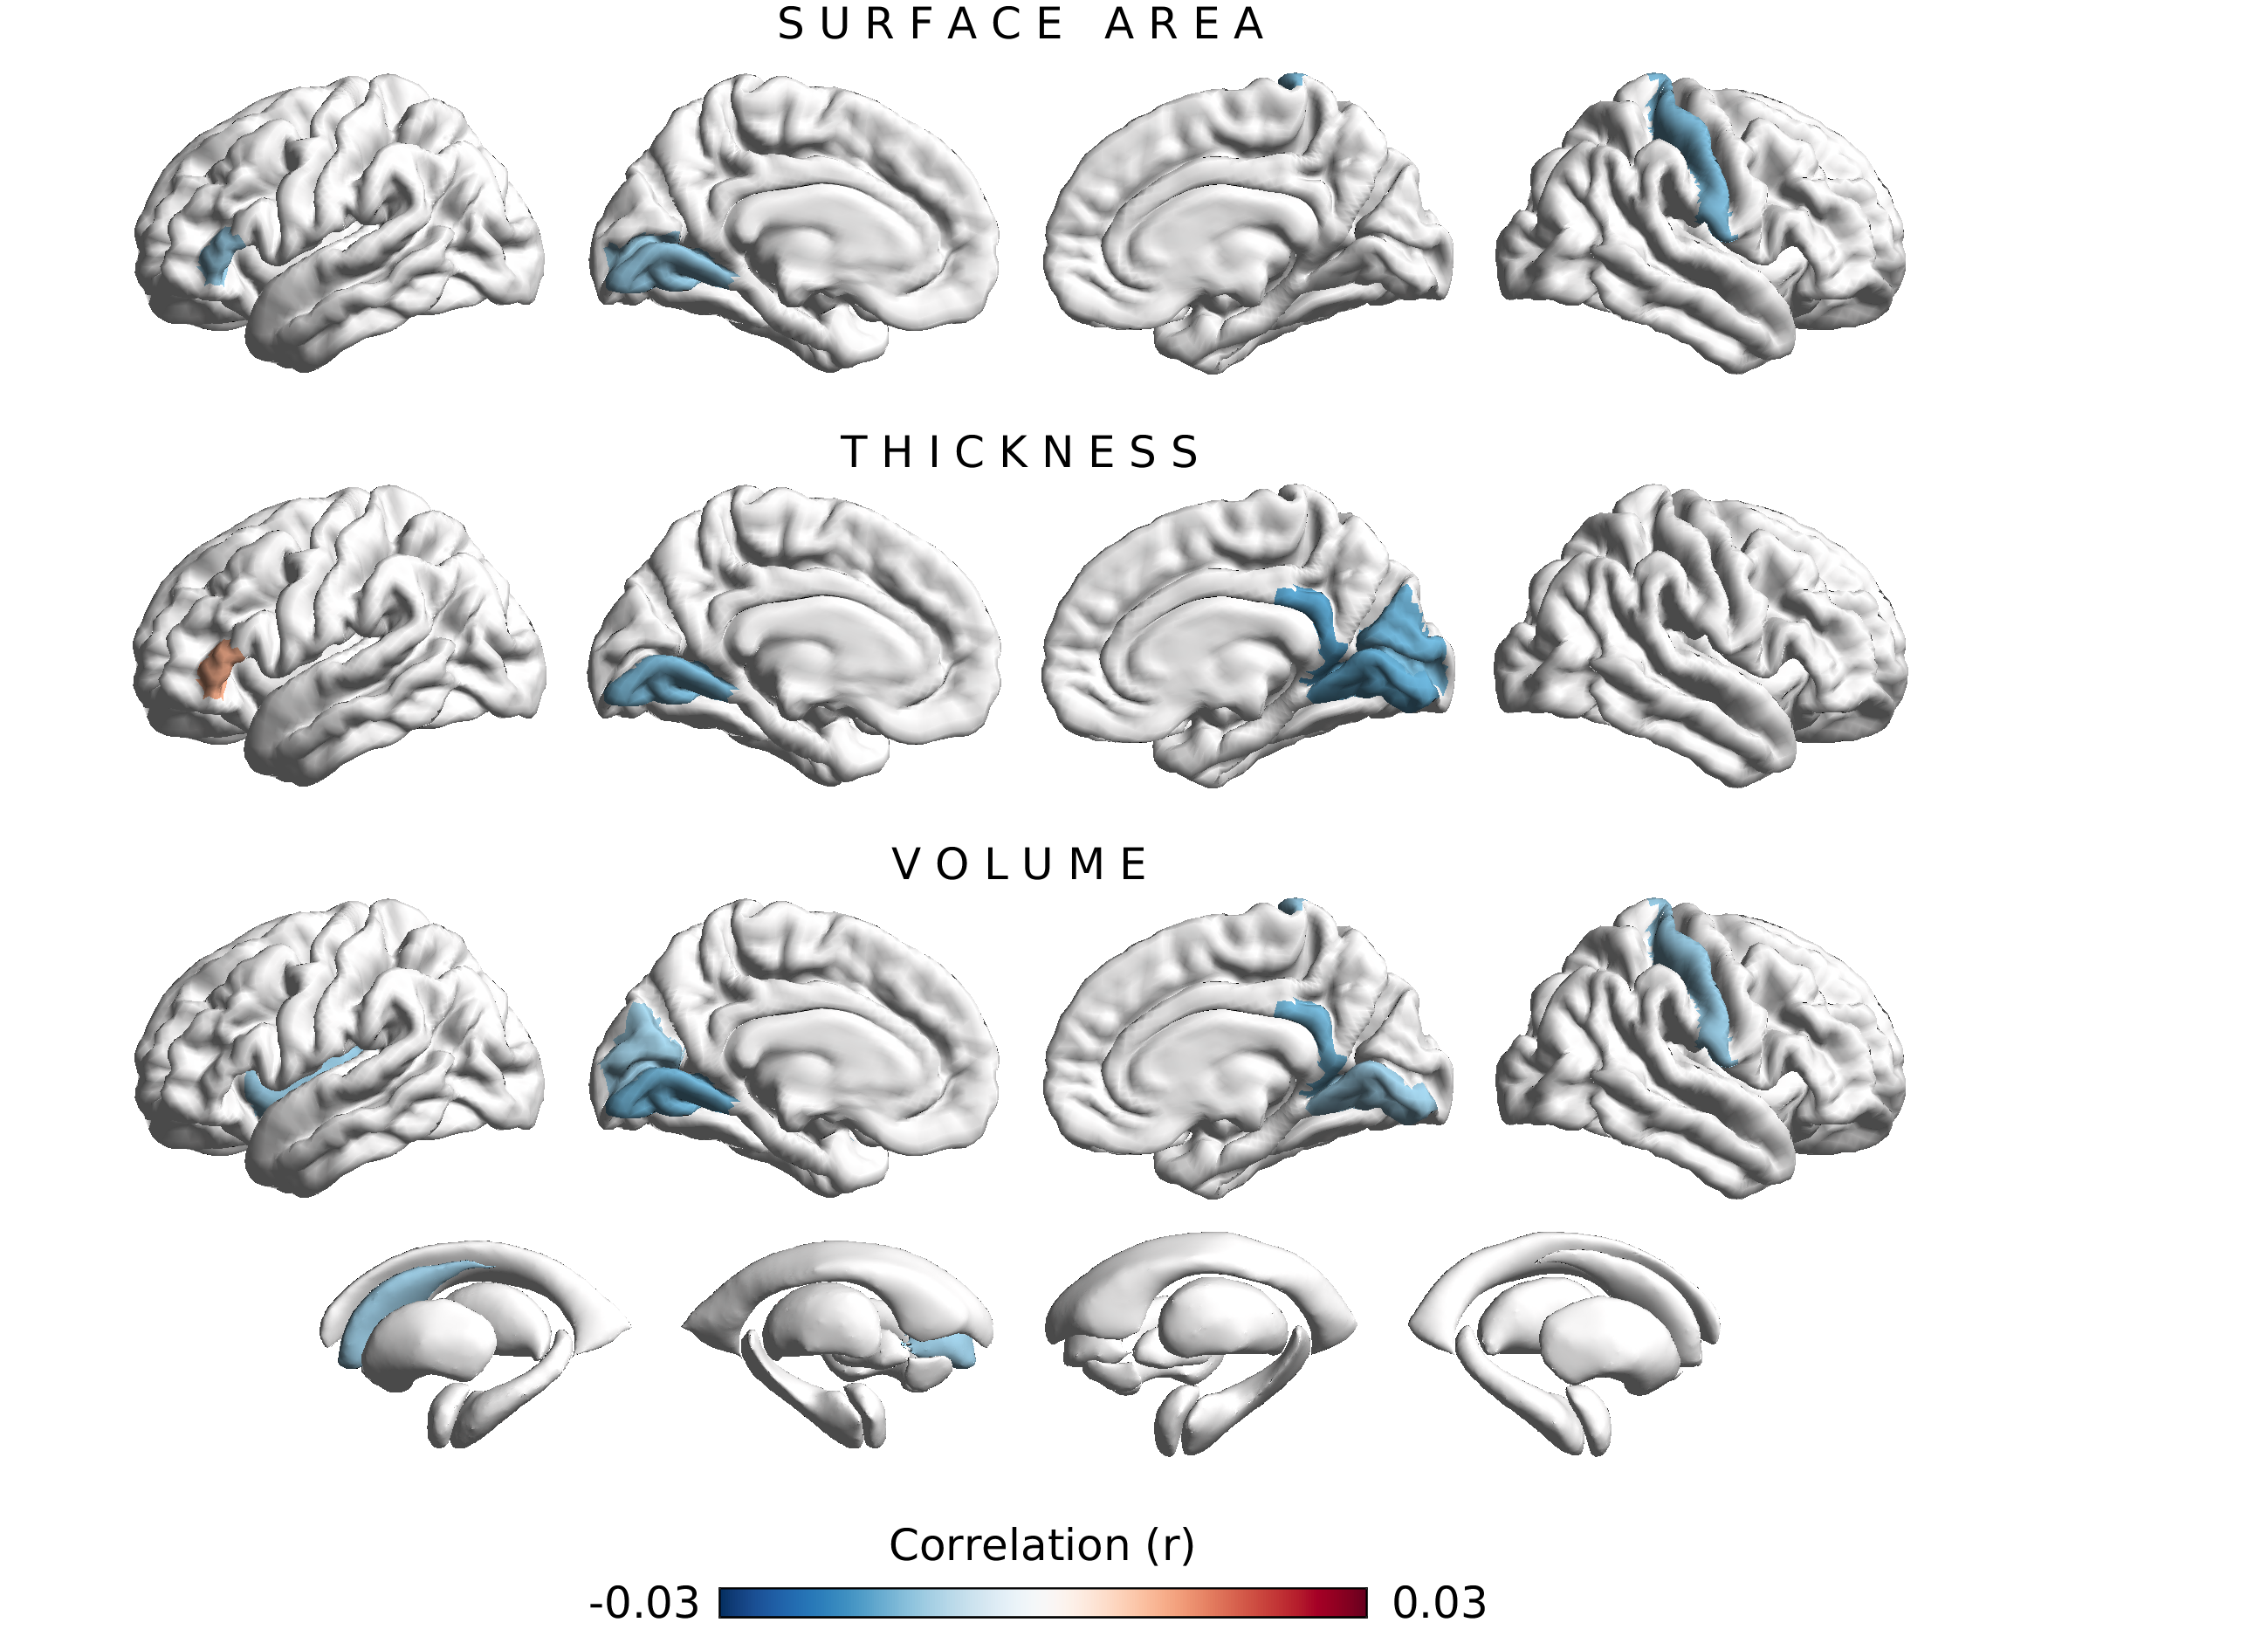
Fig. 2 Associations between FAAH C385A and 220 Freesurfer brain structure variables. Colors reflect the strength and direction of partial product-moment correlations (sex, age, age2, sex x age, sex x age2, assessment center, genotyping array, and the first 10 genetic principal components served as covariates). Brain regions with associations achieving nominal significance (p < 0.05) are colored in red and blue. The effect allele is 'A'.
 Fig. 3 Quantile-quantile plots showing the observed p-values from the phenome-scan vs. the expected p-values under the null hypothesis of no effect. Left-deflations from the solid diagonal line are interpreted as 'stronger evidence than expected under the null'.
Fig. 4 Quantile-quantile plots showing the observed p-values from the phenome-scan vs. the expected p-values under the null hypothesis of no effect for category 'Anxiety and Pain'. Left-deflations from the solid diagonal line are interpreted as 'stronger evidence than expected under the null'.

