![]() TBSP: Trajectory Inference Based on SNP information.
TBSP: Trajectory Inference Based on SNP information.
- INTRODUCTION
- PREREQUISITES
- INSTALLATION
- USAGE
- INPUTS AND PRE-PROCESSINGS
- OUTPUTS
- EXAMPLES
- INTEGRATION WITH EXISTING METHODS

-
python (python 2 and python 3 are both supported)
It was installed by default for most Linux distribution and MAC.
If not, please check https://www.python.org/downloads/ for installation instructions. -
Python packages dependencies:
-- scikit-learn
-- scipy
-- numpy
-- matplotlib
-- networkx
-- pyBigWig
-- Biopython
-- decorator
Note that networkx might not work well with some versions of decorator. In that case, consider upgrading or downgrading decorator. For example, "pip install decorator==5.0.7" should solve the problem.
-
other dependencies:
-- python-dev (python2) or python3-dev (python3)
It can be installed easily for most linux distributions. For example, debian/ubuntu:sudo apt-get install python-dev or sudo apt-get install python3-devFor Macos, it was installed by default. The python setup.py script (or pip) will try to install these packages automatically. However, please install them manually if, by any reason, the automatic installation fails.
-
Platform:
Macos and Linux verified. For windows, the dependent pyBigWig package is not available.
However, the Docker version of TBSP is available for all platforms.
There are 4 options to install tbsp.
-
Option 1: setup.py script installation from download directory
cd to the downloaded scdiff package root directory$cd tbsprun python setup to install
$python setup.py installMacOS or Linux users might need the sudo/root access to install. Users without the root access can install the package using the pip/easy_install with a --user parameter (install python libraries without root).
$sudo python setup.py installuse python3 instead of python in the above commands to install if using python3.
-
Option 2: pip installation from Github:
python 2:
$sudo pip install --trusted-host github.com --upgrade http:https://github.com/phoenixding/tbsp/zipball/masterpython 3:
$sudo pip3 install --trusted-host github.com --upgrade http:https://github.com/phoenixding/tbsp/zipball/master -
Option 3: pip installation from PyPI:
python 2:
$sudo pip install --trusted-host pypi.org --trusted-host files.pythonhosted.org --upgrade tbsppython 3:
$sudo pip3 install --trusted-host pypi.org --trusted-host files.pythonhosted.org --upgrade tbspThe above pip installation options should be working for Linux and MacOS systems.
For MacOS users, it's recommended to use python3 installation. The default python2 in MacOS has some compatibility issues with a few dependent libraries. The users would have to install their own version of python2 (e.g. via Anocanda) if they prefer to use python2 in MacOS. -
Option 4: Installation as Docker images (Most robust way, no dependencies on all platforms)
Users would need to install Docker to run the tbsp image. Please refer to Docker installation page for detailed installation instructions.To install tbsp image:
$sudo docker pull johnding1986/tbspTo run tbsp image :
$sudo docker run -v /PATH_TO_FILE_DIRECTORY:/tbsp johnding1986/tbspUsers would need to use the -v command to mount local directories.
usage: tbsp.py [-h] -i IVCF [-b [IBW]] [-k KCLUSTER] [-l [CELL_LABEL]] -o
               OUTPUT [--cutl CUTL] [--cuth CUTH] [--greedycut GREEDYCUT]
               [--cutc CUTC] [--maxiter MAXITER]

optional arguments:
  -h, --help            show this help message and exit
  -i IVCF, --ivcf IVCF  Required,directory with all input .vcf files. This
                        specifies the directory of SNP files (.vcf) for the
                        cells (one .vcf file for each cell). These .vcf files
                        can be obtained using the provided bam2vcf script or
                        other RNA-seq variant calling pipelines preferred by
                        the users.
  -b [IBW], --ibw [IBW]
                        Optional,directory with all input bigwig (.bw) files
                        with the information about the number of aligned reads
                        at each genomic position. These bigwig files are used
                        to filter the SNPs, which are redundant to expression
                        information.
  -k KCLUSTER, --kcluster KCLUSTER
                        Optional, number of clusters, Integer. If not
                        specified, the program will choose the k with best
                        silhouette score.
  -l [CELL_LABEL], --cell_label [CELL_LABEL]
                        Optional, labels for the cells. This is used only to
                        annotate the cells with known information, not used
                        for building the model.
  -o OUTPUT, --output OUTPUT
                        Required,output directory
  --cutl CUTL           Optional, lower bound cutoff to remove potential false
                        positive SNPs, default=0.1
  --cuth CUTH           Optional, upper bound cutoff to remove baseline SNPs,
                        which are common in most cells, default=0.8
  --greedycut GREEDYCUT
                        Optional, the stopping cutoff for the greedy search of
                        candidate SNPs, default=0.05 (less than 0.05 score
                        improvement). A larger cutoff means less strict SNP
                        candidate search
  --cutc CUTC           Optional, convergence cutoff, a smaller cutoff
                        represents a stricter convergence
                        criterion,default=0.001
  --maxiter MAXITER     Optional, the maximal number of iterations allowed
-
-i:
Required input, this specifies the directory of all SNP(.vcf) files. We recommend using GATK RNA-seq variant calling pipeline to call the vcfs from .bam (mapped reads) files. Users are also allowed to use the SNPs (.vcfs) identified by programs of their preferences (e.g. freebayes).
We also provied a GATK based SNP calling script (bam2vcf.py) at bam2vcf, which automates the SNP calling procedure from .bam files to .vcf files. Please use "python bam2vcf.py --help" to see the script usage. -
-b:
Optional input, this specifies the directory of all bigwig (.bw) files. We provided the script bam2bw.py under bam2bw directory to convert the bam files to bigwig files. This files are used to filter SNPs, potentially redundant to expression. -
-l:
Optional input, this specifies the labels for the cells. File format (tab-delimited):
cell1	label1
cell2	label2
These cell labels are only used to annotate the cells in the trajectory. The other optional parameters are specified above.
-
GroupCells.txt:
A text file, which describes the cells in each cluster.Format:
Cell_ID Cluster_ID SRR1931024 cluter:0 SRR1930999 cluter:0 SRR1930977 cluter:0 SRR1931041 cluter:0 SRR1931012 cluter:0 SRR1930945 cluter:0 SRR1931003 cluter:0 SRR1931002 cluter:0 SRR1931004 cluter:0 .. -
SNP_matrix.tsv:
The SNP matrix for all the cells. Row: SNPs Column: Cells Value: Binary (0/1), which indicates whther the SNP is included in the cell.SNP SRR1931024 SRR1930999 SRR1930977 SRR1931041 SRR1931012 SRR1930945 SRR1931003 SRR1931002 SRR1931004 SRR1931009 SRR1931031 SRR1930994 SRR1930995 SRR1930992 chr18,31438715 0 0 0 0 0 0 0 0 0 0 0 0 0 0 chr13,99421798 0 0 0 0 0 0 0 0 0 0 0 0 0 0 chr18,48047497 0 0 0 0 0 0 0 0 0 0 0 0 0 0 chr1,98777608 0 1 1 1 0 1 1 0 0 0 0 0 1 0 chr12,75631154 0 0 0 0 0 0 0 0 0 0 0 0 0 0 chr2,80837890 0 0 0 0 0 0 0 0 0 0 0 0 0 0 chr10,56497362 1 0 0 1 0 1 1 0 1 1 0 0 1 0 chr9,42254324 0 0 0 0 0 0 0 0 0 0 1 0 1 0 chr10,56497777 0 0 0 0 0 0 1 1 0 1 0 0 0 1 chr9,42254361 0 0 0 0 0 0 0 0 0 0 1 0 1 0 chr18,28188943 0 1 1 1 1 1 1 1 0 0 1 1 0 1 chr14,46775753 1 0 0 1 0 1 0 1 0 1 1 0 1 1 chr4,141015053 0 0 0 1 0 0 0 0 0 0 0 0 0 0 chr6,3201327 0 0 1 0 0 0 1 1 1 0 0 0 0 0 chr2,152737258 0 1 0 0 1 0 1 1 0 1 1 0 1 0 chr4,150417174 1 0 0 0 1 0 1 0 1 0 0 1 0 0 chr6,136872487 0 1 1 1 0 0 1 1 0 0 1 0 0 0 chr8,41341106 1 1 1 0 1 1 1 1 1 0 1 1 0 1 chr17,72849135 1 1 1 1 0 0 1 1 1 1 1 1 1 1 chr17,6132279 0 0 0 0 0 0 0 0 0 0 0 0 0 0 chr8,102864840 0 0 0 0 0 0 0 0 0 0 0 0 0 0 chr13,74406968 1 1 1 1 0 1 1 1 1 1 1 0 1 1 chr11,45829261 0 1 1 0 0 1 1 0 0 1 0 0 0 0 chr8,54522180 0 1 1 0 0 1 0 0 0 0 0 0 0 0 chr9,67023057 0 1 1 0 1 1 0 1 0 0 1 1 1 1 chr10,128076602 1 1 1 1 1 0 1 1 1 1 1 1 1 1 chr6,4540674 0 1 1 1 1 1 1 0 1 1 1 0 1 1 chr17,70996716 1 1 1 1 0 1 1 1 1 1 1 1 1 1 chr5,115345677 0 1 1 1 1 1 0 1 0 0 0 1 1 1 chr2,136782052 0 0 0 0 0 0 0 0 0 0 0 0 0 0 -
SNP_matrix.jpg:
The SNP matrix in jpg image.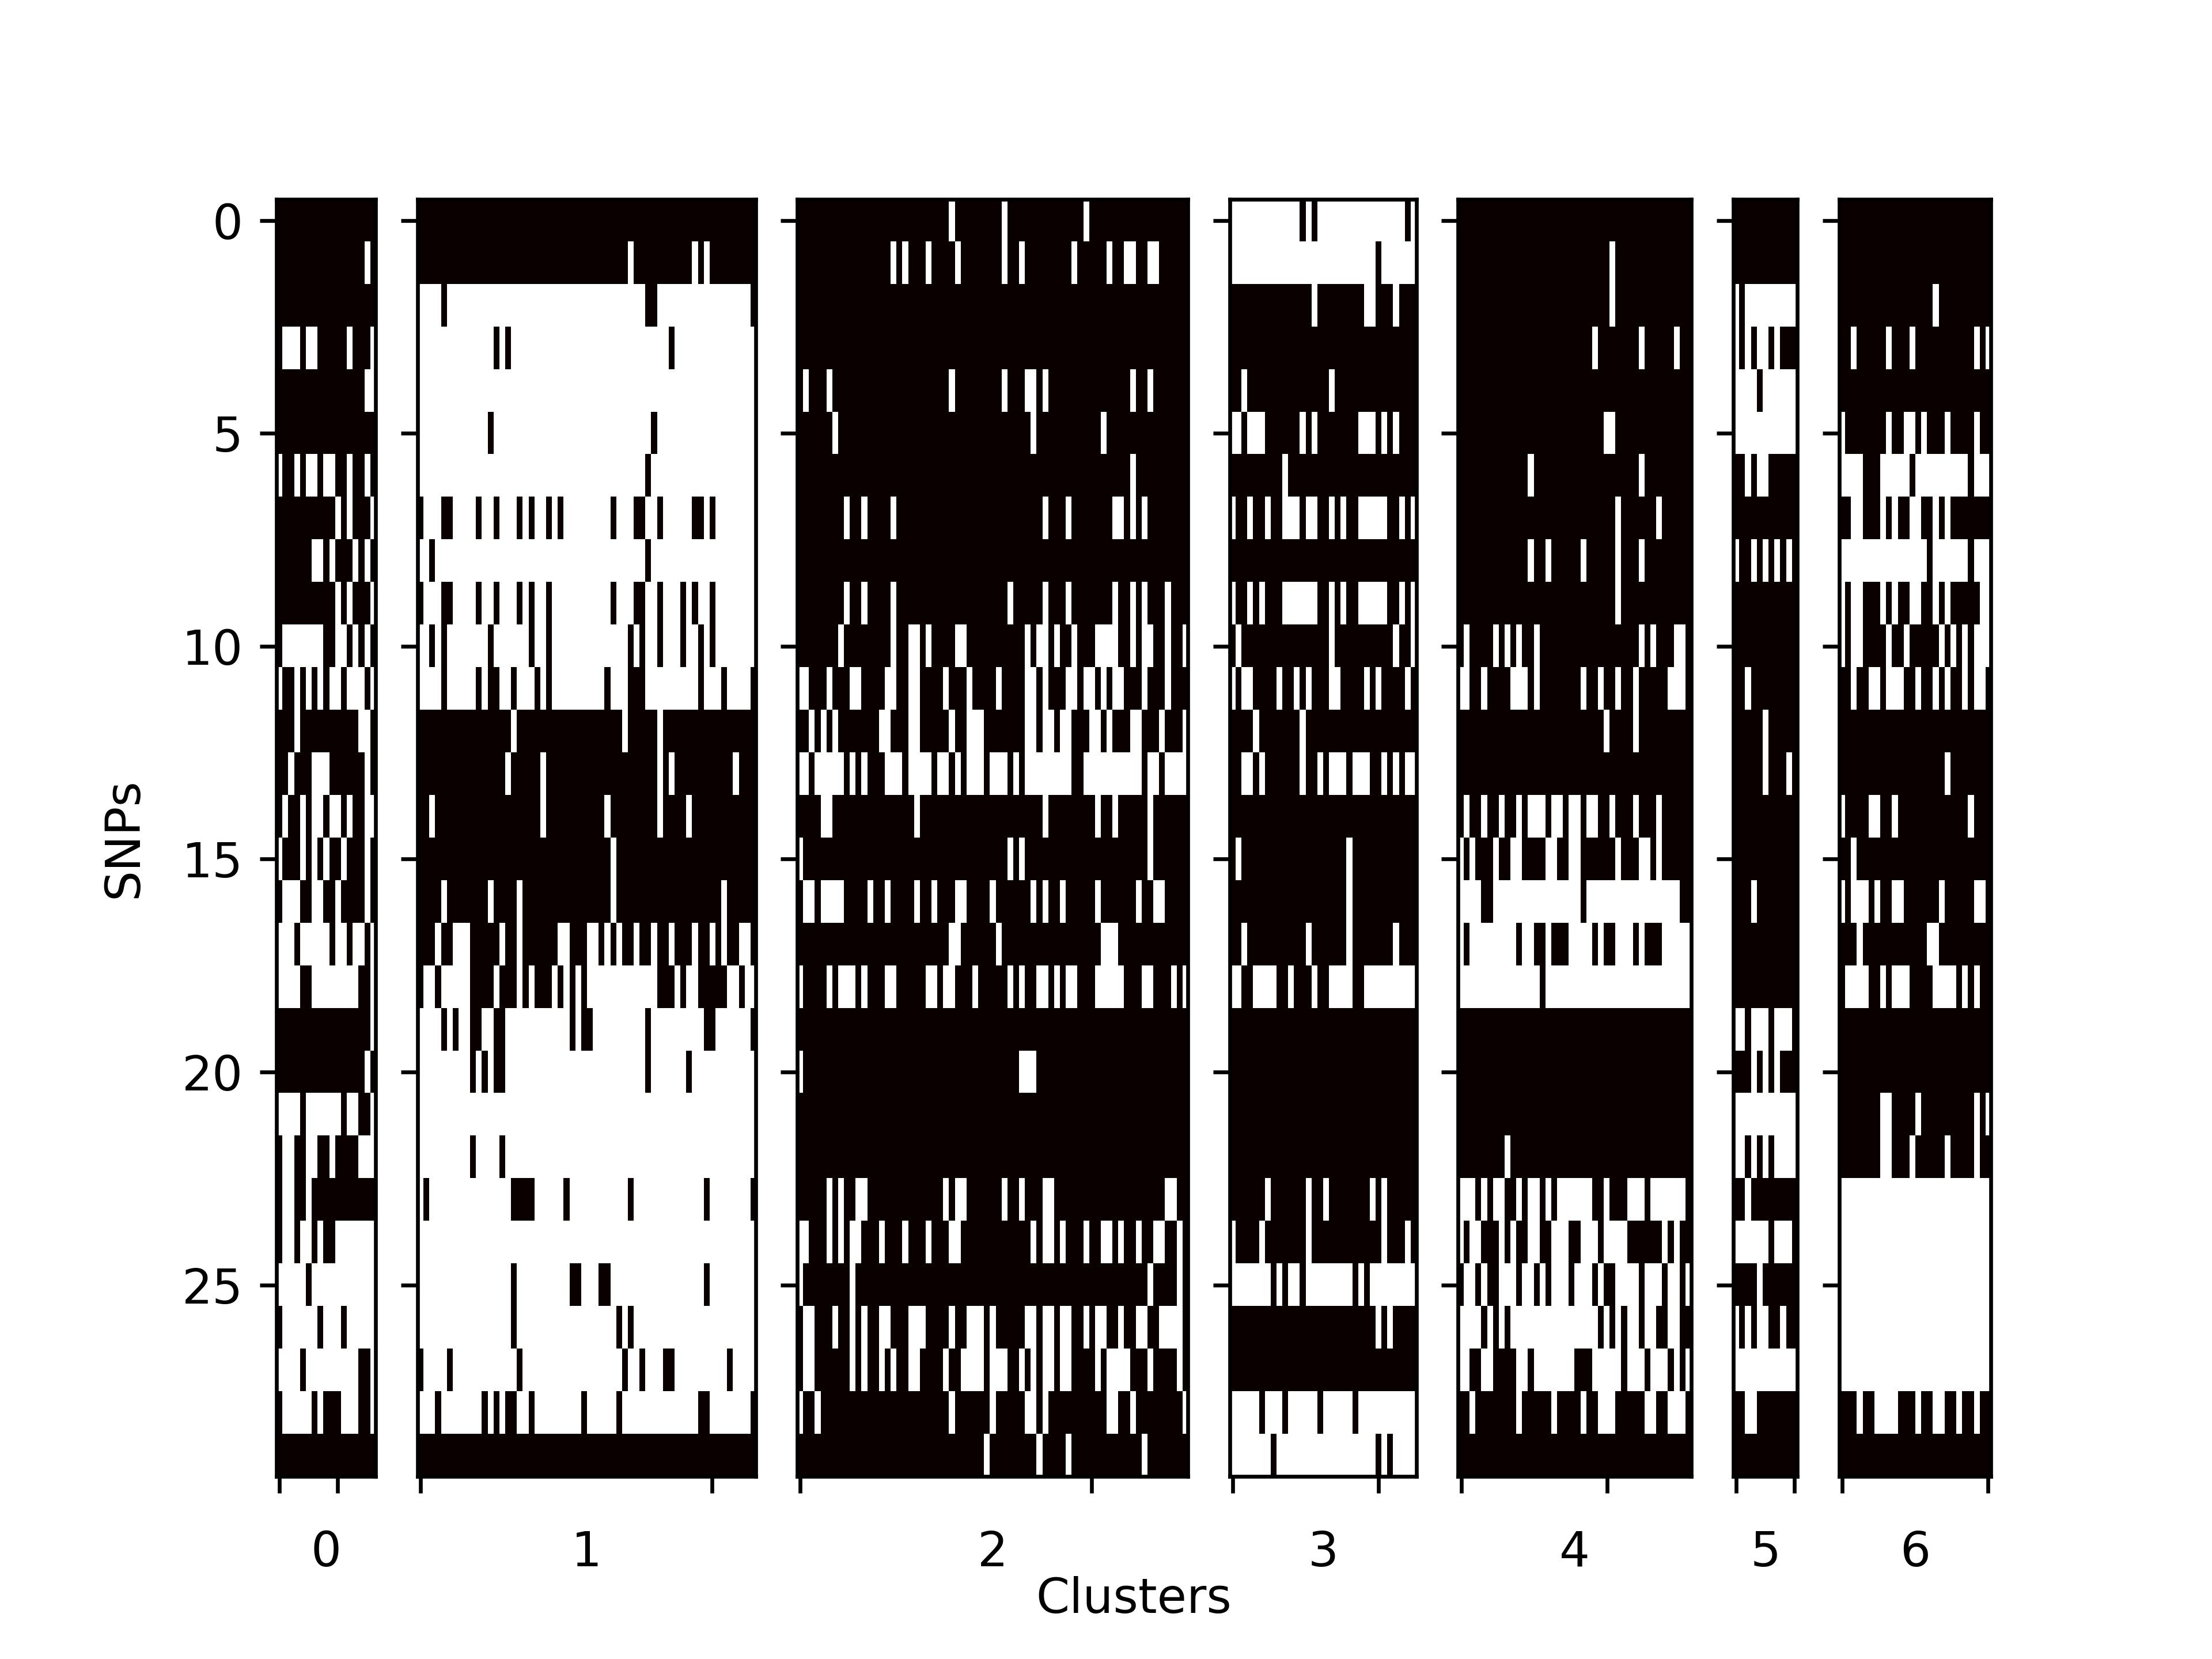
-
Trajectory.dat:
 4	(-0.6168642633606496, -0.29504774213348317)
 Inner4	(-0.01784069226314263, -0.19237987266625067)
 2	(-1.0, 0.1907479586411944)
 Inner5	(0.526511663382742, -0.048432121394020027)
 6	(0.6167190582080249, -0.21090119687699874)
 0	(-0.02807716265846153, -0.3564777531262085)
 3	(-0.7661682030072015, 0.29873283057457906)
 Inner3	(-0.4986251141938113, -0.13657170781011707)
 Inner1	(0.785885623794461, 0.14046537917538365)
 5	(0.8477737598817315, 0.3307492805568145)
 1	(0.9509945159224894, 0.1308847244003101)
 Inner2	(-0.8003091857061821, 0.14823022065879607)
First column: cluster id
second column: coordinates
TBSP trajectories were presented in the form of uprooted phylogenetic tree structure. The coordinates for each node(cluster) are given by the above Trajectory.dat result. With the coordinates, users can able to compute the length for each of the branches in the tree. User can setup a user-defined distance cutoff to find out major divergence events. An example cutoff can be set as top 25% of all branch lengths. -
Trajectory.jpg:
Graph representation of Trajectory.dat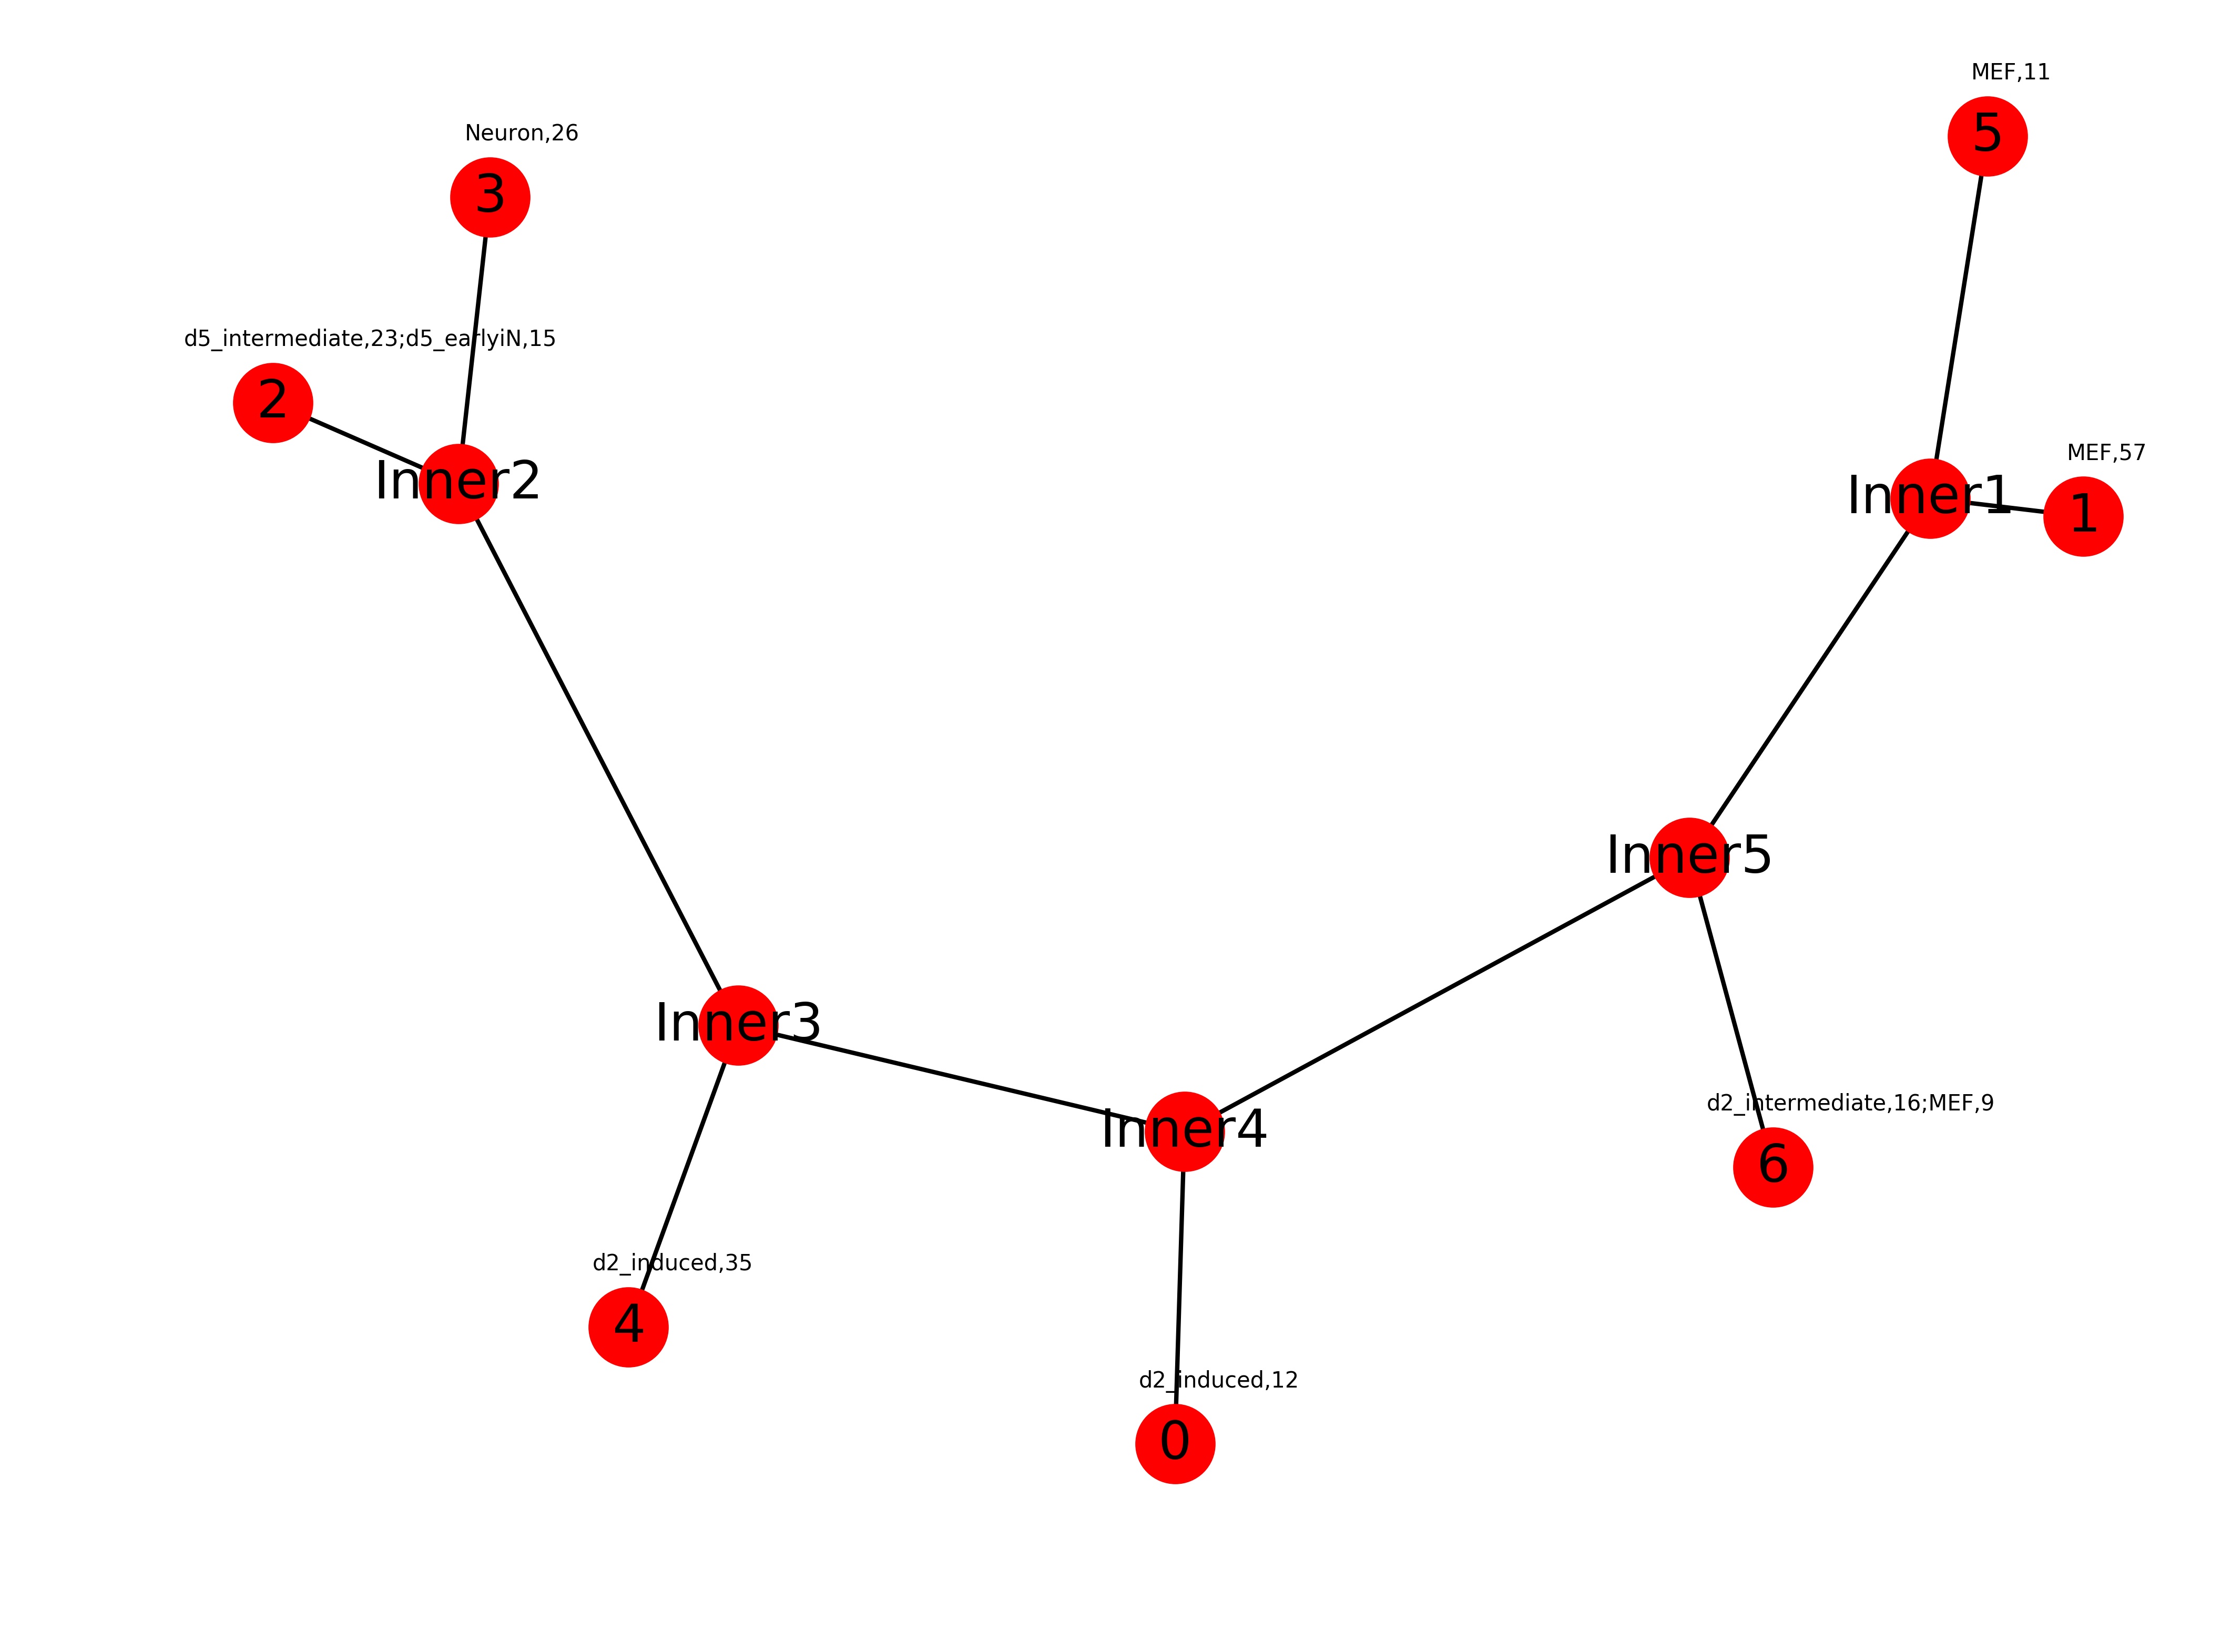


TBSP model provides a SNP MATRIX, which presents the SNP signature vector for each of the cells in the dataset. As we show in the paper, such SNP MATRIX is very informative for trajectory inference. The cell trajectories can be improved by integrating SNP matrix with expression data.
There are many ways to utilize the SNP matrix information, here we used a simple example to demonstrate the integration.
MONOCLE 2 is used widely for trajectory inference and has very good performance. However, it's based on only single-cell expression data and thus may be limited in many scenarios.
For example, the following is the Monocle 2 results on a 2016 neuron reprogramming single-cell dataset (https://www.ncbi.nlm.nih.gov/pubmed/27281220)
 . The processed expression data can be found in the integration_example directory.
(1) In the above results, we observe that d2_induced cells are in a separate branch in the bottom right while the neuron cells are on the branch at top right,
which contradicts the findings in the original study (Trajectory: MEF->d2_intermediate-> d2_induced-> d5_intermeidate-> d5_earlyiN->Neuron), in which the d2_induced cells are serving as the progenitors to the neuron cells.
(2) Running TBSP on the same dataset, we have obtained 36 SNPs as shown in integration_example/SNP_matrix.tsv.
(3) Combine the expression features and SNP features. There are multiple ways to combine these two types of information.
In the paper, we have discussed the strategy of refining the cell assignment in the expression-based trajectories using SNP information.
To be more specific, we integrate the SNP information to re-calculate the likelihood when re-assigning the cells to the trajectories.
Here, we discuss the most naive way to integrate SNP features with expression features: Merge the features directly.
For each cell, we put together the expression features (gene expression levels associated with cell) and SNP features (Binary SNP features 0/1 associated with the cell).
expression:
cell	gene1	gene2	gene3 ...
c1	1.6	2.4	3.8 ...
c2	2.8	4.8	6.4	...

+snp:
cell snp1	snp2	snp3
c1	1	0	1	...
c2	0	1	0	...

=>combined:
combined_info	gene1	gene2	gene3	snp1	snp2	snp3	...
c1	1.6	2.4	3.8	1	0	1	...
c2	2.8	4.8	6.5	0	1	0	...
Please note that number of the SNP features (usually in the range of 30-100) is much smaller than the number of genes (expression features). Therefore, to put more weights on the SNP features, we need to over-sample the SNP features. In the above example, we oversampled the SNPs for 100 times (=> 3600 SNP features). The combined dataset for the above example can be found in the integration_example directory.
(4) Run Monocle on the SNP-integrated dataset.

The above SNP-integrated Monocle results on the neuron reprogramming dataset perfectly matches the findings in the original study (MEF->d2_intermediate-> d2_induced-> d5_intermeidate-> d5_earlyiN->Neuron). d2_induced cells nows are the progenitors of the neuron cells. Also, d5 cells are coming later than d2 cells. Even using very simple integration strategy as shown above, the cell trajectories can be significantly improved.
-
Direct Run:
- Example inputs:
We provided example vcf files under examples folder. To run tbsp on the example data:
$tbsp -i examples/vcf_example -o example_out- Example outputs:
Example output files can be found under examples folder.
- Example inputs:
-
Docker Run:
We provided example vcf files under examples folder. To run docker tbsp on the example data:$sudo docker run -v ~/Download/examples:/tbsp johnding1986/tbsp -i /tbsp/vcf_example -o /tbsp/example_outwhere ~/Download/examples should be replaced by the parent directory of the folder of vcf files. The result files are the same as described above.
This software was developed by ZIV-system biology group @ Carnegie Mellon University.
Implemented by Jun Ding.
This software is under MIT license.
zivbj at cs.cmu.edu
jund at cs.cmu.edu