This exercise was designed to simiulate district-wide analysis for a local school board, with the aim of helping to make strategic decisions regarding future school budgets and priorities. To this end, the task required analyzing district-wide standardized test results through the use of Python Pandas. The original datasets provided math and reading scores for every student in the district, as well as information on the schools they attended. The first step was to aggregate the data to and evaluate trends in school performance.
The final evaluations included:
- a District Summary
- Summary statistics for each school
- Identification of the top & bottom performing schools (by passing rate)
- Math & Reading Scores by Grade Level
- Scores by School Spending
- Scores by School Size
- Scores by School Type
- Jupyter Notebook with all python code used in the analysis
- Initial data sets (2) for all schools and all students in the district (csv format)
- Images folder - png images of all the final dataframes, as shown below
The district summary provides a high-level snapshot of the district's key metrics, including:
- Total Schools
- Total Students
- Total Budget
- Average Math Score
- Average Reading Score
- % Passing Math
- % Passing Reading
- Overall Passing Rate (Average of the above two)
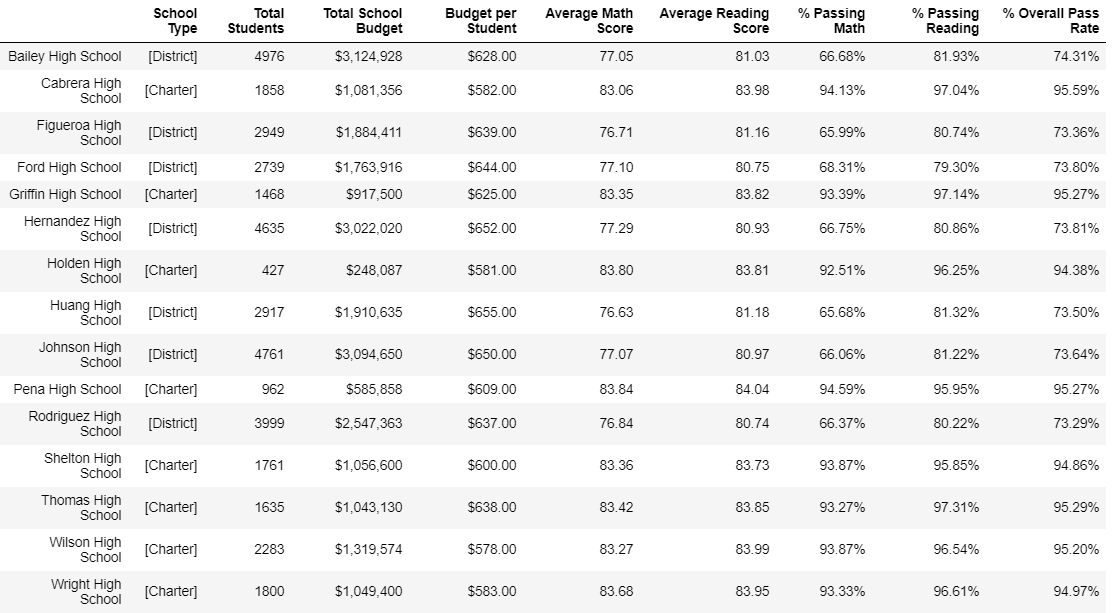
The summary-by-school provides an overview of key metrics, including:
- School Name
- School Type
- Total Students
- Total School Budget
- Per Student Budget
- Average Math Score
- Average Reading Score
- % Passing Math
- % Passing Reading
- Overall Passing Rate
These tables highlight the top-5 and bottom-5 performing schools based on Overall Passing Rate (OPR), with the following detail:
- School Name
- School Type
- Total Students
- Total School Budget
- Per Student Budget
- Average Math Score
- Average Reading Score
- % Passing Math
- % Passing Reading
- Overall Passing Rate
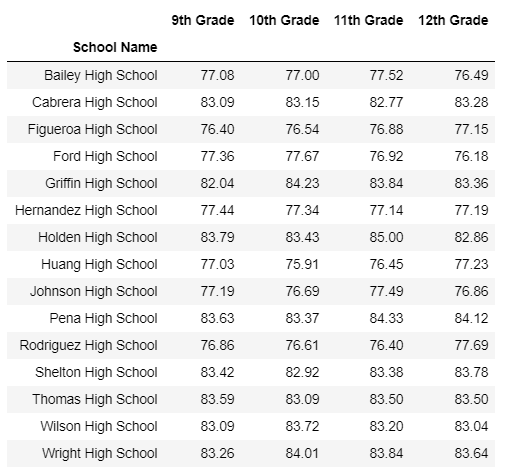
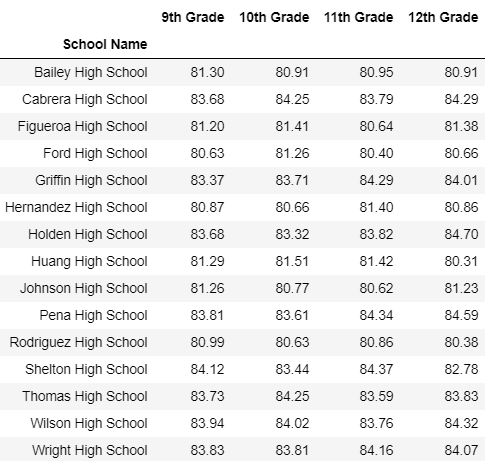
These tables show the average math & reading Scores for students of each grade level (9th, 10th, 11th, 12th) at each school.
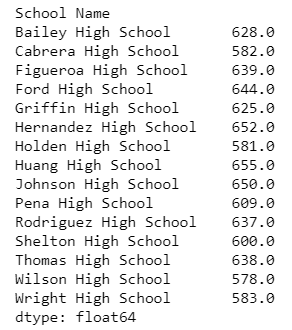
This evaluation breaks down school performances based on "spending ranges" for average spending per student), including:
- Average Reading Score
- % Passing Math
- % Passing Reading
- Overall Passing Rate
This table provides a similar school spending breakdown, but based on a reasonable approximation of school size (Small, Medium, Large).

The final analysis comapres massing math and reading rates, as well as OPR, this time based on school type (Charter vs. District).

The district has almost 40,000 students, with a total budget of just over $24,600,000. The overall passing rate is just above 80%, with the passing rate in math (74.98%) being lower than the passing rate in reading (85.81%). While average math and reading scores and passing rates varied between schools, they generally remained stable from grades 9-12 within each school.
Overall, the amount of spending per student at each school did not seem to strongly effect the math and reading outcomes. The one exception here were schools with the highest budgets and highest levels of spending per student, where student passing rates were noticeably lower, especially realated to math scores. Thus, the schools with the highest budgets are not the highest performing. For example, Johnson High School and Rodriguez High School were among the 5 bottom-performing schools, but also had two of the highest school budgets -- around $3.1M and $2.5M, respectively. By constrast, Pena High School and Griffin High School were among the 5 top-performing schools despite both having budgets under $1M -- around $586K and $900K respectively.
School size also did not noteiceably affect student math and reading outcomes. However, whether or not a school was a district school or a charter school had a strong correlation with outcomes, with students from charter school noticeably outperforming those from district school in both math and reading.


