Document intricacies of using WinDBG to aid Rust project development
WinDbg is a powerful debugger developed by Microsoft for the Windows operating system. It enables developers and system administrators to analyze and troubleshoot issues in user-mode applications, device drivers, and the operating system itself in kernel mode. With a rich set of commands, extensibility through plugins, and the ability to analyze crash dumps, WinDbg is an essential tool for diagnosing and resolving complex software problems.
WinDbg, Microsoft's debugger for Windows, comes in two versions: the classic text-based version and the newer WinDbg Preview with a modern GUI. Both versions share the same debugging engine, offering powerful tools like Time Travel Debugging (TTD) in WinDbg Preview. For the remainder of this project, we will be using the Classic
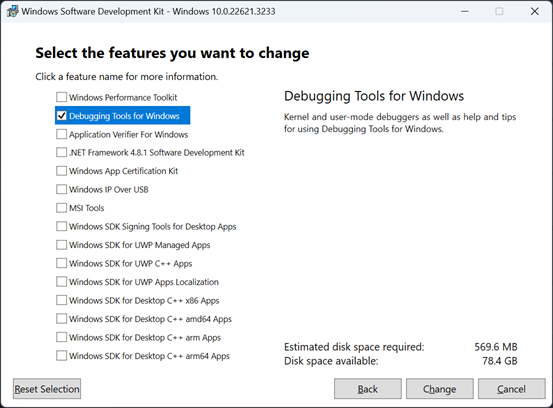
Tools included in Debugging Tools for Windows.
A great introductory page for WinDBG which includes installation instructions
As your navigate the copious WinDBG information out there, make sure to focus on Classic WinDBG, which we will be using in this project.
We developers sometimes worry that installing a software package will modify the environment.
I have verified in the past that WinDBG is not one of these. I have dumped a VM's registry before and after installing WinDBG and compared the resulting registry dumps. The only registry entry created is the location where it got installed such that the OS can uninstall it.
That means you have the option of downloading WinDBG on one machine, copying its directory to a USB drive or making it available on a shared drive.
Once you mount this shared drive or connect the USB key on the target machine, all you need to do is run WinDBG from that location to get all its funcionality.
If you desire, you can modify your environment PATH variable to make it easier on yourself by not requiring that the full pathname for the WinDBG executable be typed, but this is not required.
The version we use in this project (latest available at this time) requires less that 90 MiB of disk space.
If you prefer this option, copy the contents of "C:\Program Files (x86)\Windows Kits\10\Debuggers\x64" to the USB drive or share this directory.
- Download and install the
Windows SDKwhich contains the classicDebugging Tools for Windowspackage from Windows SDK archive- possible way:
dotnet add package Microsoft.Windows.SDK.BuildTools --version 10.0.22621.3233 - make sure to check the installation of the
Debugging Tools for Windowson the SDK installer settings (other components can also be checked, but that one MUST be checked)
- possible way:
- make sure the location of windbg.exe is added to the PATH environment variable (in this case
C:\Program Files (x86)\Windows Kits\10\Debuggers\x64)

Double check that windbg.exe is in your path before proceeding:
(create a new command window, then type this)
r:\repo>where windbg
C:\Program Files (x86)\Windows Kits\10\Debuggers\x64\windbg.exe
On this first debugging session, we will start notepad.exe and see what information we can gleam from it.
I know, we don't have the source for it, but we will use it to download the OS symbols for our machine and learn some WinDBG commands.
We will also set a default Workspace such that we can read the WinDBG UI from any monitor resolution.
-
execute the
rwindbg.batscript telling it to runnotepad.exepassing the filename readme.md as argumentr:\repo\rust-windbg>rwindbg.bat notepad.exe readme.md
When we start a process by the WinDBG debugger, the OS loader will load all the require DLL dependencies, and execute a "int 3" instruction. This generates an expected exception of type 0x80000003. The OS function that does it is located in the ntdll.dll and has the function name LdrpDoDebuggerBreak(). WinDBG displays that as ntdll!LdrpDoDebuggerBreak.
This would be the address of this function. The "int 3" instruction happens a bit later, so WinDBG shows it with "+0x30" offset to indicate that the "int 3" instruction is located 0x30 bytes into the code
(67a8.67ac): Break instruction exception - code 80000003 (first chance)
ntdll!LdrpDoDebuggerBreak+0x30:
00007ffb`2b2ebd44 cc              int     3
First commands suggestion, which will make the UI more legible and remember these settings for later runs:
(when you see 'type "xyz"' that actually means to press the letters "x", "y" and "z" and then press the ENTER key to issue a WinDBG command)
-
maximize the WinDBG window
-
using the menu, select Window => Dock All
-
select View => Font, select "Lucida Console" font and change Size to 12, click OK
-
select File => Save Workspace As, which will save the Default named workspace, click OK
-
type "k" to see the stack of the active thread
-
type "~" to see all the threads in our process; the one with a "." is the active thread
-
type "u ." for WinDBG to emit the assembly code that we are currently executing
( the "." in WinDBG command represents the current instruction pointer)Dissassenbling functions in WinDBG
When entering Windbg commands, you can use "." to replace with the current value of the instruction pointer register (RIP).
There are three commands that I use mostly when disassembling:command Remarks ub [address] disassembles 8 instructions leading to the address entered u [address] disassemble 8 instruction starting at the address entered uf [address] find the extents of the function we are in and disassemble entire function
(sometimes this becomes quite large a printout)Let's look at each in logical order. We stopped at the "int 3", so lets take a look at it:
0:000> u .
ntdll!LdrpDoDebuggerBreak+0x30:
00007ff9`5170bed4 cc              int     3
00007ff9`5170bed5 eb00            jmp     ntdll!LdrpDoDebuggerBreak+0x33 (00007ff9`5170bed7)
00007ff9`5170bed7 4883c438        add     rsp,38h
00007ff9`5170bedb c3              ret
00007ff9`5170bedc cc              int     3
00007ff9`5170bedd cc              int     3
00007ff9`5170bede cc              int     3
00007ff9`5170bedf cc              int     3
As you can see from the very first line, the execution is closed to the symbol named "ntdll!LdrpDoDebuggerBreak" and with an offset of "+0x30" bytes.
The CPU stopped execution at the "int 3" instruction. That is followed by a jump to the next instruction, then some fixing of the stack pointer RSP then a return "ret" followed by several more "int 3" opcodes. We seem to be at the end of a function named LdrpDoDebuggerBreak().Why is there an instruction to jump to the next instruction after the "int 3"?
It is insteresting to note that on the Intel Reference Manual the "int 3" instruction heading is "INT n/INTO/INT 3 — Call to Interrupt Procedure". When executed, this instruction generates a call to the interrupt handler or exception handler. This handler can then signal a successful or an error return by the next instruction it executes. On error it returns to the next instruction, on success, it skip the jmp instruction and resume executing at the following instruction after the jump. That jump to the next instruction just directs the CPU to no matter if it returned in error or on success to continue execution of the program at the next instruction.Why are there several "int 3" opcodes after the "ret" instruction?
For performance reasons, functions are loaded on 16 byte aligned addresses. This way, when accessed, the first 16 bytes fill an entire cache line. As such, there will be some unused code space between the end of a function and the next usable address that normally is a dead zone. The compilers normally fill these with "int 3" (opcode 0xcc) until the next 16 byte aligned address such that if you happen to end up there due to a programming error, it will end your process (if no debugger is attached) or be handled by the debugger.Why most system functions end with "add rsp,nn" followed by "ret"?
There are several approaches to passing arguments that can be used by the different compilers. For example, C++ code passes the "this" pointer in the RCX register. Some optimized code passes the first four argument in registers, the remainder on the stack. There is also possibility for the caller to cleanup the stack once the function returns, if any arguments were added to it. This is actually the only option when a function such as "printf()" is called, since only the caller know how many arguments were added to the stack. Others, might decided that the called function will cleanup the stack, since the argument count is known. This last choice in Windows is called "SYSCALL" and used by most Win32 APIs. This means the caller will push a known number of arguments onto the stack and the function will adjust the stack pointer accordingly prior to exit. Then the "ret" opcode moves the top of the stack (the return address) into the instruction pointer register and resume execution at that calling function.What are the instructions leading to our "int 3"?
0:000> ub .
ntdll!LdrpDoDebuggerBreak+0x10:
00007ff9`5170beb4 4c8d442440      lea     r8,[rsp+40h]
00007ff9`5170beb9 418d5110        lea     edx,[r9+10h]
00007ff9`5170bebd 48c7c1feffffff  mov     rcx,0FFFFFFFFFFFFFFFEh
00007ff9`5170bec4 e86745fcff      call    ntdll!NtQueryInformationThread (00007ff9`516d0430)
00007ff9`5170bec9 85c0            test    eax,eax
00007ff9`5170becb 780a            js      ntdll!LdrpDoDebuggerBreak+0x33 (00007ff9`5170bed7)
00007ff9`5170becd 807c244000      cmp     byte ptr [rsp+40h],0
00007ff9`5170bed2 7503            jne     ntdll!LdrpDoDebuggerBreak+0x33 (00007ff9`5170bed7)
By the displaying the 8 instructions before our "int 3" we see what instructions led to out current instruction.
What is our entire function that we are executing?
The "uf [address]" (unassemble function) command asks WinDBG to walk backwards and forwards from the given address and try to define the extents of our function. Then unassemble it.
0:000> uf .
ntdll!LdrpDoDebuggerBreak:
00007ffb`2b2ebd14 4883ec38        sub     rsp,38h
00007ffb`2b2ebd18 488364242000    and     qword ptr [rsp+20h],0
00007ffb`2b2ebd1e 41b901000000    mov     r9d,1
00007ffb`2b2ebd24 4c8d442440      lea     r8,[rsp+40h]
00007ffb`2b2ebd29 418d5110        lea     edx,[r9+10h]
00007ffb`2b2ebd2d 48c7c1feffffff  mov     rcx,0FFFFFFFFFFFFFFFEh
00007ffb`2b2ebd34 e8a740fcff      call    ntdll!NtQueryInformationThread (00007ffb`2b2afde0)
00007ffb`2b2ebd39 85c0            test    eax,eax
00007ffb`2b2ebd3b 780a            js      ntdll!LdrpDoDebuggerBreak+0x33 (00007ffb`2b2ebd47)  Branch

ntdll!LdrpDoDebuggerBreak+0x29:
00007ffb`2b2ebd3d 807c244000      cmp     byte ptr [rsp+40h],0
00007ffb`2b2ebd42 7503            jne     ntdll!LdrpDoDebuggerBreak+0x33 (00007ffb`2b2ebd47)  Branch

ntdll!LdrpDoDebuggerBreak+0x30:
00007ffb`2b2ebd44 cc              int     3
00007ffb`2b2ebd45 eb00            jmp     ntdll!LdrpDoDebuggerBreak+0x33 (00007ffb`2b2ebd47)  Branch

ntdll!LdrpDoDebuggerBreak+0x33:
00007ffb`2b2ebd47 4883c438        add     rsp,38h
00007ffb`2b2ebd4b c3              ret
If you are interested in knowing more about these instructions and have endless fun hours learning the intricacies of an architecture you can reach out to the Intel 64 and IA-32 Architecture Software Developer Manual.
Search for "INT n/INTO/INT 3—Call to Interrupt Procedure".
-
type "qd" to detach the running process (but leaves it running) and exit the windbg process
You should see that notepad.exe still runs and can be interacted with.
Quick answer: No, you don't.
But you may already have your environment setup to use WinDBG for your non-Rust programs and I did not want to break/modify it.
So rwindbg.bat only changes the environment temporarily for this invocation without affecting your permanent environment.
First, a small detour to learn more about our rwindbg scripts.
This project provides you with two scripts:
 - rwindbg.ps1 - just calls `rwindbg.bat` passing all arguments it receives. It exists to help those that feel better using a PowerShell script
 - rwindbg.bat - where a temporary environment setup happens to be able to run WinDBG and get the most benefit from it.
Both of these scripts expect arguments which will tell WinDBG what process to start or attach to debug:
 - create a new process running under the debugger: target\debug\stack_overflow.exe
 - to attach to an already running program by PID:  -p PID
 - to attach to an already running program by name: -pn notepad.exe
The necessary environment for running WinDBG is a bit involved:
- where to find my source code during the debugging session
- where to find my debugging symbols
- where to find the system component symbols
- how to automatically download the missing ones
- where to cache them on my disk once downloaded
- where to download them from
If you are insterested in seeing how this environment is conveyed to WinDBG, you can edit rwindbg.bat and search for these line:
:: (if you want to see the arguments to WinDBG and Rust that are active, comment the next line by adding :: as first two characters)
goto :skip_over_show_env
Comment this "goto ..." line and rwindbg.bat now prints it's environment settings before it start the WinDBG session:
PS R:\repo\rust-windbg> .\rwindbg.ps1 .\target\debug\stack_overflow.exe
_NT_SOURCE_PATH=.\src;.\;C:\Users\opedr\.rustup\toolchains\stable-x86_64-pc-windows-msvc\lib\rustlib\src\rust;C:\Users\opedr\.rustup\toolchains\nightly-x86_64-pc-windows-msvc\lib\rustlib\src\rust
_NT_SYMBOL_PATH=cache*c:\Symbols\ms;srv*https://msdl.microsoft.com/download/symbols;srv*target\debug;srv*target\debug\deps;srv*target\debug\build;srv*target\release;srv*target\release\deps;srv*target\release\build;srv*C:\Users\opedr\.rustup\toolchains\stable-x86_64-pc-windows-msvc\bin;srv*C:\Users\opedr\.rustup\toolchains\stable-x86_64-pc-windows-msvc\lib\rustlib\x86_64-pc-windows-msvc\lib;srv*C:\Users\opedr\.rustup\toolchains\nightly-x86_64-pc-windows-msvc\bin;srv*C:\Users\opedr\.rustup\toolchains\nightly-x86_64-pc-windows-msvc\lib\rustlib\x86_64-pc-windows-msvc\lib
start windbg -W Default -c "$><C:\Users\opedr\AppData\Local\Temp\rwindbg.windbg" .\target\debug\stack_overflow.exe
PS R:\repo\rust-windbg>
On this second session, we create a new WinDBG instance and attach it to the existing notepad.exe process we started and left running from the previous debugging session.
If you closed the notepad.exe instance (like I would have done), no worries. Just re-execute the command on the First Debugging Session section again to get a running WinDBG session on newly created notepad.exe instance.
We then take a look around a process that is not ours (notepad.exe) to learn some common knowledge about processes in Windows.
Let's debug our notepad.exe process again
- attach a new debugger instance to the notepad.exe you created and left running with "qd", this time using
PS R:\repo\rust-windbg> rwindbg.bat -pn notepad.exe- notice that the font selection and the docked window settings have persisted
Let's take a look at modules and their information
-
let's look at what the script controled WinDBG last printed, which is the list of all modules loaded in the process. These are the dependent DLLs. If any of these is missing, the program cannot even be started.
This is the output of the "lm" command. It shows each module start and end loading address, the module name, the symbol loading status ("deferred", "pdb symbols", "private pdb symbols") and the symbol filename (only if one is loaded):========== lm - show the modules currently loaded to our process start end module name 00007ff6`320a0000 00007ff6`320fa000 notepad (pdb symbols) c:\symbols\ms\notepad.pdb\187DDA8685B2AE461B8B6C4FC32FA79C1\notepad.pdb 00007ffb`1ec00000 00007ffb`1ee93000 COMCTL32 (pdb symbols) c:\symbols\ms\comctl32.pdb\C6E036C1E6FB2D8A98B12D310EA28CFC1\comctl32.pdb 00007ffb`28530000 00007ffb`28649000 gdi32full (pdb symbols) c:\symbols\ms\gdi32full.pdb\2D1A8910B950465BDEEA50628ECDE4EC1\gdi32full.pdb 00007ffb`28650000 00007ffb`286ea000 msvcp_win (pdb symbols) c:\symbols\ms\msvcp_win.pdb\34CF737A2EC69D74A1E74342D39636281\msvcp_win.pdb 00007ffb`286f0000 00007ffb`28716000 win32u (pdb symbols) c:\symbols\ms\win32u.pdb\CD69FD27F9D0EF5A15A38E7077C3DAC91\win32u.pdb 00007ffb`28720000 00007ffb`28ac7000 KERNELBASE (pdb symbols) c:\symbols\ms\kernelbase.pdb\639BADC1F9F2D7F0F8AC2DA91D5CF7B71\kernelbase.pdb 00007ffb`28d80000 00007ffb`28da8000 bcrypt (pdb symbols) c:\symbols\ms\bcrypt.pdb\973F82DD45767EBD629F2B5A6CC2A2C41\bcrypt.pdb 00007ffb`28e20000 00007ffb`28f31000 ucrtbase (pdb symbols) c:\symbols\ms\ucrtbase.pdb\B3FB7E9697D3F52D70C3BEB2AF2B94821\ucrtbase.pdb 00007ffb`29180000 00007ffb`29295000 RPCRT4 (pdb symbols) c:\symbols\ms\rpcrt4.pdb\8D15D31D8F997167B2F6855E344D129D1\rpcrt4.pdb 00007ffb`292a0000 00007ffb`292c9000 GDI32 (pdb symbols) c:\symbols\ms\gdi32.pdb\483BD0A60FE0DF29F3C24BD5676A3AC31\gdi32.pdb 00007ffb`29750000 00007ffb`29845000 shcore (pdb symbols) c:\symbols\ms\shcore.pdb\E409E489361AB65E9EF0EC8EB6A46F9B1\shcore.pdb 00007ffb`29850000 00007ffb`29914000 KERNEL32 (pdb symbols) c:\symbols\ms\kernel32.pdb\6EC59C2D4B03AACAA9235F9A61D88F121\kernel32.pdb 00007ffb`2a5a0000 00007ffb`2a648000 sechost (pdb symbols) c:\symbols\ms\sechost.pdb\F418698994B8D7FF9F26BA221E68797B1\sechost.pdb 00007ffb`2a680000 00007ffb`2a727000 msvcrt (pdb symbols) c:\symbols\ms\msvcrt.pdb\9DECB4CB0673A2630140316F80FCE4981\msvcrt.pdb 00007ffb`2a730000 00007ffb`2a7e2000 advapi32 (pdb symbols) c:\symbols\ms\advapi32.pdb\B733942119F6082791A28DBABA9F5E321\advapi32.pdb 00007ffb`2a7f0000 00007ffb`2a99e000 USER32 (pdb symbols) c:\symbols\ms\user32.pdb\AC05C27770E42DCA4E17EE8C8999268B1\user32.pdb 00007ffb`2ac00000 00007ffb`2af88000 combase (private pdb symbols) c:\symbols\ms\combase.pdb\BEDF8B99DAE89EA8D41059D16C5BB39E1\combase.pdb 00007ffb`2b210000 00007ffb`2b427000 ntdll (pdb symbols) c:\symbols\ms\ntdll.pdb\8D5D5ED5D5B8AA609A82600C14E3004D1\ntdll.pdb ========== type "k<ENTER>" to see our current stack -
enter the command "lmvM *.exe", which will display the full information for your process executable
0:000> lmvM *.exe Browse full module list start end module name 00007ff6`320a0000 00007ff6`320fa000 notepad (pdb symbols) c:\symbols\ms\notepad.pdb\187DDA8685B2AE461B8B6C4FC32FA79C1\notepad.pdb Loaded symbol image file: C:\WINDOWS\SYSTEM32\notepad.exe Image path: notepad.exe Image name: notepad.exe Browse all global symbols functions data Image was built with /Brepro flag. Timestamp: 2800487F (This is a reproducible build file hash, not a timestamp) CheckSum: 0005E412 ImageSize: 0005A000 File version: 10.0.22621.3527 Product version: 10.0.22621.3527 File flags: 0 (Mask 3F) File OS: 40004 NT Win32 File type: 1.0 App File date: 00000000.00000000 Translations: 0409.04b0 Information from resource tables: CompanyName: Microsoft Corporation ProductName: Microsoft® Windows® Operating System InternalName: Notepad OriginalFilename: NOTEPAD.EXE ProductVersion: 10.0.22621.3527 FileVersion: 10.0.22621.3527 (WinBuild.160101.0800) FileDescription: Notepad LegalCopyright: © Microsoft Corporation. All rights reserved. -
Sometimes we have a problem that only happen at a specific OS version. To find out exactly which OS version we are running, We can also get more detail about which specific version of the KERNELBASE we are dealing with:
0:000> lmvM *KERNELBASE* Browse full module list start end module name 00007ffe`a95a0000 00007ffe`a9947000 KERNELBASE (pdb symbols) c:\symbols\ms\kernelbase.pdb\639BADC1F9F2D7F0F8AC2DA91D5CF7B71\kernelbase.pdb Loaded symbol image file: C:\WINDOWS\System32\KERNELBASE.dll Image path: C:\WINDOWS\System32\KERNELBASE.dll Image name: KERNELBASE.dll Browse all global symbols functions data Image was built with /Brepro flag. Timestamp: 83EFBEAB (This is a reproducible build file hash, not a timestamp) CheckSum: 003AFED9 ImageSize: 003A7000 File version: 10.0.22621.3527 Product version: 10.0.22621.3527 File flags: 0 (Mask 3F) File OS: 40004 NT Win32 File type: 2.0 Dll File date: 00000000.00000000 Translations: 0409.04b0 Information from resource tables: CompanyName: Microsoft Corporation ProductName: Microsoft® Windows® Operating System InternalName: Kernelbase.dll OriginalFilename: Kernelbase.dll ProductVersion: 10.0.22621.3527 FileVersion: 10.0.22621.3527 (WinBuild.160101.0800) FileDescription: Windows NT BASE API Client DLL LegalCopyright: © Microsoft Corporation. All rights reserved.- from this output we can see that:
- it comes from Windows 10.0, Build 22621, and it took 3527 revisions to get it all just right for delivery
File version: 10.0.22621.3527
- where it lives
Loaded symbol image file: C:\WINDOWS\System32\KERNELBASE.dllImage path: C:\WINDOWS\System32\KERNELBASE.dll
- its symbol file (i.e. it's PDB) was downloaded by the debugger to
c:\symbols\ms\kernelbase.pdb\639BADC1F9F2D7F0F8AC2DA91D5CF7B71\kernelbase.pdb - it is loaded into the notepad process between
- begin address: 00007ffe`a95a0000
- end address: 00007ffe`a9947000
- notice that the module extents are always a multiple of 64 KiB (that also means that the smallest DLL one can have in Windows is 64 KiB)
- it comes from Windows 10.0, Build 22621, and it took 3527 revisions to get it all just right for delivery
- from this output we can see that:
Where all this module header information comes from? The PEFILE Format
So glad you asked. In Windows, all executables and DLLs are packaged using the PEFILE format.
The PEFILE (Portable Executable File) is a fundamental file format used by Windows operating systems for executable files (EXEs), dynamic link libraries (DLLs), and other types of files. It serves as a structured container that organizes code, data, and resources necessary for the execution and operation of programs. The PE format defines headers containing essential metadata like file type, machine architecture, entry point, and information about required libraries. It also divides the file into sections holding code, data, and resources such as icons, strings, and dialog boxes. PEFILE is critical for program loading, linking, and execution, allowing Windows to understand and manage the contents of executable files. Tools like dumpbin.exe, which is delivered with the SDK can be used to inspect it. Tools like editbin.exe from the SDK can be used to modify it.
Most of the information displayed by the "lm" command in WinDBG comes from the PEFILE for that module.
Execute the following command to take a look at the information it contains for our target executable:
(On my system, I find it here "C:\Program Files\Microsoft Visual Studio\2022\Community\VC\Tools\MSVC\14.39.33519\bin\Hostx64\x64\dumpbin.exe")
dumpbin /headers target\debug\stack_overflow.exe
Interesting tidbits from our executable:
| Value | Field | Description |
|---|---|---|
| 140000000 | image base | base address where our EXE information will be loaded into our process |
| 2350C | entry point (000000014002350C) mainCRTStartup | address and symbolic name of the startup function |
| 100000 | size of stack reserve | default stack size for all threads created from this executable |
| 1000 | size of stack commit | how much of the that memory is comitted on program start |
| 665018B9 | cv ... Format: RSDS, {88D1C27B-C16C-4B7B-9BDB-0BE90B196422}, 1, stack_overflow.pdb | section containing PDB checksum and name |
But how are these used you might ask?
| Value | Field | Description |
|---|---|---|
| image base | address in memory that the PEFILE for our executable will be mapped into | |
| entry point | loader will call this function after PEFILE is mapped into memory | |
| size of stack reserve | OS will use this value to reserve this amount of memory and use that address to initialize the stack pointer register | |
| size of stack commit | OS will commit this much memory from the reserved stack; remainder will be committed on demand | |
| {88D1C27B-C16C-4B7B-9BDB-0BE90B196422}, 1, stack_overflow.pdb | When a debugger is attached to this process, the debugger looks for a file names stack_overflow.pdb; once found it double checks it contains this checksum, since there could be multiple versions of the PDB name in the symbol cache or symbol server |
Execute the following command to take a look what dependencies our executable has:
(On my system, I find it here "C:\Program Files\Microsoft Visual Studio\2022\Community\VC\Tools\MSVC\14.39.33519\bin\Hostx64\x64\dumpbin.exe")
r:\repo\rust-windbg>dumpbin /imports target\debug\stack_overflow.exe | findstr /ir "\.dll$"
    api-ms-win-core-synch-l1-2-0.dll
    KERNEL32.dll
    ntdll.dll
    VCRUNTIME140.dll
    api-ms-win-crt-runtime-l1-1-0.dll
    api-ms-win-crt-math-l1-1-0.dll
    api-ms-win-crt-stdio-l1-1-0.dll
    api-ms-win-crt-locale-l1-1-0.dll
    api-ms-win-crt-heap-l1-1-0.dll
Our executable can not start unless all these DLLs are found and mapped into our process memory.
By the way, this process is recursive. These DLLs will also have their PEFILE headers inspected and their dependencies loaded prior to themselves being loaded into our process.
On the command above, we only checked the filenames if printed out.
If you look at the actual printout, you will see that each DLL header is followed by the functions our program references from those DLLs. These have to be resolved and their addressed (after being mapped into our process) replaced in our process import table. That is how external functions referenced by our program are found during execution time.
Let's take a look at a single one of them, the VCRUNTIME140.dll:
    VCRUNTIME140.dll
             140026158 Import Address Table
             140032818 Import Name Table
                     0 time date stamp
                     0 Index of first forwarder reference

                          1B __current_exception
                          1C __current_exception_context
                           8 __C_specific_handler
                           1 _CxxThrowException
                          3B memcmp
                          3D memmove
                          3E memset
                          3C memcpy
                           E __CxxFrameHandler3
It is interesting that although this is a Rust program, it depends on the C/C++ Runtime library being loaded.
From the name of the referenced functions (exception) seems like Rust is borrowing C/C++ exception handling mechanics.
It also seems to borrow these efficient memory copy, compare, and set functions that can handle overlapping arrays as well.
Let's take a look at finding and setting a breakpoint at a Win32 API
- let's look for the address of a Windows 32 API such as CreateFileW() which is how files are opened in Win32
- we know that we use CreateFileW in notepad.exe, so let's see if that symbol is defined in the executable module:
0:004> x notepad!*CreateFileW
00007ff7`50669de0 notepad!_imp_CreateFileW = <no type information>
- as you can see, the linker says we do use it, but that it is a import from some other module
Since we don't know where, we will try to find it from all the modules that are loaded for our process.
At this point of the process created, they are all already loaded, so we should be able to find it.
- enter the command "x *!CreateFileW", results which follows:
0:004> x *!CreateFileW
00007ffd`2eb149f0 KERNELBASE!CreateFileW (CreateFileW)
00007ffd`2f230460 KERNEL32!CreateFileW (CreateFileW)
00007ffd`2f3e54c3 combase!CreateFileW (CreateFileW)
-
notice that the first column is the address associated with each symbol
-
the name of an exported symbol follows the pattern "module!function_name"
-
issue the command "lma 00007ffd`2eb149f0" which is the address of the first CreateFileW returned by the "x" command above
- (you may have to enter the value your "x *!CreateFileW" printed out, since it might be different than mine)
0:004> lma 00007ffd`2eb149f0
Browse full module list
start             end                 module name
00007ffd`2eaf0000 00007ffd`2ee97000   KERNELBASE   (pdb symbols)          c:\symbols\ms\kernelbase.pdb\639BADC1F9F2D7F0F8AC2DA91D5CF7B71\kernelbase.pdb
Now that we know where the function actually is, we can set a breakpoint.
This can be done using the address or the name.
0:000> bp KERNELBASE!CreateFileW
0:000> bl
     0 e Disable Clear  00007fff`6e6149f0     0001 (0001)  0:**** KERNELBASE!CreateFileW
Notice that the first number printed is a zero. This is actually a sequential id for the breakpoints you create.
You can use them on commands affecting the breakpoint by specifying their id.
The second, the letter 'e', indicates if the breakpoint is enabled or disabled.
If you want to disable the stopping at this location for now either click Disable or emit the command line for it. When I click on Disable, the command "bd 0" is executed. Typing the command "bc 0" will clear (delete) the breakpoint.
In general all the links on the WinDBG UI are accelerator to commands like that
0:000> bp KERNELBASE!CreateFileW
0:000> bl
     0 e Disable Clear  00007fff`6e6149f0     0001 (0001)  0:**** KERNELBASE!CreateFileW
0:000> bd 0
0:000> bl
     0 d Enable Clear  00007fff`6e6149f0     0001 (0001)  0:**** KERNELBASE!CreateFileW
0:000> bc 0
0:000> bl
We now run a Rust executable from this project named stack_overflow.
This executable will ask for a positive integer on the terminal and calculate its factorial using a recursive algorithm.
If given a large enough input like 100, it will fail with a stack overflow error (exception code 0xc00000fd)
Let's learn some more about stacks in Windows programs.
- The PE Header - By default, a Windows executable has a 1 MB stack region. This default can be changed by linker directives (link /STACK:reserve[,commit]) or using development tools such as editbin (editbin /STACK:reserve[,commit]). This default will be applied to all threads created unless the thread creation code itself specifies a different stack size. Another way to affect the stack of a running process is to create a thread and specify the stack size during prior its creation. As long as your code runs in that thread's context, you will be bound by that thread's attributes, including its stack size.I wanted this contrived example fail faster (not too many entries until it ran out of stack), so I am passing an array by value on the call to the factorial() function.
But Rust compiler is too smart and because I originally had no references into that array, it optimized it away and kept failing with still "too many" entries on the stack.
Only when I started accessing the array itself it finally failed as fast as desired since now the rust compiler had no choice but add the array manipulating steps to the generated code.
The final version we run this program with a stack of 4Kb, which is the minimum stack a Windows thread may have, since stacks are OS page size minimum.
Later on, we will also notice that stacks for multiple threads seem to coalesce in memory.
Running the stack_overflow executable informs us that it had a overflow on our thread.
(type the underlined characters)
PS R:\repo\rust-windbg> target\debug\stack_overflow.exe
Hello from thread1!
Enter a non-negative integer: 100

thread 'thread1' has overflowed its stack
We run it using cargo run to see if we gleam any other information:
(type the underlined characters)
PS R:\repo\rust-windbg> cargo run --bin stack_overflow
    Finished `dev` profile [unoptimized + debuginfo] target(s) in 0.05s
     Running `target\debug\stack_overflow.exe`
Hello from thread1!
Enter a non-negative integer: 100

thread 'thread1' has overflowed its stack
error: process didn't exit successfully: `target\debug\stack_overflow.exe` (exit code: 0xc00000fd, STATUS_STACK_OVERFLOW)
On this new run, we find out that the exit code is 0xC00000FD, which is the Windows error code for STATUS_STACK_OVERFLOW.
What are other Windows errors, exception codes and their associated messages?
You can all see all other possible Windows errors and their associated message by inspecting this file delivered as part of the Windows SDK:
ntstatus.h
Another interesting file contains all possible results for the Win32 API GetLastError(), which is also part of the Windows SDK:
winerror.h
Interesting that running it in Release gives different result
Using cargo run --release, we get a different, although still incorrect, result:
r:\repo\rust-windbg>cargo run --release --bin stack_overflow
   Compiling rust-windbg v0.1.0 (R:\repo\rust-windbg)
    Finished `release` profile [optimized] target(s) in 1.00s
     Running `target\release\stack_overflow.exe`
Hello from thread1!
Enter a non-negative integer: 100
The factorial of 100 is: 0
For now, we will make a record of that fact but decide to investigate it later.
Let's run the DEBUG stack_overflow.exe under WinDBG and see what we can learn.
(type the underlined characters; you only need the double-quotes if your executable has spaces in its name)
r:\repo\rust-windbg> rwindbg "target\debug\stack_overflow.exe"
You will see a printout of the command it executes and then two new windows are created:
- the script will printout the actual command it executes:
start windbg -W Default -c "$><C:\Users\opedr\AppData\Local\Temp\rwindbg.windbg" target\debug\stack_overflow.exe - A Windbg process waiting for a command on a prompt field like this
0:000> - A terminal window representing the running of the console application
R:\repo\rust-windbg\target\debug\stack_overflow.exe
When this terminal window starts, it will get the keyboard focus (a started process by default takes the keyboard focus in Windows) and you will later be asked to enter the number to calculate factorial here.
Let's learn how to use the WinDBG help
WinDBG commands are cryptic if one is not used to use them frequently. One command that is helpful is ".hh subject" We will next learn about threads, so lets call up the help on thread commands:0:000> .hh threadwindbg> .hh thread
0:000> |
. 0 id: 722c create name: stack_overflow.exe
0:000> ~
. 0 Id: 722c.206c Suspend: 1 Teb: 0000004e`3b1bc000 Unfrozen
1 Id: 722c.2028 Suspend: 1 Teb: 0000004e`3b1be000 Unfrozen
2 Id: 722c.7474 Suspend: 1 Teb: 0000004e`3b1c0000 Unfrozen
3 Id: 722c.734 Suspend: 1 Teb: 0000004e`3b1c2000 Unfrozen
On the data shown above, we see that process index 0 is the current process and that thread index 0 is the current thread.
The "." as the first character indicates which is the current.
We also learn that we can change the current process "|0s" or the current thread "~3s" by adding their index and "s" after it.
Let's learn about threading commands in WinDBG "~*", "~#", "~s"
Let try it again and this time we enter ".hh ~". Remember to press "" on the help dialog that pops up to complete the help command. On this page title `Thread Syntax`, we learn that:| Thread Identifier | Description |
|---|---|
| ~. | represents the current thread |
| ~# | represents the thread that caused the current exception or debug event |
| ~* | represents all threads in the process. |
| ~s | displays the current thread |
| ~Thread s | sets the current thread (Thread is one of: index, #, or a numerical expression that resolves into a thread id) |
We can also ask for a command to be executed on a specific thread context, such as asking what was the last error that happened on that thread.
That is, what was the last value someone called the Win32 API SetLastError() with, or what was the last status value of a kernel operation on this thread:
0:000> ~*e !gle
LastErrorValue: (Win32) 0xbb (187) - The specified system semaphore name was not found.
LastStatusValue: (NTSTATUS) 0 - STATUS_SUCCESS
LastErrorValue: (Win32) 0 (0) - The operation completed successfully.
LastStatusValue: (NTSTATUS) 0 - STATUS_SUCCESS
LastErrorValue: (Win32) 0 (0) - The operation completed successfully.
LastStatusValue: (NTSTATUS) 0 - STATUS_SUCCESS
LastErrorValue: (Win32) 0 (0) - The operation completed successfully.
LastStatusValue: (NTSTATUS) 0 - STATUS_SUCCESS
We can also ask to see the stack for each thread to get an overall picture of what is happening in our process right now.
At this time, I don't expect anything very interesting since we are starting the process and not much has happened from the user program point of view.
0:000> ~*k

.  0  Id: 722c.206c Suspend: 1 Teb: 0000004e`3b1bc000 Unfrozen
 # Child-SP          RetAddr               Call Site
00 0000004e`3af7ed30 00007ffe`ac2ee99a     ntdll!LdrpDoDebuggerBreak+0x30
01 0000004e`3af7ed70 00007ffe`ac2da744     ntdll!LdrpInitializeProcess+0x1cfa
02 0000004e`3af7f140 00007ffe`ac283ea3     ntdll!_LdrpInitialize+0x56868
03 0000004e`3af7f1c0 00007ffe`ac283dce     ntdll!LdrpInitializeInternal+0x6b
04 0000004e`3af7f440 00000000`00000000     ntdll!LdrInitializeThunk+0xe

   1  Id: 722c.2028 Suspend: 1 Teb: 0000004e`3b1be000 Unfrozen
 # Child-SP          RetAddr               Call Site
00 0000004e`3b2ff768 00007ffe`ac24537e     ntdll!NtWaitForWorkViaWorkerFactory+0x14
01 0000004e`3b2ff770 00007ffe`abf0257d     ntdll!TppWorkerThread+0x2ee
02 0000004e`3b2ffa50 00007ffe`ac26aa48     KERNEL32!BaseThreadInitThunk+0x1d
03 0000004e`3b2ffa80 00000000`00000000     ntdll!RtlUserThreadStart+0x28

   2  Id: 722c.7474 Suspend: 1 Teb: 0000004e`3b1c0000 Unfrozen
 # Child-SP          RetAddr               Call Site
00 0000004e`3b3ffc18 00007ffe`ac24537e     ntdll!NtWaitForWorkViaWorkerFactory+0x14
01 0000004e`3b3ffc20 00007ffe`abf0257d     ntdll!TppWorkerThread+0x2ee
02 0000004e`3b3fff00 00007ffe`ac26aa48     KERNEL32!BaseThreadInitThunk+0x1d
03 0000004e`3b3fff30 00000000`00000000     ntdll!RtlUserThreadStart+0x28

   3  Id: 722c.734 Suspend: 1 Teb: 0000004e`3b1c2000 Unfrozen
 # Child-SP          RetAddr               Call Site
00 0000004e`3b4ff7a8 00007ffe`ac24537e     ntdll!NtWaitForWorkViaWorkerFactory+0x14
01 0000004e`3b4ff7b0 00007ffe`abf0257d     ntdll!TppWorkerThread+0x2ee
02 0000004e`3b4ffa90 00007ffe`ac26aa48     KERNEL32!BaseThreadInitThunk+0x1d
03 0000004e`3b4ffac0 00000000`00000000     ntdll!RtlUserThreadStart+0x28
Let's learn how to use 'gn' to continue execution
At this point we let the process execute and we should stop at our stack overflow event.0:000> gnNote: I normally default to typing "gn" which official name is "Go with Exception Not Handled".
This command allows the application's exception handler to handle the exception.
Remember, you can always do ".hh gn" to read the details in the WinDBG Help.
Once "gn" is pressed, WindDBG shows that the debuggee is now running:
*BUSY* | Debuggee is running...
Change your focus to the terminal window and answer the question there:
Hello from thread1!
Enter a non-negative integer: 100
Look back at the WinDBG window and you see that the stack overflow event has happened:
0:000> gn
(722c.31fc): Stack overflow - code c00000fd (first chance)
First chance exceptions are reported before any exception handling.
This exception may be expected and handled.
stack_overflow!stack_overflow::factorial+0x7:
00007ff7`1e218597 48894c2450      mov     qword ptr [rsp+50h],rcx ss:0000004e`3af86600=0000000000000000
If our source setup is correct and our code build did produce a PDB containing the symbol file, WinDBG will open the associated source file and display the line number where the event happened:
(I marked the first line with '>>>' to indicate which line WinDBG highlighted on my screen)
...
>>> fn factorial(arg: FactorialArgument) -> u64 {
    if arg.idx == 0 {
        1 // Base case: Factorial of 0 is 1
    } else {
        let mut new_arg = FactorialArgument { idx: arg.idx-1, array: [0;COUNT_ENTRIES]}; // wastes stack space on every call
        new_arg.array[new_arg.idx] = arg.idx;
        arg.idx as u64 * factorial(new_arg) // Recursive case: n! = n * (n-1)!
    }
}
...
What have other threads been doing while we executed?
I am curious to see what our other threads have been doing when this event took place that stop all threads.
So I execute "~" to see all our current threads:
0:004> ~
   0  Id: 722c.206c Suspend: 1 Teb: 0000004e`3b1bc000 Unfrozen "main"
.  4  Id: 722c.31fc Suspend: 1 Teb: 0000004e`3b1c4000 Unfrozen "thread1"
Interesting, seems like our original threads indices 1, 2, and 3 have since terminated and are no longer threads in our process.
There is a new thread, index 4, which is the one that we create in our source with a smallish stack to force the stack overflow.
I now execute a "~#" which tells me which thread caused the debug event that stopped the execution:
0:004> ~#
.  4  Id: 722c.31fc Suspend: 1 Teb: 0000004e`3b1c4000 Unfrozen "thread1"
      Start: stack_overflow!std::sys::pal::windows::thread::impl$0::new::thread_start (00007ff7`1e225050)
      Priority: 0  Priority class: 32  Affinity: ffffff
And finally we see what are the current stack traces for all threads:
0:004> ~*k

   0  Id: 722c.206c Suspend: 1 Teb: 0000004e`3b1bc000 Unfrozen "main"
 # Child-SP          RetAddr               Call Site
00 0000004e`3af7f248 00007ffe`a95d427e     ntdll!NtWaitForSingleObject+0x14
01 0000004e`3af7f250 00007ff7`1e225231     KERNELBASE!WaitForSingleObjectEx+0x8e
02 0000004e`3af7f2f0 00007ff7`1e2118c5     stack_overflow!std::sys::pal::windows::thread::Thread::join+0x21 [/rustc/9b00956e56009bab2aa15d7bff10916599e3d6d6/library\std\src\sys\pal\windows\thread.rs @ 72]
...
0c 0000004e`3af7f880 00007ff7`1e23349c     stack_overflow!main+0x19
0d (Inline Function) --------`--------     stack_overflow!invoke_main+0x22 [D:\a\_work\1\s\src\vctools\crt\vcstartup\src\startup\exe_common.inl @ 78]
0e 0000004e`3af7f8b0 00007ffe`abf0257d     stack_overflow!__scrt_common_main_seh+0x10c [D:\a\_work\1\s\src\vctools\crt\vcstartup\src\startup\exe_common.inl @ 288]
0f 0000004e`3af7f8f0 00007ffe`ac26aa48     KERNEL32!BaseThreadInitThunk+0x1d
10 0000004e`3af7f920 00000000`00000000     ntdll!RtlUserThreadStart+0x28

#  4  Id: 722c.31fc Suspend: 1 Teb: 0000004e`3b1c4000 Unfrozen "thread1"
 # Child-SP          RetAddr               Call Site
00 0000004e`3af865b0 00007ff7`1e2186a5     stack_overflow!stack_overflow::factorial+0x7 [R:\repo\rust-windbg\bug_samples\stack_overflow.rs @ 36]
01 0000004e`3af87210 00007ff7`1e2186a5     stack_overflow!stack_overflow::factorial+0x115 [R:\repo\rust-windbg\bug_samples\stack_overflow.rs @ 42]
02 0000004e`3af87e70 00007ff7`1e2186a5     stack_overflow!stack_overflow::factorial+0x115 [R:\repo\rust-windbg\bug_samples\stack_overflow.rs @ 42]
03 0000004e`3af88ad0 00007ff7`1e2186a5     stack_overflow!stack_overflow::factorial+0x115 [R:\repo\rust-windbg\bug_samples\stack_overflow.rs @ 42]
04 0000004e`3af89730 00007ff7`1e2186a5     stack_overflow!stack_overflow::factorial+0x115 [R:\repo\rust-windbg\bug_samples\stack_overflow.rs @ 42]
05 0000004e`3af8a390 00007ff7`1e2186a5     stack_overflow!stack_overflow::factorial+0x115 [R:\repo\rust-windbg\bug_samples\stack_overflow.rs @ 42]
06 0000004e`3af8aff0 00007ff7`1e2186a5     stack_overflow!stack_overflow::factorial+0x115 [R:\repo\rust-windbg\bug_samples\stack_overflow.rs @ 42]
07 0000004e`3af8bc50 00007ff7`1e2186a5     stack_overflow!stack_overflow::factorial+0x115 [R:\repo\rust-windbg\bug_samples\stack_overflow.rs @ 42]
08 0000004e`3af8c8b0 00007ff7`1e2186a5     stack_overflow!stack_overflow::factorial+0x115 [R:\repo\rust-windbg\bug_samples\stack_overflow.rs @ 42]
09 0000004e`3af8d510 00007ff7`1e2186a5     stack_overflow!stack_overflow::factorial+0x115 [R:\repo\rust-windbg\bug_samples\stack_overflow.rs @ 42]
0a 0000004e`3af8e170 00007ff7`1e215198     stack_overflow!stack_overflow::factorial+0x115 [R:\repo\rust-windbg\bug_samples\stack_overflow.rs @ 42]
0b 0000004e`3af8edd0 00007ff7`1e21a279     stack_overflow!stack_overflow::main::closure$0+0xc8 [R:\repo\rust-windbg\bug_samples\stack_overflow.rs @ 28]
...
16 0000004e`3af8fe10 00007ffe`abf0257d     stack_overflow!std::sys::pal::windows::thread::impl$0::new::thread_start+0x4c [/rustc/9b00956e56009bab2aa15d7bff10916599e3d6d6/library\std\src\sys\pal\windows\thread.rs @ 54]
17 0000004e`3af8fea0 00007ffe`ac26aa48     KERNEL32!BaseThreadInitThunk+0x1d
18 0000004e`3af8fed0 00000000`00000000     ntdll!RtlUserThreadStart+0x28
So we can see that thread index 0 (the main thread) is waiting for the thread we created to complete its processing and return (rejoin): (I only copy here the detail of the three top entries on the stack for the main thread)
   0  Id: 722c.206c Suspend: 1 Teb: 0000004e`3b1bc000 Unfrozen "main"
 # Child-SP          RetAddr               Call Site
00 0000004e`3af7f248 00007ffe`a95d427e     ntdll!NtWaitForSingleObject+0x14
01 0000004e`3af7f250 00007ff7`1e225231     KERNELBASE!WaitForSingleObjectEx+0x8e
02 0000004e`3af7f2f0 00007ff7`1e2118c5     stack_overflow!std::sys::pal::windows::thread::Thread::join+0x21 [/rustc/9b00956e56009bab2aa15d7bff10916599e3d6d6/library\std\src\sys\pal\windows\thread.rs @ 72]
Let's click on these stack entry source information and see what happens
From this stack we can see that the last of rust source before it goes into the Windows Kernel is the call to fn Thread::join().
Sometimes I would like to see what takes place in these functions that I call (or that I called on my behalf), but don't know the implementation.
They just might give me some hints about their implementation that would help me understand why my code behaves as it does.
Go ahead and click on the 02, the very first two characters on this stack entry
Or click on the original source path as shown after the function name on the same stack entry.
WinDBG will work its magic and translate from the address contained on the stack to the source file and line number on your disk and open the source file for your enjoyment.
Because the rwindbg script setup our source path and we did rustup component add rust-src during setup, you can click on the source path between the square brackets above and see what is the implementation of fn join():
    pub fn join(self) {
        let rc = unsafe { c::WaitForSingleObject(self.handle.as_raw_handle(), c::INFINITE) };
>>>        if rc == c::WAIT_FAILED {
            panic!("failed to join on thread: {}", io::Error::last_os_error());
        }
    }
So after our script setup, WinDBG knows how to translate the source filename contained in the PDB for std implementation and our current download location for the rust-src component. From:
/rustc/9b00956e56009bab2aa15d7bff10916599e3d6d6/library\std\src\sys\pal\windows\thread.rs
to
C:\Users\opedr\.rustup\toolchains\stable-x86_64-pc-windows-msvc\lib\rustlib\src\rust\library\std\src\sys\pal\windows\thread.rs
What is the meaning of the prompt "0:000>" on the command field?
Notice that when we originally did our "~" the first time around this was the WinGDB prompt:
0:000> ~*kand now, this is the prompt:
0:004> ~*kIn WinDbg, the command prompt numbers provide information about the debugging session context:
- First Number (System Number): This number indicates the system being debugged, and is only displayed when WinDbg is attached to multiple systems. If you're debugging a single system, this number is usually 0.
- Second Number (Process Number): This number represents the currently active process within the system. Processes are identified by unique numbers, and WinDbg displays the number of the process you're currently inspecting or manipulating.
- Third Number (Thread Number): This number identifies the currently active thread within the selected process. Threads are like smaller units of execution within a process, and WinDbg shows the number of the thread you're focusing on.
Since we our session did not start using more than one system, WinDBG defaults to using (process number):(thread number)> as prompt.
So, how big is our thread's stack anyway?
Next, let's take a look at our Thread Execution Block. The TEB keeps information like the values of the CPU registers, the last time the thread was interrupted, the stack limits, ...
0:004> .lastevent
Last event: 722c.31fc: Stack overflow - code c00000fd (first chance)
  debugger time: Sat May 25 15:35:47.056 2024 (UTC + 2:00)
0:004> !teb
TEB at 0000004e3b1c4000
    ExceptionList:        0000000000000000
    StackBase:            0000004e3af90000
    StackLimit:           0000004e3af81000
    SubSystemTib:         0000000000000000
    FiberData:            0000000000001e00
    ArbitraryUserPointer: 0000000000000000
    Self:                 0000004e3b1c4000
    EnvironmentPointer:   0000000000000000
    ClientId:             000000000000722c . 00000000000031fc
    RpcHandle:            0000000000000000
    Tls Storage:          000001a2802cefe0
    PEB Address:          0000004e3b1bb000
    LastErrorValue:       0
    LastStatusValue:      c000000d
    Count Owned Locks:    0
    HardErrorMode:        0
0:004> ? 000004e3af90000 - 0000004e3af81000
Evaluate expression: 61440 = 00000000`0000f000
So, from looking at the TEB, it tells me that my thread stack is actually 61440 bytes.
That is exactly 60 KiB. Remember that a stack is always [[committed stack][page guard] reserved stack].
That would make our stack be 64 KiB total size. Even though in code we asked for a (8 * 1024) stack.
    // Create a builder for the thread
    let builder = thread::Builder::new()
        .name("thread1".to_string()) // Set thread name
        .stack_size(8 * 1024);  // set for a small stack (default for Windows processes is 1 MiB, minimum is 4 KiB)
Another mistery.
Let's see what are our minimum stack requirements for our thread
Our stack minimum requirements can be gleamed by seeing what is our threads stack usage by the time we call factorial() the first time. Let's exit our current debugging session and start a new one:
rwindbg target/debug/stack_overflow.exe


0:000> * let's find out our factorial function's address to set a breakpoint
0:000> x stack*!*factorial*
00007ff6`25fa8590 stack_overflow!stack_overflow::factorial (struct stack_overflow::FactorialArgument *)


0:000> * set the breakpoint
0:000> bp stack_overflow!stack_overflow::factorial
0:000> bl
     0 e Disable Clear  00007ff6`25fa8590     0001 (0001)  0:**** stack_overflow!stack_overflow::factorial


0:000> * let the program run until brekapoint is reached
0:000> gn
Breakpoint 0 hit
stack_overflow!stack_overflow::factorial:
00007ff6`25fa8590 4881ec580c0000  sub     rsp,0C58h


0:000> * what is our stack at this point?
0:004> k
 # Child-SP          RetAddr               Call Site
00 0000003c`1e7aedd8 00007ff6`25fa5198     stack_overflow!stack_overflow::factorial [R:\repo\rust-windbg\bug_samples\stack_overflow.rs @ 36]
01 0000003c`1e7aede0 00007ff6`25faa279     stack_overflow!stack_overflow::main::closure$0+0xc8 [R:\repo\rust-windbg\bug_samples\stack_overflow.rs @ 28]
02 (Inline Function) --------`--------     stack_overflow!core::hint::black_box [/rustc/9b00956e56009bab2aa15d7bff10916599e3d6d6\library\core\src\hint.rs @ 337]
03 0000003c`1e7afb10 00007ff6`25fa27d9     stack_overflow!std::sys_common::backtrace::__rust_begin_short_backtrace<stack_overflow::main::closure_env$0,tuple$<> >+0x9 [/rustc/9b00956e56009bab2aa15d7bff10916599e3d6d6\library\std\src\sys_common\backtrace.rs @ 158]
04 0000003c`1e7afb40 00007ff6`25fa4bc9     stack_overflow!std::thread::impl$0::spawn_unchecked_::closure$1::closure$0<stack_overflow::main::closure_env$0,tuple$<> >+0x9 [/rustc/9b00956e56009bab2aa15d7bff10916599e3d6d6\library\std\src\thread\mod.rs @ 529]
05 0000003c`1e7afb70 00007ff6`25fa39bd     stack_overflow!core::panic::unwind_safe::impl$25::call_once<tuple$<>,std::thread::impl$0::spawn_unchecked_::closure$1::closure_env$0<stack_overflow::main::closure_env$0,tuple$<> > >+0x9 [/rustc/9b00956e56009bab2aa15d7bff10916599e3d6d6\library\core\src\panic\unwind_safe.rs @ 273]
06 0000003c`1e7afba0 00007ff6`25fa3b33     stack_overflow!std::panicking::try::do_call<core::panic::unwind_safe::AssertUnwindSafe<std::thread::impl$0::spawn_unchecked_::closure$1::closure_env$0<stack_overflow::main::closure_env$0,tuple$<> > >,tuple$<> >+0x1d [/rustc/9b00956e56009bab2aa15d7bff10916599e3d6d6\library\std\src\panicking.rs @ 554]
07 0000003c`1e7afbf0 00007ff6`25fa3926     stack_overflow!std::panicking::try::do_catch<core::panic::unwind_safe::AssertUnwindSafe<std::thread::impl$7::drop::closure_env$0<tuple$<> > >,tuple$<> >+0xc3
08 0000003c`1e7afc40 00007ff6`25fa265a     stack_overflow!std::panicking::try<tuple$<>,core::panic::unwind_safe::AssertUnwindSafe<std::thread::impl$0::spawn_unchecked_::closure$1::closure_env$0<stack_overflow::main::closure_env$0,tuple$<> > > >+0x26 [/rustc/9b00956e56009bab2aa15d7bff10916599e3d6d6\library\std\src\panicking.rs @ 516]
09 (Inline Function) --------`--------     stack_overflow!std::panic::catch_unwind+0x5 [/rustc/9b00956e56009bab2aa15d7bff10916599e3d6d6\library\std\src\panic.rs @ 146]
0a 0000003c`1e7afcb0 00007ff6`25fa61ae     stack_overflow!std::thread::impl$0::spawn_unchecked_::closure$1<stack_overflow::main::closure_env$0,tuple$<> >+0xfa [/rustc/9b00956e56009bab2aa15d7bff10916599e3d6d6\library\std\src\thread\mod.rs @ 527]
0b 0000003c`1e7afde0 00007ff6`25fb509c     stack_overflow!core::ops::function::FnOnce::call_once<std::thread::impl$0::spawn_unchecked_::closure_env$1<stack_overflow::main::closure_env$0,tuple$<> >,tuple$<> >+0xe [/rustc/9b00956e56009bab2aa15d7bff10916599e3d6d6\library\core\src\ops\function.rs @ 250]
0c 0000003c`1e7afe20 00007ff8`7146257d     stack_overflow!std::sys::pal::windows::thread::impl$0::new::thread_start+0x4c [/rustc/9b00956e56009bab2aa15d7bff10916599e3d6d6/library\std\src\sys\pal\windows\thread.rs @ 54]
0d 0000003c`1e7afeb0 00007ff8`726aaa48     KERNEL32!BaseThreadInitThunk+0x1d
0e 0000003c`1e7afee0 00000000`00000000     ntdll!RtlUserThreadStart+0x28


0:004> * lets look at our thread environment block and our current stack point
0:004> !teb
TEB at 0000003c1e9ec000
    ExceptionList:        0000000000000000
    StackBase:            0000003c1e7b0000
    StackLimit:           0000003c1e7ac000
    SubSystemTib:         0000000000000000
    FiberData:            0000000000001e00
    ArbitraryUserPointer: 0000000000000000
    Self:                 0000003c1e9ec000
    EnvironmentPointer:   0000000000000000
    ClientId:             0000000000006488 . 0000000000006c84
    RpcHandle:            0000000000000000
    Tls Storage:          0000014ece8be3a0
    PEB Address:          0000003c1e9e3000
    LastErrorValue:       0
    LastStatusValue:      c000000d
    Count Owned Locks:    0
    HardErrorMode:        0


0:004> * the 'r' command shows our CPU's registers for the current thread context; rsp is our stack pointer register
0:004> r
rax=0000003c1e7af670 rbx=0000000000000000 rcx=0000003c1e7af670
rdx=0000003c1e7af180 rsi=0000014ece8be350 rdi=0000000000000000
rip=00007ff625fa8590 rsp=0000003c1e7aedd8 rbp=0000003c1e7afc30
 r8=00000000000000f0  r9=0000000000000100 r10=00007ff85e3c0000
r11=00007ff85e3d1335 r12=0000000000000000 r13=0000000000000000
r14=0000000000000000 r15=0000000000000000
iopl=0         nv up ei pl nz na po nc
cs=0033  ss=002b  ds=002b  es=002b  fs=0053  gs=002b             efl=00000206
stack_overflow!stack_overflow::factorial:
00007ff6`25fa8590 4881ec580c0000  sub     rsp,0C58h


0:000> * let's calculate how many bytes we are using of our stack at this point (teb.StackBase - rsp)
0:004> ? 0000003c1e7b0000 - 0000003c1e7aedd8
Evaluate expression: 4648 = 00000000`00001228


0:000> * as you can see, we can even use the register name itself on the expression
0:004> ? 0000003c1e7b0000 - rsp
Evaluate expression: 4648 = 00000000`00001228

0:000> * final answer: when first called fn factorial(), our thread stack usage is 4_648 bytes
So when we first call factorial in our thread, this thread's stack usage is 4648 bytes, so it sounds reasonable to request a stack size that is twice as large.
Next, I get curious and check the TEB for the main thread.
Reason being, I know from experience that Windows assigns a 1 MiB stack size for an executable. That becomes the default size for all threads created unless they change it during creation.0:004> ~0s
ntdll!NtWaitForSingleObject+0x14:
00007ffe`ac2af9d4 c3 ret
0:000> !teb
TEB at 0000004e3b1bc000
ExceptionList: 0000000000000000
StackBase: 0000004e3af80000
StackLimit: 0000004e3af7c000
SubSystemTib: 0000000000000000
FiberData: 0000000000001e00
ArbitraryUserPointer: 0000000000000000
Self: 0000004e3b1bc000
EnvironmentPointer: 0000000000000000
ClientId: 000000000000722c . 000000000000206c
RpcHandle: 0000000000000000
Tls Storage: 000001a2802c5590
PEB Address: 0000004e3b1bb000
LastErrorValue: 0
LastStatusValue: 0
Count Owned Locks: 0
HardErrorMode: 0
0:000> ? 0000004e3af80000 - 0000004e3af7c000
Evaluate expression: 16384 = 00000000`00004000
Interesting, the TEB says that the stack for the main thread is just 16 KiB.
Researching further, I used the command dumpbin to inspect our executable:
(On my system, I find it here "C:\Program Files\Microsoft Visual Studio\2022\Community\VC\Tools\MSVC\14.39.33519\bin\Hostx64\x64\dumpbin.exe")
r:\repo\rust-windbg>dumpbin /headers target\debug\stack_overflow.exe | findstr /c:"size of stack" /c:"Dump of file"
Dump of file target\debug\stack_overflow.exe
          100000 size of stack reserve
            1000 size of stack commit
This means our thread index 0 must actually have a 1 MiB thread stack size, of which only 0x1000 bytes (16 KiB) are committed on startup.
So it seems that the TEB only reflects the committed stack in its data.
I am starting to believe that, once the guard page exception gets thrown:
- the kernel checks that the total reserved amount for the stack has not been reached
- commits the current guard page
- makes the next page the new guard page
- updates the TEB
- and finally resumes this thread's execution by marking it ready so the scheduler will pick it up next time a CPU is available
Checking the WinDBG help file with ".hh stack" takes us to the article titled "Debugging a Stack Overflow".
According to this article there are three reasons a user-thread can encounter a stack overflow condition:
- A thread uses the entire stack reserved for it. This is often caused by infinite recursion.
- A thread cannot extend the stack because the page file is maxed out, and therefore no additional pages can be committed to extend the stack.
- A thread cannot extend the stack because the system is within the brief period used to extend the page file.
The article also hints that the stack overflow is found when executing a function named _chkstk(). This function is supplied as part of the C/C++ Runtime.
The C++ compiler emits code that calls it_chkstk() at the top of every function it generates. It access the highest stack address known on entry, e.g. accessing the last defined local variable.
This will succeed or generate a page guard exception, which will force the stack to be extended prior to the function executing any of its code that depends on those local variables being there.
This article also has some techniques using WinDBG commands and offsets into the TEB data structure to calculate the actual stack extent, but the examples shown are for 32 bit OS and I am sure my 64 bit OS has different offsets. I prefer to write a function in Rust that can inquire the OS what is are the actual stack extents for the current thread.
Let's print the actual stack size by asking the OS what they are
I generated a stack_overflow_v2 program with a print_stack(). It now prints the stack extents for both the main thread and the thread created with a smaller stack:r:\repo\rust-windbg>cargo run --release --bin stack_overflow_v2
Finished `release` profile [optimized] target(s) in 0.49s
Running `target\release\stack_overflow_v2.exe`
Hello from main!
print_stack_extents_win: Stack base address : 0x000000eeeb220000
print_stack_extents_win: Stack limit address: 0x000000eeeb320000
print_stack_extents_win: Stack extent : 1_048_576 (0x100_000)
Hello from thread1!
print_stack_extents_win: Stack base address : 0x000000eeeb320000
print_stack_extents_win: Stack limit address: 0x000000eeeb330000
print_stack_extents_win: Stack extent : 65_536 (0x10_000)
Enter a non-negative integer: 100
The factorial of 100 is: 0
r:\repo\rust-windbg>cargo run --bin stack_overflow_v2
Finished `dev` profile [unoptimized + debuginfo] target(s) in 0.15s
Running `target\debug\stack_overflow_v2.exe`
Hello from main!
print_stack_extents_win: Stack base address : 0x00000025c94f0000
print_stack_extents_win: Stack limit address: 0x00000025c95f0000
print_stack_extents_win: Stack extent : 1_048_576 (0x100_000)
Hello from thread1!
print_stack_extents_win: Stack base address : 0x00000025c95f0000
print_stack_extents_win: Stack limit address: 0x00000025c9600000
print_stack_extents_win: Stack extent : 65_536 (0x10_000)
Enter a non-negative integer: 100
thread 'thread1' has overflowed its stack
error: process didn't exit successfully: `target\debug\stack_overflow_v2.exe` (exit code: 0xc00000fd, STATUS_STACK_OVERFLOW)
Interesting that the results still differ slightly between --release and dev targets.
At least the stacks extents are the same for both cases.
It is also interesting to notice that the stacks are located next to each other.
For both targets, the stack for thread1 starts where the stack for the main thread ends.
They are contiguous in memory. We should not rely on this information but it is interesting to know that this takes place.
Let's dig deeper and see when it runs out of stack by inspecting function local variables
First, let's revisit the stack of our faulting thread:* set our current thread to be the faulting thread
~#s
* show the stack
~k
Notice first two characters on each stack entry. That is the frame index. Let's look at the first
0:004> * make frame 01 the current frame; we will be able to see the local variables at that point in time
0:004> .frame 1
01 00000014`63127180 00007ff6`25fa86a5     stack_overflow!stack_overflow::factorial+0x115 [R:\repo\rust-windbg\bug_samples\stack_overflow.rs @ 42]


0:004> * what are out local variables? instead of the 'dv' command you can also use the 'Local Variables' icon on the toolbar (hover over to see their names)
0:004> dv
            arg = 0x00000014`63128638
        new_arg = struct stack_overflow::FactorialArgument


0:004> * here it becomes easier to click on the `arg` link on WinDBG UI to see it's value, so I do it
0:004> * (by the way, the command that you would have to type to see the value gets displayed when you click the link)
0:004> dx -r1 ((stack_overflow!stack_overflow::FactorialArgument *)0x1463128638)
((stack_overflow!stack_overflow::FactorialArgument *)0x1463128638)                 : 0x1463128638 [Type: stack_overflow::FactorialArgument *]
    [+0x000] array            [Type: unsigned __int64 [127]]
    [+0x3f8] idx              : 0x5b [Type: unsigned __int64]
0:004> * seems like when it runs out of stack, we were processing 91 (0x5b)
0:004> * so we should have on the stack call with arg values 100, 99, 98, ... until 91

0:004> * next I click on `new_arg` link on WinDBG UI
0:004> dx -r1 (*((stack_overflow!stack_overflow::FactorialArgument *)0x14631271e0))
(*((stack_overflow!stack_overflow::FactorialArgument *)0x14631271e0))                 [Type: stack_overflow::FactorialArgument]
    [+0x000] array            [Type: unsigned __int64 [127]]
    [+0x3f8] idx              : 0x5a [Type: unsigned __int64]
0:004> * seems like when it run out of stack, we were preparing the argument to process 90 (0x5a)


0:004> * I also click on the `array` link on WinDBG UI
0:004> dx -r1 (*((stack_overflow!unsigned __int64 (*)[127])0x14631271e0))
(*((stack_overflow!unsigned __int64 (*)[127])0x14631271e0))                 [Type: unsigned __int64 [127]]
    [0]              : 0x0 [Type: unsigned __int64]
    [1]              : 0x0 [Type: unsigned __int64]
    [2]              : 0x0 [Type: unsigned __int64]
    ...
    [89]             : 0x0 [Type: unsigned __int64]
    [90]             : 0x5b [Type: unsigned __int64]
    [91]             : 0x0 [Type: unsigned __int64]
    ...
    [98]             : 0x0 [Type: unsigned __int64]
    [99]             : 0x0 [Type: unsigned __int64]
    [...]            [Type: unsigned __int64 [127]]
0:004> * WinDBG printed the first 100 entries and the last one has an index of '[...]'


0:004> * clicking on the link '[...]', it shows the next 100 entries (but we only have 26 more)
0:004> dx -r1  -c 100 (*((stack_overflow_v2!unsigned __int64 (*)[127])0xb36cb372d0))
(*((stack_overflow_v2!unsigned __int64 (*)[127])0xb36cb372d0))                 [Type: unsigned __int64 [127]]
    [100]            : 0x0 [Type: unsigned __int64]
    [101]            : 0x0 [Type: unsigned __int64]
    ...
    [125]            : 0x0 [Type: unsigned __int64]
    [126]            : 0x0 [Type: unsigned __int64]
Let's take a look at why the RELEASE target gives a different error. I execute the latest version of the program in release and see that it still behave a bit differently:
r:\repo\rust-windbg>cargo run --release --bin stack_overflow_v2
    Finished `release` profile [optimized] target(s) in 0.01s
     Running `target\release\stack_overflow_v2.exe`
Hello from main!
print_stack_extents_win: Stack base address : 0x000000becb440000
print_stack_extents_win: Stack limit address: 0x000000becb540000
print_stack_extents_win: Stack extent       : 1048576  (0x100000)
Hello from thread1!
print_stack_extents_win: Stack base address : 0x000000becb540000
print_stack_extents_win: Stack limit address: 0x000000becb550000
print_stack_extents_win: Stack extent       : 65536  (0x10000)
Enter a non-negative integer: 100
The factorial of 100 is: 0
I then proceed to run it under the debugger using the script:
r:\repo\rust-windbg>rwindbg target\release\stack_overflow_v2.exe
start windbg -W Default -c "$><C:\Users\opedr\AppData\Local\Temp\rwindbg.windbg" target\release\stack_overflow_v2.exe
In the debugger, I click File => Open Source File ... => navigate to bug_samples => change the "Files of type" field to "All Files" to see the rust sources => select stack_overflow_v2.rs => click Open.
Next I go to the "fn factorial" by clicking "CTRL+f" and typing "fn factorial" on the "Find what" field plus "ENTER" to execute the search.
Once found, if you look at the bottom right of the WinDBG window, you will see "ln: 43" indicating where the "fn factorial" is located.
With my cursor on that line, I click on F9, which will set a breakpoint, but I get a dialog that says:
( that is literally what you get if you click "CTRL+SHIFT+c" with that dialog in focus )
---------------------------
WinDbg:10.0.22621.2428 AMD64
---------------------------
Code not found, breakpoint not set
---------------------------
OK
---------------------------
Most likely the reason is that the RELEASE mode optimizations inlined my function so the debugger cannot get a good handle where the function begins now.
I would like to set a breakpoint on that function, so I change my Cargo.toml file to have this entry:
[profile.release]
lto = true          # Enable Link-Time Optimization for smaller binaries; good practice when using large crates like windows
debug = true        # enable symbols for release builds
Once I rebuild the release target and rerun with WinDBG, I now have a result for this command:
0:000> x stack*!*factorial*
00007ff6`05ba1eac stack_overflow_v2!stack_overflow_v2::factorial =  (inline caller) stack_overflow_v2!std::sys_common::backtrace::__rust_begin_short_backtrace<stack_overflow_v2::main::closure_env$0,tuple$<> >+eac
The "(inline caller)" tells me that the Rust compiler inlined my factorial function.
That might be good for performance but not very helpful for debugging.
So I go back to the source and add a hint to no longer inline this function.
#[inline(never)]
fn factorial(arg: FactorialArgument) -> u64 {
After I rebuild and rerun it with WinDBG I now get this result, which indicates my function is not longer inlined:
0:000> x stack*!*factorial*
00007ff7`d66d3510 stack_overflow_v2!stack_overflow_v2::factorial (void)
This time, after I search for "fn factorial", which is now found on line 44, and type F9, the UI reflects that a breakpoint was added by showing that line with a red background. Executing "bl" also shows that we now have a breakpoint there:
0:000> bl
     0 e Disable Clear  00007ff7`d66d3510     0001 (0001)  0:**** stack_overflow_v2!stack_overflow_v2::factorial
How does a debugger implement breakpoints or single instruction stepping?
Well there are some possibilities. The CPU normally has what is a called a hardware debug register, where an address can be loaded and when the instruction pointer has the same value of this register, it generates an interrupt which the debugger process handles and realizes that a location was reached. On the Intel architecture there are four of these registers.
But I can set many more than 4 breakpoints and the code still stops there.
What a debugger does is to replace the first byte of the instruction at the breakpoint location given with the one byte opcode "int 3" and it remembers the overwritten byte.
Once the code resumes running, it will stop when the "int 3" instruction gets executed, the debugger handler once again replaces the "int 3" it had inserted with the original byte code and return to the user prompt in the debugger UI.
If the user selects "g" to continue execution, the debugger will replace the next instruction first byte with an "int 3", resume execution (which will only execute a single instruction) and when when handling the next instruction's "int 3", re-replace at the breakpoint location the "int 3" (after the instruction was executed, therefore re-enabling that breakpoint), replace the current instruction on the current instruction with the original byte that was there and then resume execution once again. This time the program will resume and run until another debugger event happens.
As you can see this is also how the debugger can implement single step instruction execution as well, by replacing (and remembering) the first byte of the next opcode with "int 3" and resuming execution of the program. Rinse and repeat and you get single instruction stepping.
From our previous runs, I now that the stack overflow happens on the 8th call to factorial, so I modify the breakpoint to conditionally stop only on the 8th pass:
0:000> bp0 stack_overflow_v2!stack_overflow_v2::factorial 8 "dv"
breakpoint 0 exists, redefining
0:000> bl
     0 e Disable Clear  00007ff7`d66d3510     0008 (0008)  0:**** stack_overflow_v2!stack_overflow_v2::factorial "dv"
I proceed with the execution, but get a surprise result.
The function once again completes without reaching the 8th breakpoint.
The "bl" command shows that it the count reached 7 before the program ended.
0:000> gn
ModLoad: 00007ffe`90c80000 00007ffe`90c98000   C:\WINDOWS\SYSTEM32\kernel.appcore.dll
ModLoad: 00007ffe`937f0000 00007ffe`93897000   C:\WINDOWS\System32\msvcrt.dll
ntdll!NtTerminateProcess+0x14:
00007ffe`948efed4 c3              ret
0:000> k
 # Child-SP          RetAddr               Call Site
00 000000f9`178ffc68 00007ffe`948a0ca8     ntdll!NtTerminateProcess+0x14
01 000000f9`178ffc70 00007ffe`93737fab     ntdll!RtlExitUserProcess+0xb8
02 000000f9`178ffca0 00007ffe`923bbed8     KERNEL32!ExitProcessImplementation+0xb
03 000000f9`178ffcd0 00007ffe`923bc099     ucrtbase!exit_or_terminate_process+0x50
04 000000f9`178ffd00 00007ff7`d66eb773     ucrtbase!common_exit+0x79
05 000000f9`178ffd60 00007ffe`9373257d     stack_overflow_v2!__scrt_common_main_seh+0x173 [D:\a\_work\1\s\src\vctools\crt\vcstartup\src\startup\exe_common.inl @ 295]
06 000000f9`178ffda0 00007ffe`948aaa48     KERNEL32!BaseThreadInitThunk+0x1d
07 000000f9`178ffdd0 00000000`00000000     ntdll!RtlUserThreadStart+0x28
0:000> bl
     0 e Disable Clear  00007ff7`d66d3510     0007 (0008)  0:**** stack_overflow_v2!stack_overflow_v2::factorial "dv"
The program ends. I check my breakpoint and its counter tells me that it passed the breakpoint 7 times and that it will stop on the 8th, but it never reached it. I then proceed to restart the process and reduce the count to 7 for the next run:
0:000> .restart
...
0:000> bp0 stack_overflow_v2!stack_overflow_v2::factorial 7 "dv"
breakpoint 0 exists, redefining
0:000> bl
     0 e Disable Clear  00007ff7`d66d3510     0007 (0007)  0:**** stack_overflow_v2!stack_overflow_v2::factorial "dv"
0:000> gn
I actually repeated this process multiple times, always with the same result, the pass counter is always one less that my target count when it would stop.
By modifying the input number entered, I realized that in Release mode, the compiler worked around my recursive code problem and the stack overflow no longer happens. What seems to happen now is a numeric overflow. My reasoning comes to this because the program will emit correct factorial values up to 65 as input, but it will return 0 for input 66 and above.
Learned that Rust does not perform overflow checking on Release targets by default due to performance reasons. But that we can enable that by changing our Cargo.toml file like this:
[profile.release]
lto = true                  # Enable Link-Time Optimization for smaller binaries; good practice when using large crates like windows
debug = 2                   # enable symbols for release builds
split-debuginfo = "packed"  # Store debug info in a separate file
overflow-checks = true      # enable arithmetic overflow checks ()
Be aware that adding lto will dramatically increase the link time. I had builds that take 1.5 seconds to complete under the profile.dev now take 15+ seconds after lto was added.
The Cargo.toml token setting of split-debuginfo = "packed" directs the Rust toolchain to extract debug information present in the object files (function address, variable offsets, line number to address mappings) to a separate symbol file that can then be made available to interested parties. Be aware that having this information makes it much easier to reverse engineer your executable. Also that different platforms provide different file format with this information:
| Platform | Toolchain | File Extension | Notes |
|---|---|---|---|
| Linux | GCC/Clang | .dwp | DWARF package file, a compressed format for storing DWARF debug information |
| macOS | Xcode | .dSYM | A bundle directory containing DWARF debug information and other files. The actual DWARF data is usually in a file named Contents/Resources/DWARF/[executable name] within the .dSYM bundle. |
| Windows | MSVC | .pdb | Program database file, a proprietary format for storing debug information used by Microsoft tools |
How to generate the most efficient working set for your code in Windows
War Story:
An interesting side-effect of enabling LTO is that each function will be compiled to its own file and accompanying metadata. This allows, on the Windows platform, for one to use the LINK /ORDER:@filename to control the order that symbols are resolved during linking. This provides a subtle way to define the order functions will be loaded into the final executable. Combined with a trace of a scenario run, preferably with counts for how many times each function was called. This trace file will naturally be created with the traces in the order function are called. One can then divide the trace file in two parts, sort the entries in the first half by count in ascending order and the second half in descending order to have a final order file that provides the most optimal working set for an executable. All the high usage functions are close by other high usage functions in the center of the executable and therefore stay in the working set. Initialization functions are loaded first, used and then the OS working set trimming algorithm removes them from memory. Having a highly used neighboor function no longer forces a function that gets used once during startup to stay in memory because of its popular neighboor. This technique made a famous CAD program (millions of copy sold!) once be able to run on laptops where it was not possible before because of page trashing taking place during execution. I named this sort a Bell Curve Sort, since it provided a bell shapped curve result based on the function count traces.
And here are some of the other differences between Debug and Release target processing in Rust projects:
| Feature | Cargo.toml token | Debug Build (default) | Release Build (default) |
|---|---|---|---|
| Overflow Checks | overflow-checks | ✅ | ❌ |
| Debug Assertions | debug_assert! | ✅ | ❌ |
| Code Optimization Level | opt-level | Low | High |
| Debug Symbols | debug | ✅ | ❌ |
| Bounds Checking for array/slice access | n/a | ✅ | ✅ |
| Iterator Debugging | n/a | ✅ | ❌ |
Explanation of Cargo.toml Tokens:
- overflow-checks: A boolean flag (true/false) in the [profile.release] section of your Cargo.toml file. Controls whether integer overflow checks are enabled in release builds.
- debug_assertions: This feature is implicitly enabled/disabled based on the build profile. There's no direct Cargo.toml token to control it.
- opt-level: An integer value (0-3) or the string "s" or "z" in the [profile] section of your Cargo.toml file. Controls the level of optimization applied by the compiler. Higher values mean more aggressive optimization.
- debug: An integer value (0-2) or the boolean values true/false in the [profile] section of your Cargo.toml file. Controls the level of debug information included in the compiled binary. Higher values mean more detailed debug information.
- bounds_checking: Similar to debug_assertions, this is tied to the build profile and not directly configurable.
- iterator_debug: Same as the previous two, it's controlled by the build profile.
Hopefully you get help from WinDBG to find details about why your Rust program behaves the way it does when running in Windows.
The truth is even though the Rust language has the dream that everything is under control and nothing bad outside of your programs control will happen if you just write safe code, reality keeps rearing its ugly head and reminding you that as professional software developers we have to have to handle all situations, expected and unexpected, to the best of our abilities and hopefully, for the benefit of our code users.
If you have ideas or situations that you think would help you better understand your program's behavior using WinDBG, by all means drop me a line or add an Issue to this GitHub project.
I will check from time to time the Issues list and see if I can extend the contents to cover your issue as well. PRs are also welcome.