This is a SRE test, but it is also an example of a monitoring stack tools with an application running.
What you will find here:
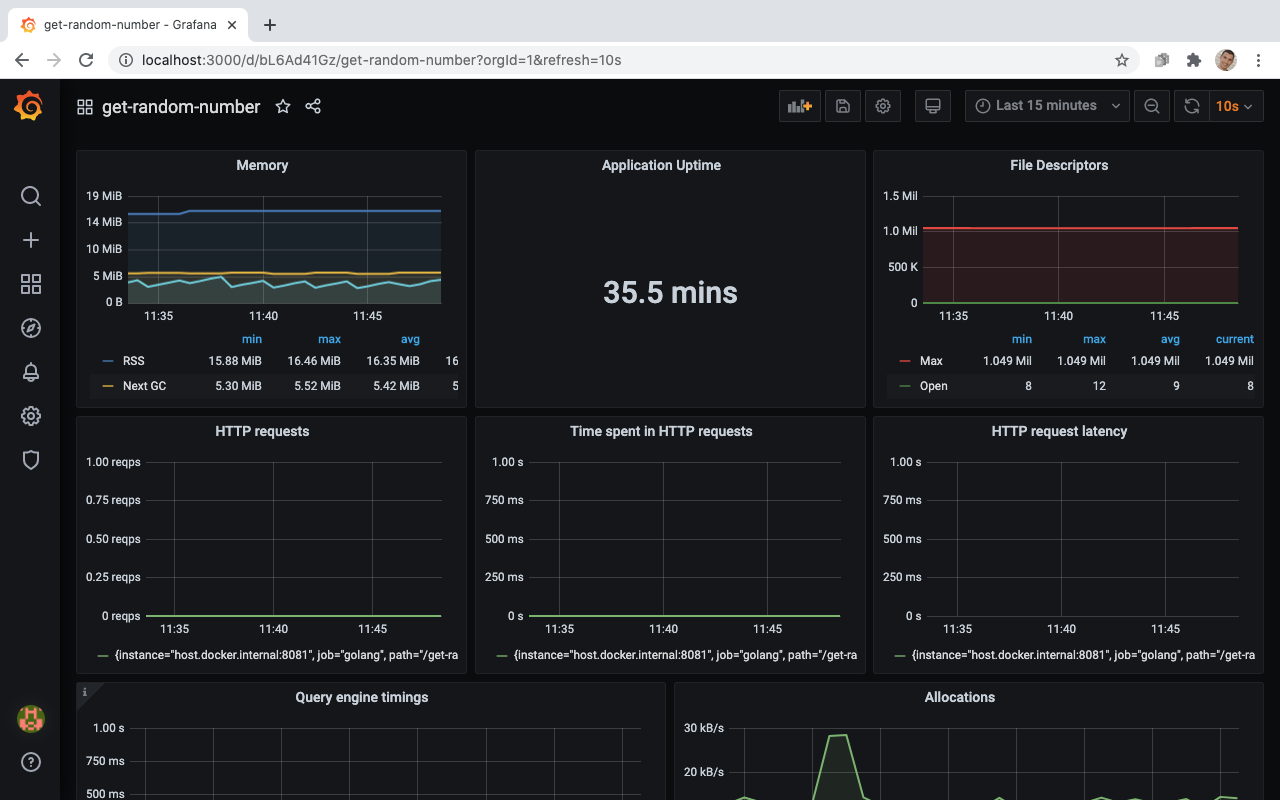
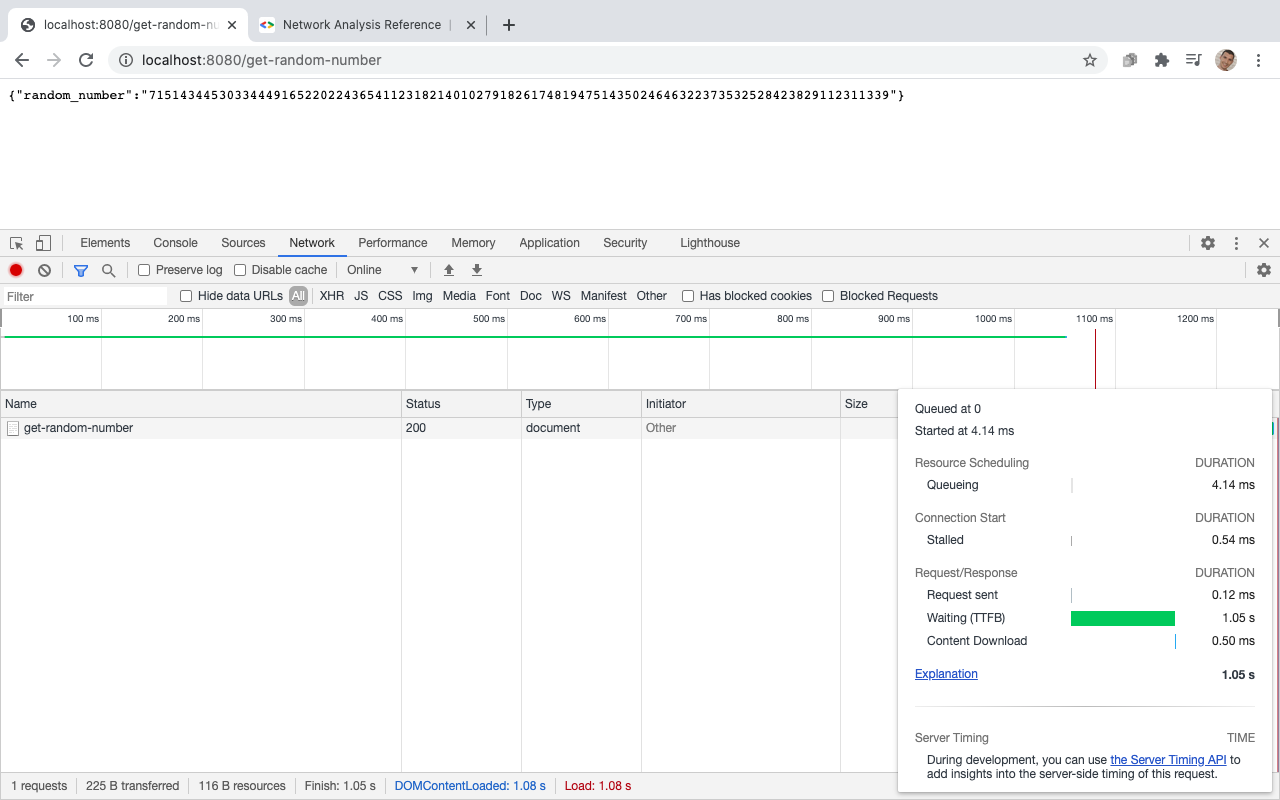
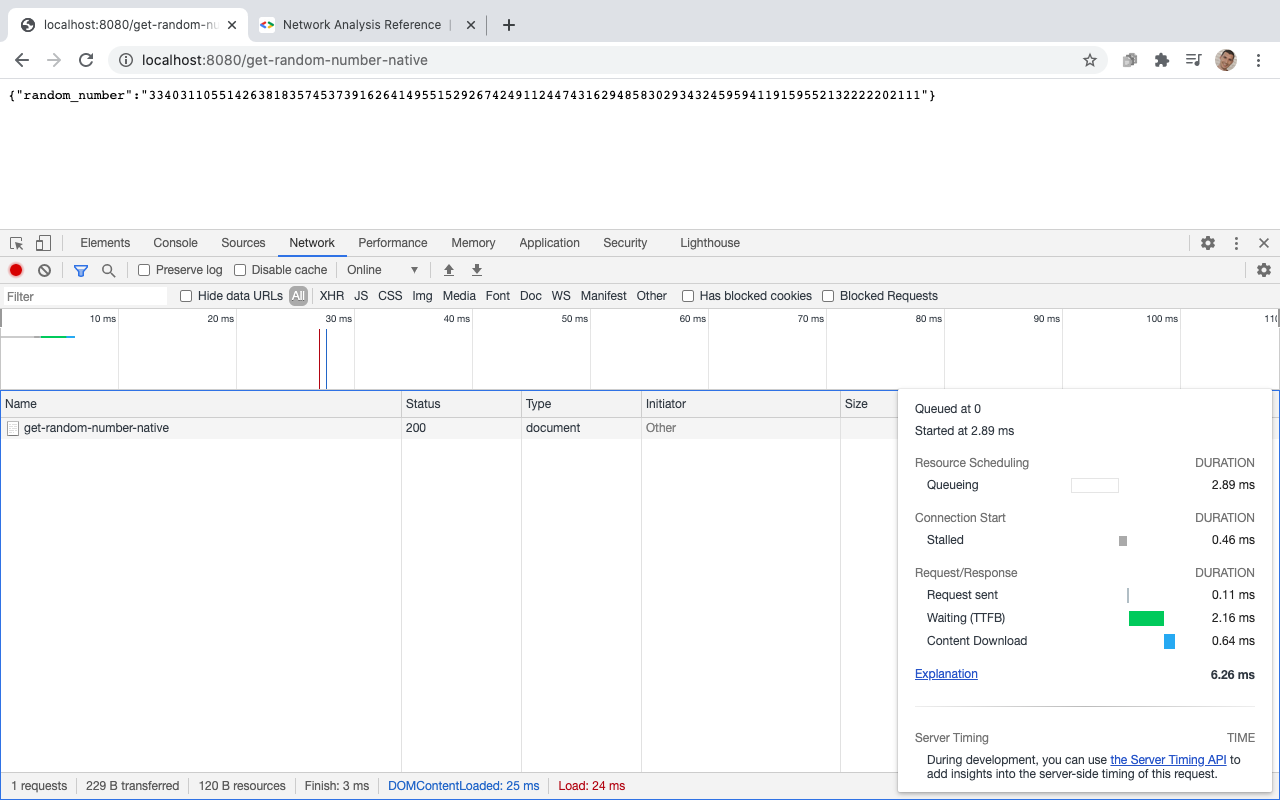
-A Golang Application: An application that has two endpoints, each endpoint has a strategy for generating a random number.
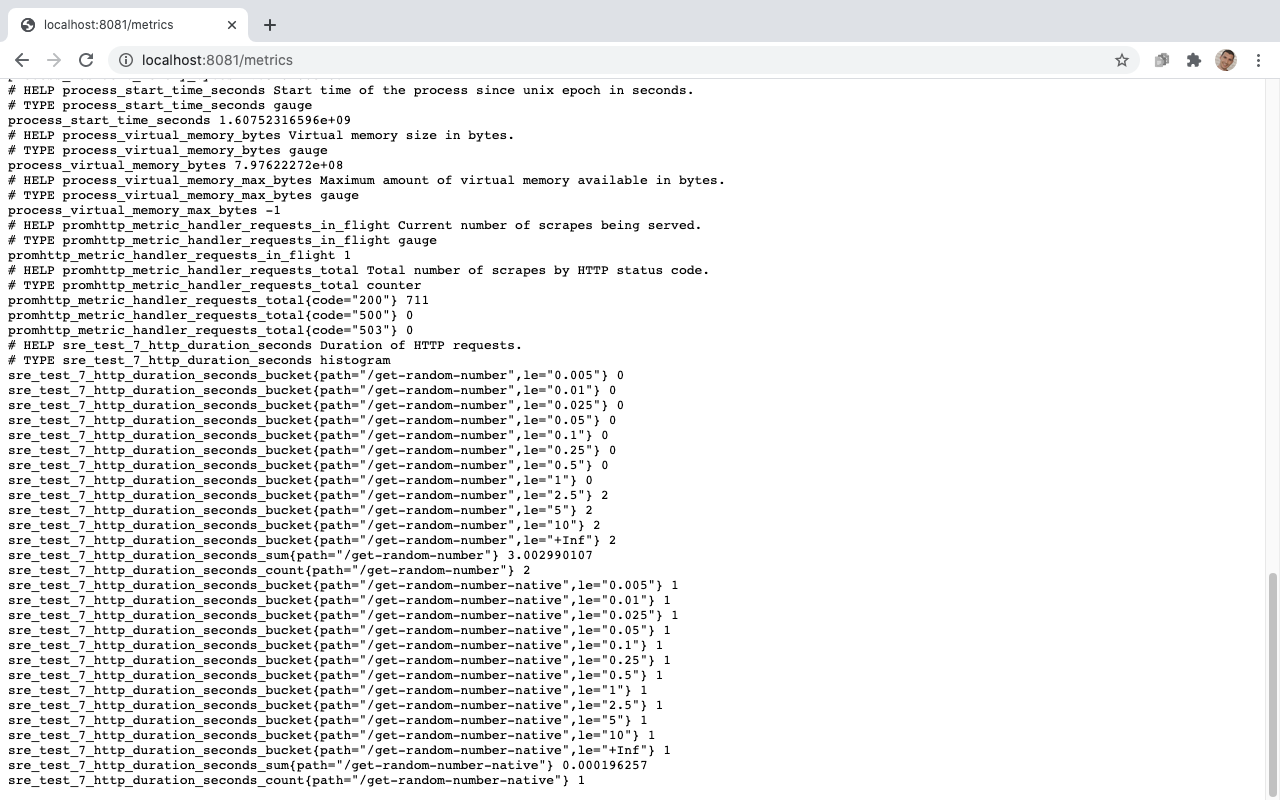
-This application provides performance metrics for each endpoint, so you can compare the two strategies using the data provided
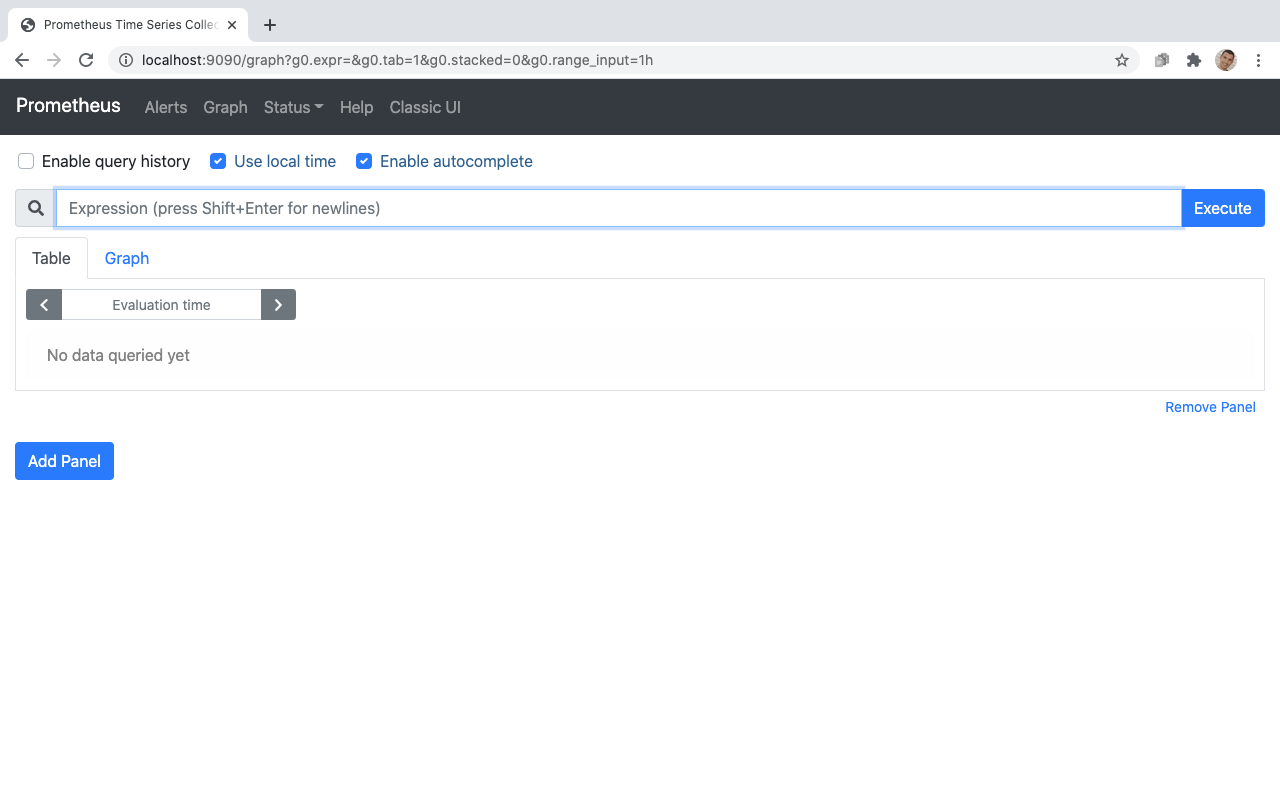
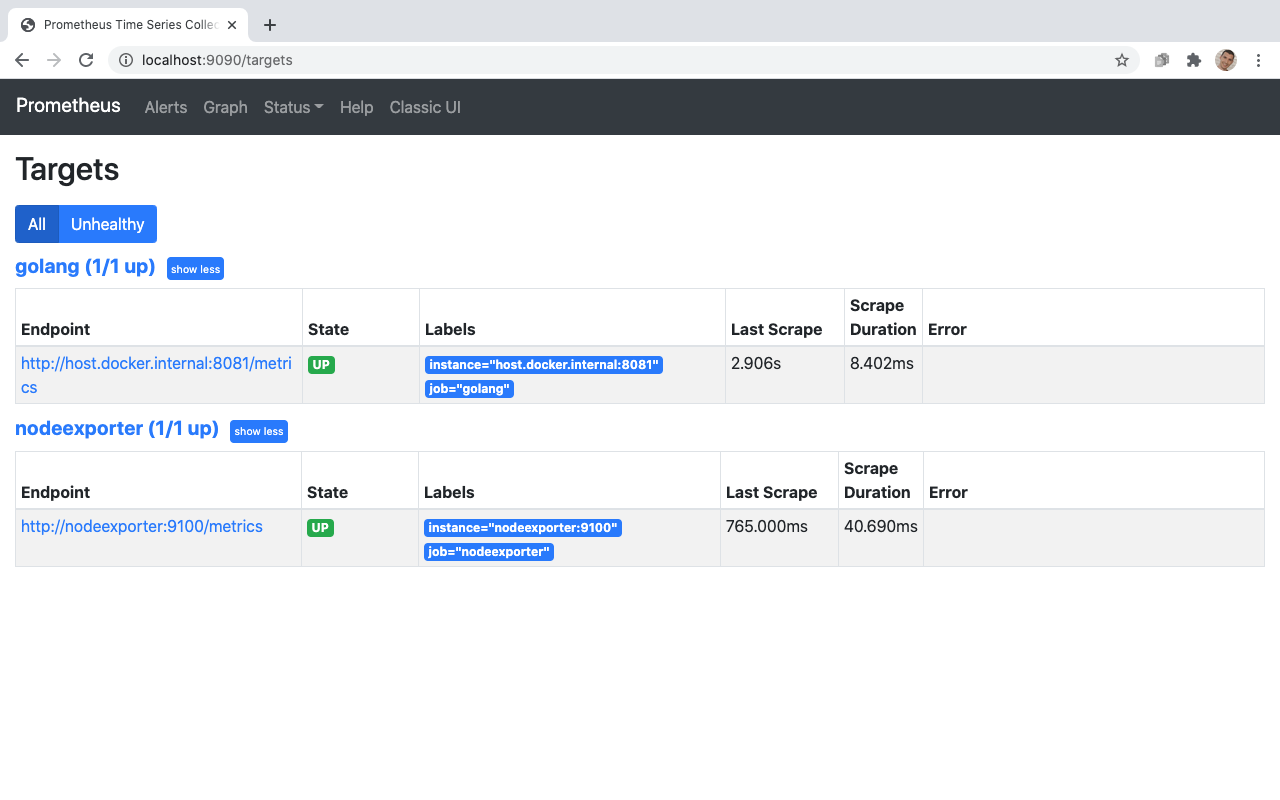
-An Event and Alert monitoring tool called Prometheus: This tool receives metrics and allow us to process and query this metrics, generating data to better understanding what happening with our application.
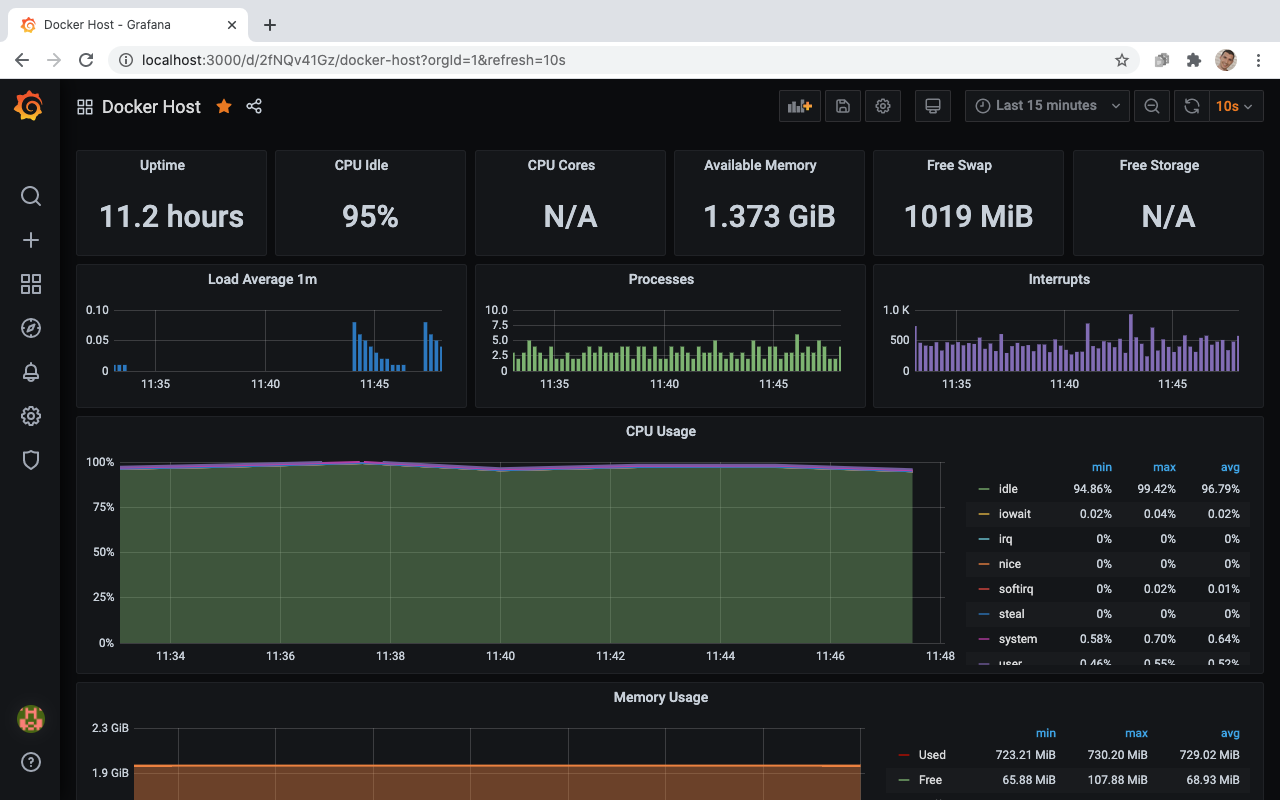
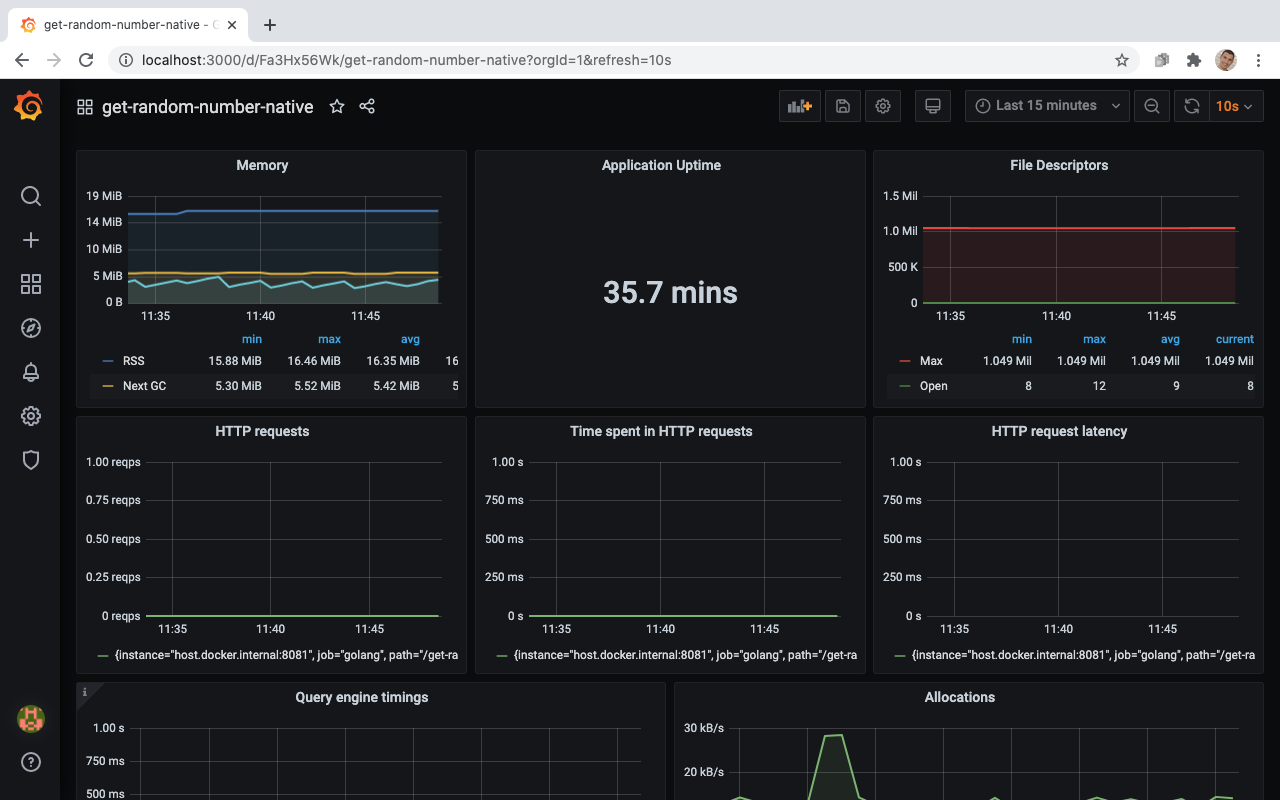
-A dashboard tool called Grafana: With Grafana we can representing in a visual way the data provided by Prometheus.
You also can check my journey here:
After you have installed docker-compose, we can get start:
docker-compose up -d