This tutorial will show you how to set up a custom Nucleome Browser session.
You will learn how to pre-processe publised data (e.g., population Hi-C and single-cell Hi-C from Stevens et al. 2017).
Then you will learn how to lauch a local data service for visualization custom tracks in Nucleome Browser.
We also provide a list of demo data and configuration file under the folder named demo_data
You can jump to the section named Starting the data service with demo data if you just want to know how to set up a local data service in your computer and visualize tracks on Nucleome Browser.
To start with, you will need to prepare a laptop or desktop on Linux or macOS and clone this repo to your machine. You will also need to pre-install the following software packages/tools for different operating systems.
Tips: For Windows machine, you need to install Windows Subsystem for Linux to pre-process the data. However, you can start the data service with demo data without the linux subsystem. You can go the section named Starting the data service with demo data to see video tutorial on Windows machine.
- terminal
- gzip
- tar
- awk (mawk/gawk should also work)
- sed
- Juicer Tools (https://github.com/aidenlab/juicer/wiki/Download), this tutorial is tested under Juicer Tool version 1.22.01
- fetchChromSizes and bedToBigBed (you can install these binaries built from http:https://hgdownload.cse.ucsc.edu/admin/exe/, we also provided them in the
scriptsfolder (e.g.,UCSC_Linux) - nucleserver (https://github.com/nucleome/nucleserver), this tutorial is tested under nucleserver version 0.2.6
Most of tools except for the Juicer Tools, fetchChromSizes, and bedToBigBed should be pre-installed for most Linux distributions.
You also need to download the right version of nucleserver (https://github.com/nucleome/nucleserver/releases) based on your machine operating system.
For Linux, you can get that information by typing dpkg --print-architecture in ther terminal.
Here, we download nucleserver and put it under the scripts folder.
- terminal
- gzip
- tar
- awk (mawk/gawk should also work)
- sed
- Juicer Tools (https://github.com/aidenlab/juicer/wiki/Download), this tutorial is tested under Juicer Tool version 1.22.01
- fetchChromSizes and bedToBigBed (you can install these binaries built from http:https://hgdownload.cse.ucsc.edu/admin/exe/, we also provided them in the
scriptsfolder (e.g.,UCSC_Linux) - nucleserver (https://github.com/nucleome/nucleserver), this tutorial is tested under nucleserver version 0.2.6
Most of tools except for the Juicer Tools, fetchChromSizes, and bedToBigBed should be pre-installed for most Linux distributions.
You also need to download the right version of nucleserver (https://github.com/nucleome/nucleserver/releases) based on your machine operating system.
For macOS, you can get that information by typing set | grep "MACHTYPE" in the terminal.
Here, we download nucleserver and put it under the scripts folder.
Tips: In macOS, you can open terminal by clicking the Launchpad icon in the Dock, typing terminal in the search field, then click
Terminal.
First, open terminal in Linux or macOS.
Then, create a new folder and use wget command to download the whole dataset from GEO to a local computer and named it GSE80280_RAW.tar as shown below:
# create a new folder
mkdir single_cell_hic
cd single_cell_hic
# Download data
wget -O GSE80280_RAW.tar "https://www.ncbi.nlm.nih.gov/geo/download/?acc=GSE80280&format=file"
Warning: Note that this will download a large single file of about 20Gb.
Next, you need to extract files from the tar file in the current directory:
# Extract file
tar -xvf GSE80280_RAW.tar
gzip -d *.gz
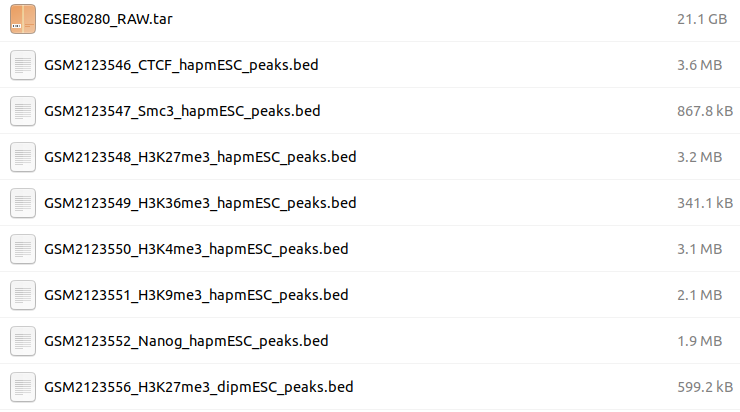
You should see multiple files in different formats with various suffixes, such as .bed, .pdb, etc as shown below.
Warning: Note that the folder will take about 43Gb after decompression.
In order to launch data service and visualize ChIP-seq peaks in Nucleome Browser, you need to pre-process data and convert them into standard formats (e.g., bigBed and bigWig file) supported by Nucleome Browser. You can do that using the tools fetchChromSizes and bedToBigBed provided from the UCSC Genome Browser and Blat application binaries built (http:https://hgdownload.cse.ucsc.edu/admin/exe) as shown below. We also provide binary executables inside the script folder.
Tips: You need to make fetchChromSizes and bigToBigBed executable using the command chmod (e.g., chmod +x bedToBigBed).
You can then use the following script to convert ChIP-seq peak bed file into bigBed file.
You should replace ChIP-Seq_peaks.bed with path of actual sample file such as /work/project/Tutorial-singleCellHiC/single_cell_hic/GSM2123550_H3K4me3_hapmESC_peaks.bed.
# Fetch chrom.sizes information
fetchChromSizes mm10 > mm10.chrom.sizes

# Add additional optional BED fields
# Replace "ChIP-Seq" with sample name, e.g., GSM2123558_H3K4me3_dipmESC
awk '{print $1"\t"$2"\t"$3"\t"$4"\t0\t.\t"$2"\t"$3"\t255,0,0"}' ChIP-Seq_peaks.bed > ChIP-Seq_peaks.detail.bed

# Create bigBed file
bedToBigBed ChIP-Seq_peaks.detail.bed mm10.chrom.sizes ChIP-Seq_peaks.bb
Tips: You can use for loop to efficiently convert multiple files at the same time. For example, the following commands will process all peaks inside folder
single_cell_hic.
for file in single_cell_hic/*.bed
do
    awk '{print $1"\t"$2"\t"$3"\t"$4"\t0\t.\t"$2"\t"$3"\t255,0,0"}' ${file} > ${file%.bed}.detail.bed
    bedToBigBed ${file%.bed}.detail.bed mm10.chrom.sizes ${file%.bed}.detail.bb
done
The Hi-C contact maps must be transformed into .hic format in order to display in Nucleome Browser. Here we suggest using Juicer tools (https://github.com/aidenlab/juicer) to create .hic files from the downloaded contact pair files.
To do that, the Hi-C contact pair file should be first converted into one of the formats as shown in the documentation of Juicer tools (https://github.com/aidenlab/juicer/wiki/Pre).
# Medium format (for single cell Hi-C)
<readname> <str1> <chr1> <pos1> <frag1> <str2> <chr2> <pos2> <frag2> <mapq1> <mapq2>

# Short with score format (for population Hi-C, which is already binned)
<str1> <chr1> <pos1> <frag1> <str2> <chr2> <pos2> <frag2> <score>
We provide customized script named create_single_cell_HiC.sh to convert population/single-cell Hi-C contact pairs to .hic files as shown below:
Tips: you may need to make
create_single_cell_HiC.shexecutable usingchmod +x scripts/create_single_cell_HiC.sh.
# Single cell Hi-C
./scripts/create_single_cell_HiC.sh Cell_X_contact_pairs.txt Cell_X /path_to_juicer_tools/juicer_tools.jar

# Population Hi-C
./scripts/create_population_HiC.sh GSM2123564_Haploid_mESC_population_hic.txt population_hic /path_to_juicer_tools/juicer_tools.jar
Tips: These two scripts also require an additional file called
chr_order, which specifies the list of chromosomes ID. We also provide this file in this repo.
The 3D genome structures for single cells are provided in pdb format, and you will need to convert them into nucle3d (https://github.com/nucleome/nucle3d) format.
We prove a customized script named pdb2Nucle3d.sh to do this step as shown below.
For each single cell, the pdb file contains 10 structures.
This script will generate 10 nucle3d files.
Note that this script can only apply to this specific dataset, and can not be used as a generic script to convert any PDB structure into nucle3d format.
# pdb to Nucle3d, replace Cell_X_genome_structure_model.pdb with real file, e.g., GSM2219497_Cell_1_genome_structure_model.pdb
./scripts/pdb2Nucle3d.sh Cell_X_genome_structure_model.pdb Cell_X
Now, you should have prepared all the data for visualization in Nucleome Browser. Next, you need to prepare a configuration file to start a data service so that Nucleome Browser can display these datasets. You will also need a cross-platform tool called nucleserver (https://github.com/nucleome/nucleserver). You can read more about how to use nucleserver through the GitHub link (https://github.com/nucleome/nucleserver). Here, we will briefly introduce how to use it for this tutorial.
Suppose you have put all generated files under a folder named NB_single_cell.
First, you need to create an Excel file (we have tested this using the LibreOffice software in Linux and ).
Create a new sheet called Config and put the following information inside this sheet as the figure shown below.
The first row is a header of this sheet.
The second row specifies the complete path of the folder.
You should replace the path with the real path based on your computer.

Tips: You can use the pwd command in Linux and macOS to find the complete path of the current folder.
Next, you need to create another sheet called Index and put in the following information.

Briefly, the first row is the header.
The first column indicates the genome assembly.
The second column represents the names of datasheet you will create soon.
The third column is used for future development, you can just put track here.
The fourth column is the column ID for the short label of the track.
The fifth column is the value IDs for uri, meta information, and long label.
As the above figure shows, you will need to create two datasheets, one called Hi_C and another called ChIP_seq.
All Hi-C tracks will be specified in the Hi_C datasheet.
All ChIP-seq tracks will be specified in the ChIP_seq datasheet.
In each datasheet, you need to provide four attributes for each track, including short label, uri (relative path to the file from the root path, see the Config sheet), meta link (can be URL or None if it is not available), and long label as shown below.


Finally, you can start a data service using nucleserver with the excel configuration file you just created.
# by default, data service will start with port 8611
./scripts/nucleserver start -i nucleser_config.xlsx
You should see the following logging information indicating that data service is successfully created.

You can then open a web browser (Google Chrome or Safari browser), and go to https://vis.nucleome.org.
Click the START button on the main page and then click the Genome Browser button at the bottom.
You can click the configuration button (step 1) on the top-right of the genome panel and select mm10 as the genome version in the track setting page.
In the dropdown menu below you should see two data sheets named Hi_C and ChIP_seq which contain data tracks you just created.
If these two data tracks do not appear, you can then try to manually add them by clicking the data server setting button (step 2) as shown below and adding http:https://127.0.0.1:8611 in the URI column (step 3).
If you see the Status column showing active after you click the update button (steps 4&5), it means that you have successfully added a local data service to Nucleome Browser.

Tips: You must use the HTTPS version of Nucleome Browser (https://vis.nucleome.org) to load a local data service. The HTTP version will not work due to the limitation of cross-origin resource sharing (CORS) restriction.
To add the 3D structure to Nucleome Browser, you also need to start a local data service. You can use any file server to host nucle3D files but we also provide a simple one in nucleserver. You can start a file server to host 3D genome structure models using the following command.
# Start a file server to host 3D genome structure models
./scripts/nucleserver file --root NB_single_cell/3d/ --port 8612
This will start a data service showing 3D structure file at http:https://127.0.0.1:8612/get.
You can see all nucle3d files here.
Then, you can create a new 3D structure panel in the Nucleome Browser and copy the link of nucle3d file (e.g., http:https://127.0.0.1:8612/get/Cell_1.model_1.nucle3d) and paste it to the data URL box on the 3D structure panel as shown below.

We have provided a demo data set (only Hi-C data on chromosome 19 is included to reduce data size) and corresponding excel configuration file to directly launch a local data service and explore features in Nucleome Browser.
You can see the following video tutorials for different operating systems and use the following text for reference.
- Linux machine video tutorial (https://youtu.be/FIEYzSO0G8g)
- macOS machine video tutorial (https://youtu.be/ej1uiDr5usg)
First, you need to open a terminal in Linux or macOS and get the complete path of the current folder.
In Linux and macOS, this can be done using the pwd command.
Importantly, you need to open the configuration file in the demo_data folder and put the complete path of the current folder into the B2 cell of the Config sheet as shown below
Tips: Do not forget to save the configuration file
Next, you need to download the right version of nucleserver (https://github.com/nucleome/nucleserver/releases) based on your machine operating system.
For macOS, you can get that information by typing set | grep "MACHTYPE" in the terminal.
For Linux, you can get that information by typing dpkg --print-architecture in ther terminal.
For Windows, we only has version for AMD64, which should work for most of Windows machines.
Here, we download nucleserver and put it under the scripts folder.
Then, you can start a data service using the following command in the terminal.
Tips: You may need to allow macOS to run nucleserver by opening the Apple menu > System Preferences > Security & Privacy > General tab and select allow nucleserver to run on your computer.
# make nucleserver executable using chmod
chmod +x ./scripts/nucleserver
# by default, data service will start with port 8611
./scripts/nucleserver start -i demo_data/single_cell_demo.xlsx
Tips: You need to make nucleserver executable using the command chmod (e.g., chmod +x nucleserver).
Then, open another terminal and use the following command to start another data service to host the 3D genome structure models.
./scripts/nucleserver file --root demo_data/3d/ --port 8612
Finally, open a web browser (Google Chrome or Safari browser), and go to https://vis.nucleome.org.
Click the START button on the main page and then click the Genome Browser button at the bottom.
You can click the configuration button (step 1) on the top-right of the genome panel and select mm10 as the genome version on the track setting page.
In the dropdown menu below you should see two datasheets named Hi_C and ChIP_seq which contain data tracks you just created.
If these two data tracks do not appear, you can then try to manually add them by clicking the data server setting button (step 2) as shown below and adding http:https://127.0.0.1:8611 in the URI column (step 3).
If you see the Status column showing active after you click the update button (steps 4&5), it means that you have successfully added a local data service to Nucleome Browser.
To view the 3D genome structure model, you can go to this link http:https://127.0.0.1:8612/get in the web browser.
Then, you can create a new 3D structure panel in the Nucleome Browser and copy the link of nucle3d file (e.g., http:https://127.0.0.1:8612/get/Cell_1.model_1.nucle3d) and paste it to the data URL box on the 3D structure panel as shown below.
Important!!! Note that you must to go to chromosome 19 to view Hi-C contact maps as only this chromosome has Hi-C contact map in the demo data.
Stevens TJ, Lando D, Basu S, Atkinson LP, Cao Y, Lee SF, et al. 3D structures of individual mammalian genomes studied by single-cell Hi-C. Nature. 2017;544(7648):59-64