Prediction and visualization of RNA modification stoichiometry in direct RNA sequencing datasets from per-read information
- General Description
- 1. Prediction of RNA modified sites
- 2. RNA modification stoichiometry estimation using Nanopolish resquiggling (not recommended)
- 3. RNA modification stoichiometry estimation using Tombo resquiggling (recommended)
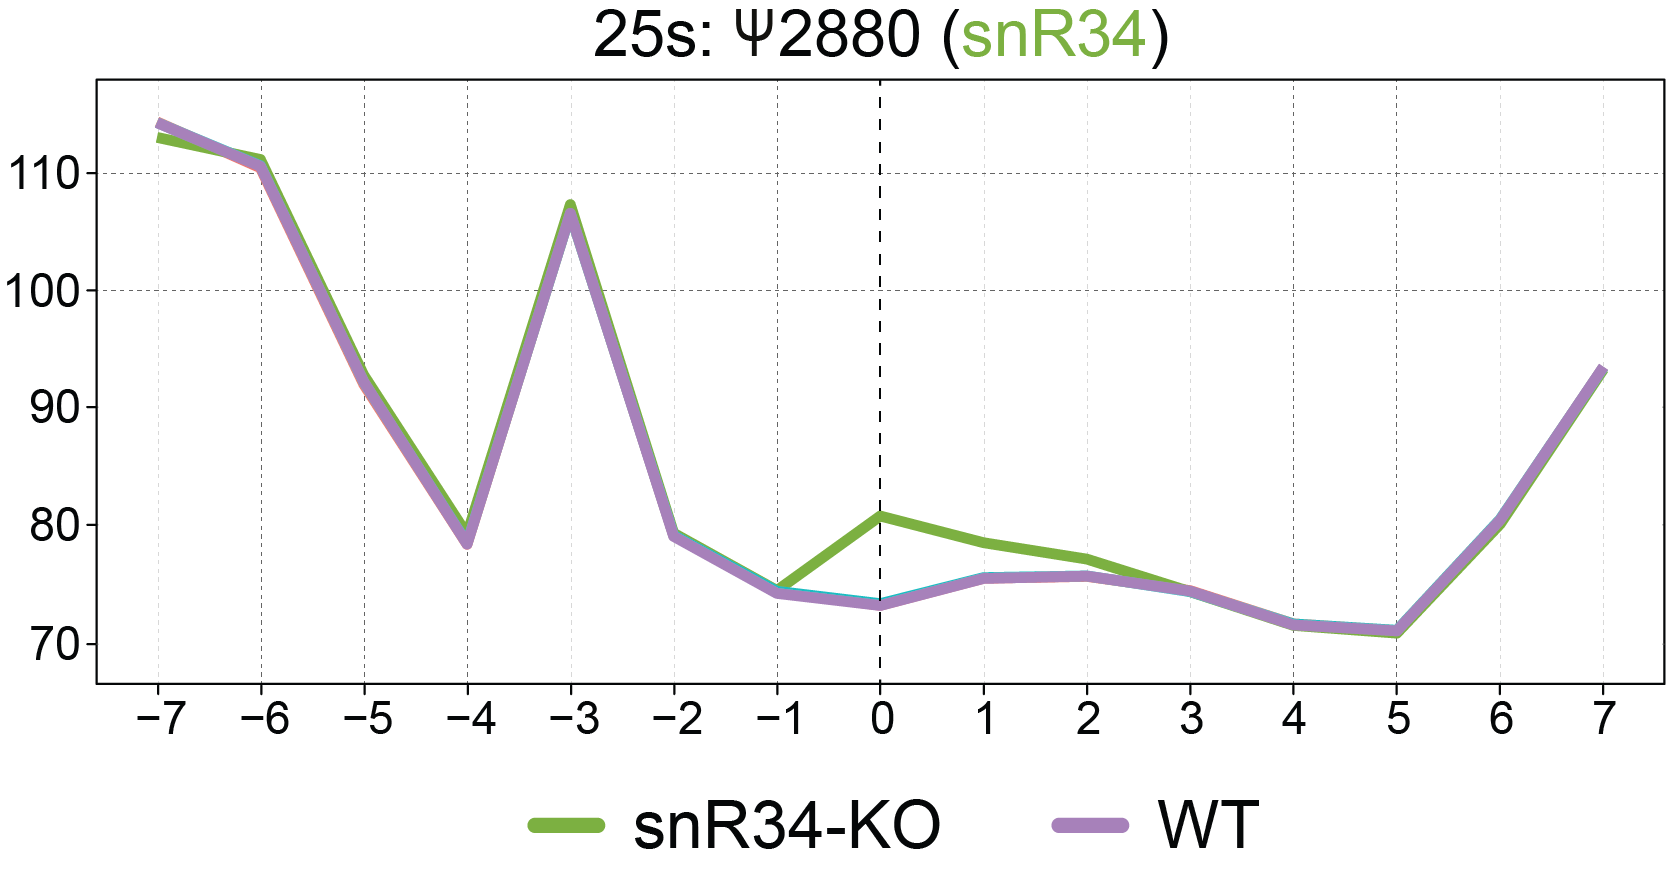
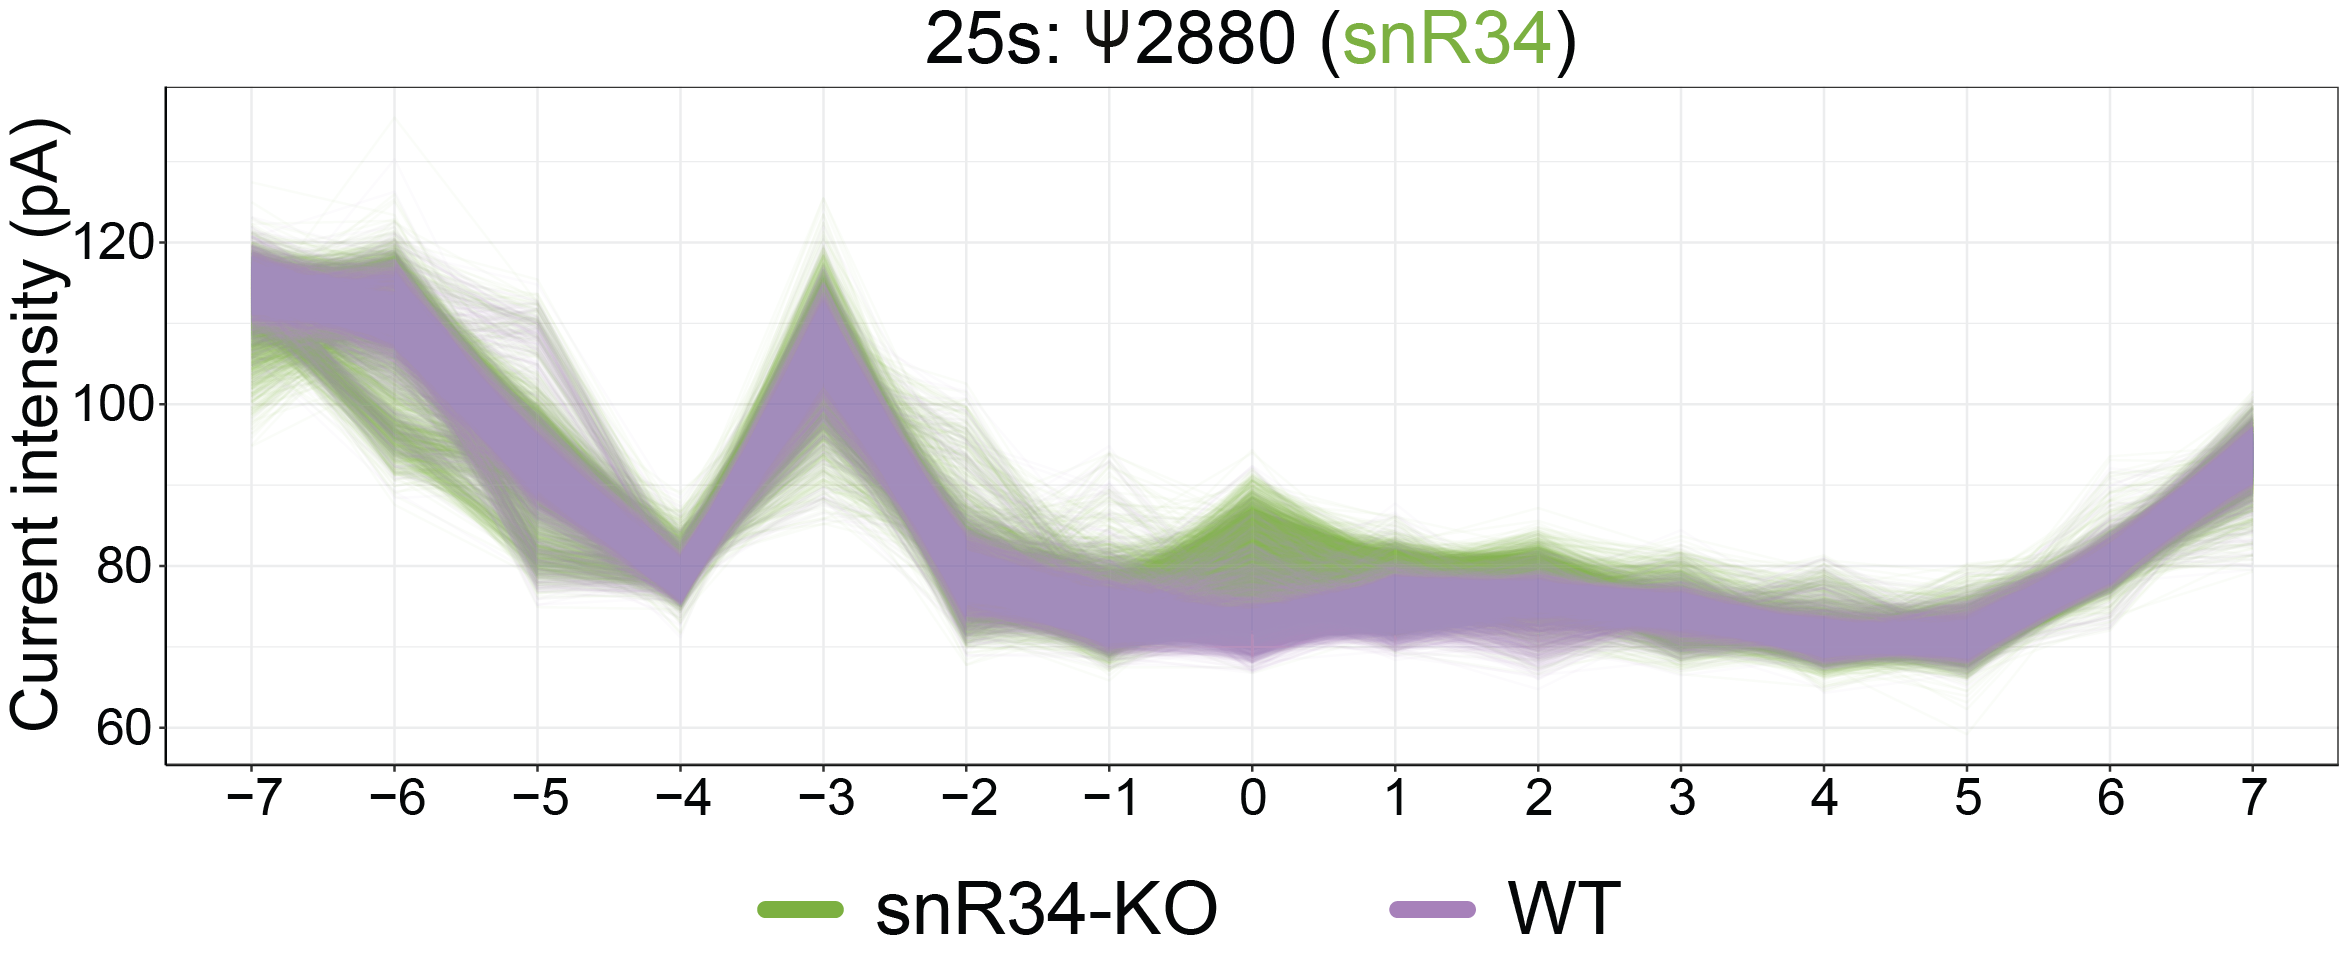
- 4. Visualization of per-read current intensities at individual sites
- Dependencies and versions
- Citation
- Contact
- NanoRMS predicts modification stoichiometries by classifying reads into modified/unmodified, based on their per-read features (current intensity, dwell time and/or trace).
- NanoRMS can be run in single mode (1sample) or paired mode (2 samples).
- NanoRMS can run both unsupervised (e.g. KMEANS, Aggregative Clustering, GMM) and supervised machine learning algorithms (e.g. KNN, Random Forest). The later will require pairwise samples where one of the conditions is a knockout.
- NanoRMS can predict stoichiometry from Nanopolish resquiggled reads or from Tombo resquiggled reads. The latter is the recommended option.
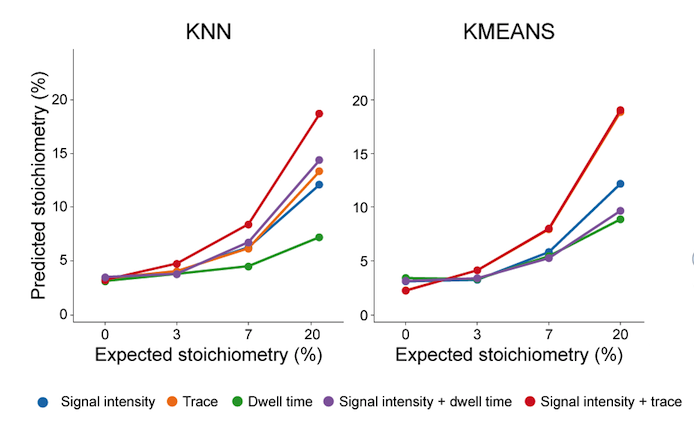
- NanoRMS can perform stoichiometry prediction using either unsupervised (KMEANS) or supervised (KNN) classification algorithms. We illustrate its quantitative ability using synthetic molecules whose pseudouridine levels were confirmed using LC-MS/MS.
- NanoRMS incorporates TRACE (TR) as a feature to predict per-read modification (and thus stoichiometry). We find that the incorporation of TRACE greatly improves the prediction of RNA modification stoichiometry. Overall, we find that the best combination of features is TRACE + SIGNAL INTENSITY.
- NanoRMS stoichiometry predictions have been benchmarked on pseudouridine and 2-O-methylations in RNAs with different % modification.
Please note that we are using a modified version of EpiNano (version 1.2) that was specifically developed for nanoRMS. EpiNano-RMS includes information regarding the proportion of mismatches that correspond to each base (C_freq, A_freq, G_freq, T_freq) in addition to the overall mismatch frequency).
Firstly, we need to create a dictionary file from the reference fasta file
java -jar epinano_RMS/picard.jar CreateSequenceDictionary REFERENCE=reference.fasta OUTPUT= reference.fasta.dict
Requires python3
python3 epinano_RMS/epinano_rms.py -R <reference_file> -b <bam_file> -s epinano_RMS/sam2tsv
Example using test data:
python3 epinano_RMS/epinano_rms.py -R test_data/yeast_rRNA_ref -b test_data/wt_sorted.bam -s epinano_RMS/sam2tsv
Single sample 'de novo' RNA modification prediction has been tested for predicting pseudouridine RNA modifications in mitochondrial rRNAs. The novel predicted sites were validated using CMC-based probing followed by sequencing (Nano-CMCseq), validating 2 out of the 2 sites that were predicted in all 3 biological replicates.
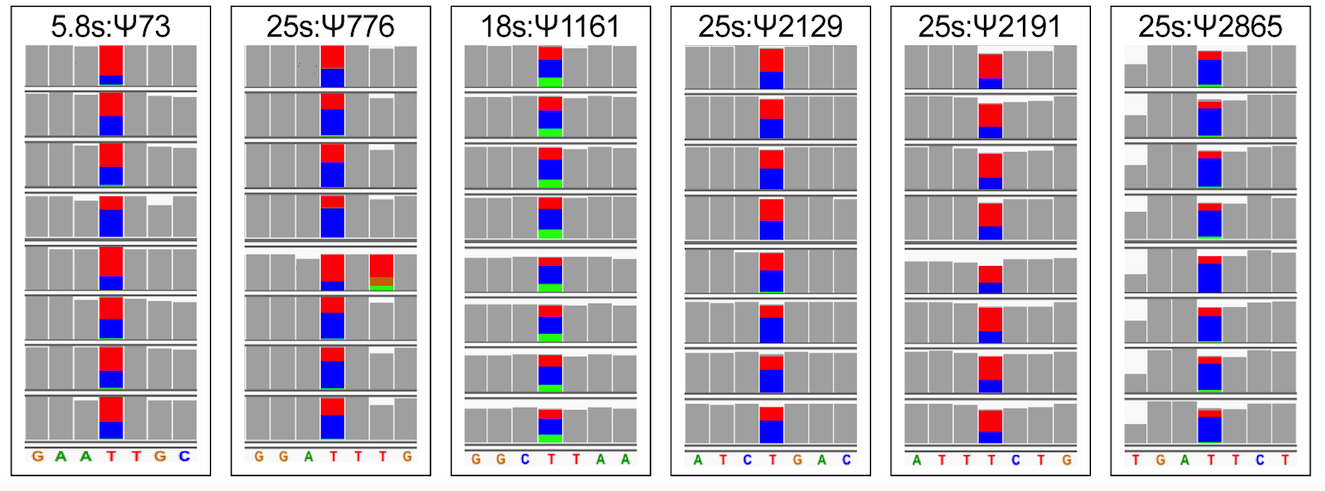
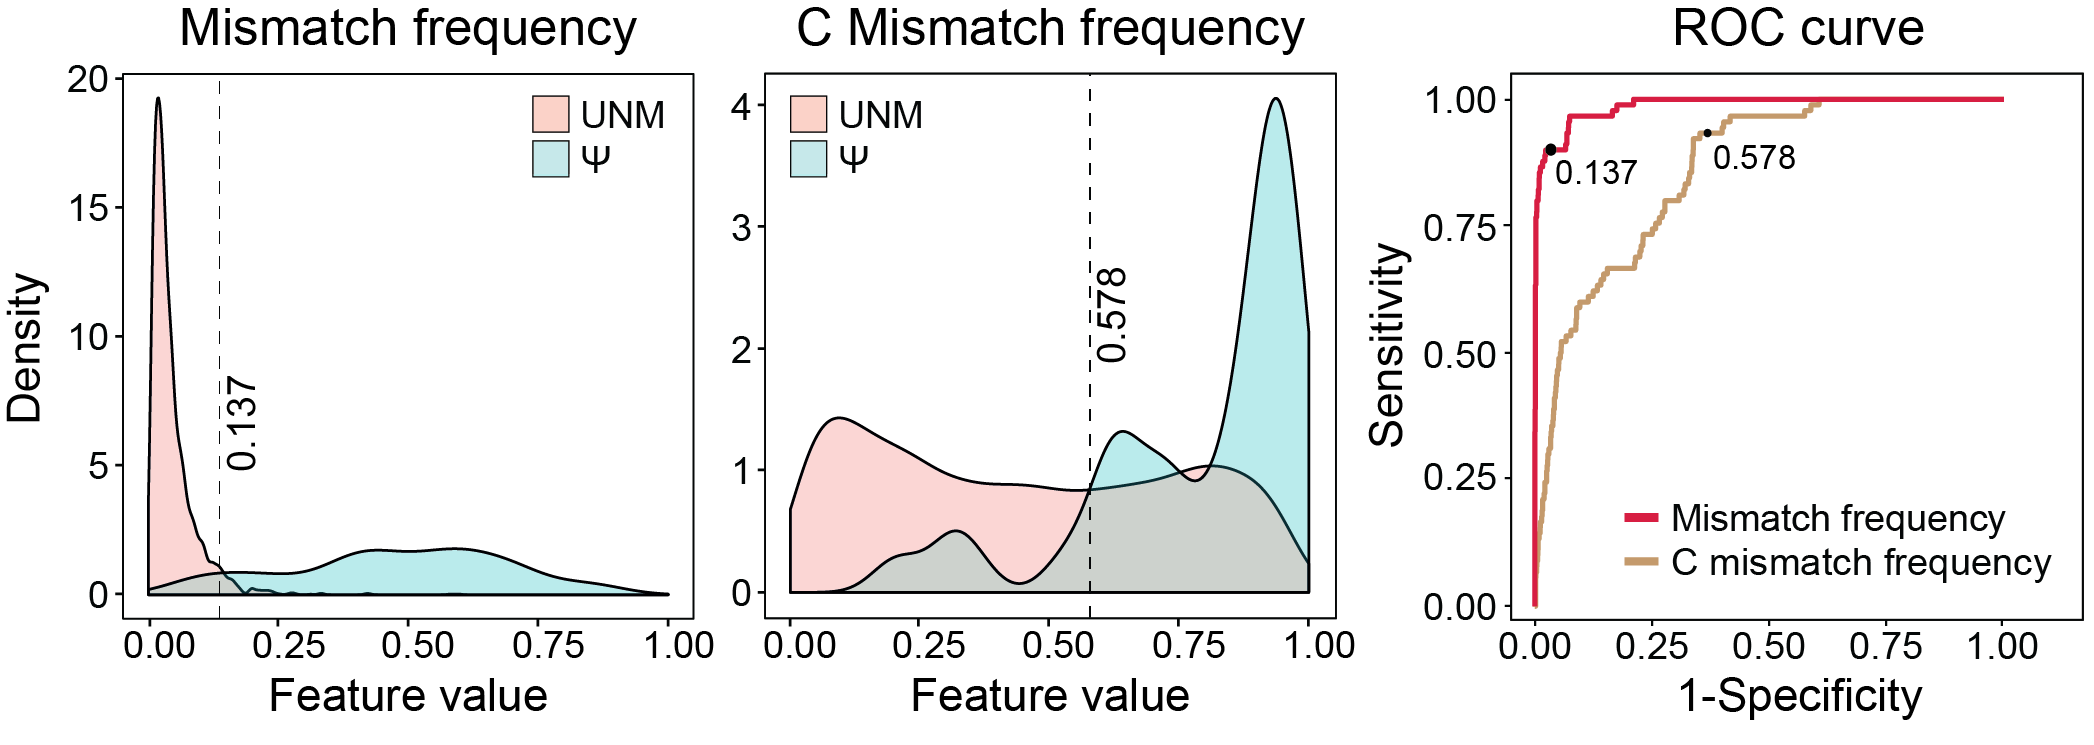
'De novo' RNA modification prediction of pseudourdine-modified sites relies on the identification of pseudouridine base-calling error 'signatures', which allows us to predict RNA modifications de novo in individual samples, as long as the stoichiometry of modification is sufficiently high (i.e. to be distinguished from background base-calling error of direct RNA sequencing). Specifically, pseudouridine causes strong mismatch signatures in the modified position, largely in the form of C-to-U mismatches (see image below).
Please note that thresholds shown on Figure 5a and Methods section had a typo (but all computations in the paper were done with the correct thresholds). The correct thresholds are following: Mismatch_frequency threshold : 0.137, C_frequency threshold: 0.578.
General usage:
Rscript --vanilla Pseudou_prediction_singlecondition.R [options] -f <epinano_file1> (-s <epinano_file2> -t <epinano_file3>)
Example using test data (prediction of pseudouridine sites on mitochondrial ribosomal RNAs):
Rscript --vanilla Pseudou_prediction_singlecondition.R -f WT_rRNA_Epinano.csv -s sn34KO_rRNA_Epinano.csv -t sn36KO_rRNA_Epinano.csv
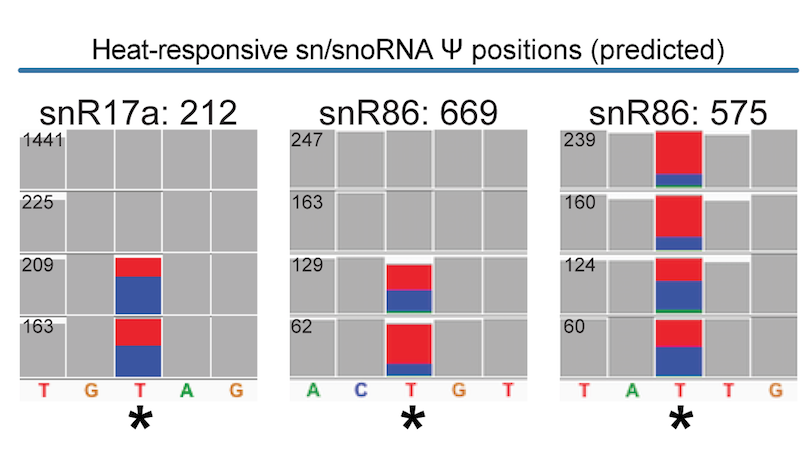
Pseudouridine is not always present in high stoichiometries (e.g. rRNAs), but can also be present in low stoichiometries (e.g. in mRNAs). Please note that pseudouridines in mRNAs cannot be accurately predicted using "de novo" mode, because the background nanopore 'error' is too similar to the 'error' caused by the presence of pseudouridine. For such cases, we can predict differentially pseudouridylated sites by identifying which sites show pseudouridine differential error signatures between two conditions, as shown below. This type of pairwise comparison can be done for WT-KO, or between two conditions (e.g. normal-heat stress). In the image below, some examples of heat-responsive sites that were identified using this script are shown. Differential-error based prediction can be applied to any type of RNA (mRNA, snoRNAs, snRNAs, rRNAs etc).
General usage:
Rscript --vanilla Pseudou_prediction_pairedcondition_transcript.R [options] -f <epinano_file1> -s <epinano_file2>
Example using test data:
Rscript --vanilla Pseudou_prediction_pairedcondition_transcript.R -f WT_ncRNA_Normal_Rep1_Epinano.csv -s WT_ncRNA_HeatShock_Rep1_Epinano.csv
We first need to process Epinano output and GTF files to convert them into BED files. Furthermore, we will intersect both using intersect from Bedtools.
General usage:
./Epinano_to_BED.sh <epinano_file1>
Example using test data:
./Epinano_to_BED.sh WT_mRNA_Normal_Epinano.csv
General usage:
Rscript --vanilla GTF_to_BED.R <GTF_File>
Example using test data:
Rscript --vanilla GTF_to_BED.R Saccer64.gtf
Required tool : bedtools intersect
General usage:
bedtools intersect -a <Epinano_Bed> -b <GTF_Bed> -wa -wb > output.bed
Example using test data:
bedtools intersect -a WT_mRNA_Normal_Epinano.csv.bed -b Saccer3.bed -wa -wb > WT_mRNA_Normal_Epinano_final.bed
General usage:
Rscript --vanilla Pseudou_prediction_pairedcondition_genome.R [options] -f <epinano_file1> -s <epinano_file2>
Example using test data:
Rscript --vanilla Pseudou_prediction_pairedcondition_genome.R -f WT_mRNA_Normal_Epinano.csv -s WT_mRNA_HeatShock_Epinano.csv
This version is deprecated. If you still wish to use it, you can find the details and code here
To use this version, you can find the installation details here
- First download test data This dataset is described in more details in per_read directory.
(cd per_read && wget https://public-docs.crg.es/enovoa/public/lpryszcz/src/nanoRMS/per_read/guppy3.0.3.hac -q --show-progress -r -c -nc -np -nH --cut-dirs=6 --reject="index.html*")- Retrieve per-read features from all samples.
ref=per_read/guppy3.0.3.hac/Saccharomyces_cerevisiae.R64-1-1_firstcolumn.ncrna.fa
per_read/get_features.py --rna -f $ref -t 6 -i per_read/guppy3.0.3.hac/*WT??C/workspace/*.fast5
Your Fast5 files have to be basecalled and contain FastQ entries,
Move and Trace tables (this can be checked using h5ls -r batch0.fast5 | less).
Note, when basecalling is performed via MinKNOW, by default Move and Trace tables are not stored.
In such case, you'll need to rebasecall your Fast5 files
specifying --fast5_out parameter with guppy_basecaller.
- Estimate modification frequency difference between two samples
Note, you'll need to provide candidate positions that are likely modified. Those were identified earlier -- please see above section 1.2. Predict RNA modifications. so here we'll just generate BED file from existing candidate file.
# prepare BED - this is no longer needed step!
f=per_read/results/predictions_ncRNA_WT30C_WT45C.tsv.gz
zgrep -v X.Ref $f |awk -F'\t' 'BEGIN {OFS = FS} {print $1,$2-1,$2,".",100,"+"}' > $f.bed

# calculate modification frequency difference between control and sample of interest
per_read/get_freq.py -f $ref -b $f.bed -o $f.bed.tsv.gz -1 per_read/guppy3.0.3.hac/*WT30C/workspace/*.fast5.bam -2 per_read/guppy3.0.3.hac/*WT45C/workspace/*.fast5.bam
Note, the candidate position file (-b $f.bed) has to refer only to reference positions that have some reads aligned -
otherwise the get_freq.py will report warnings about low coverage.
You can change required minimum number of reads using --mincov, but it has to be at least 5 due to KNN requirements.
Please note that KMEANS does not accurately assign directionality of the stoichiometry change, whereas KNN does (because KMEANS randomly assigns one cluster as "modified" and another as "unmodified". Thus, to know the directionality of the change for KMEANS stoichiometry predictions, you will need to infer that from the directionality of mismatch error in that given position. If you don't care about the directionality of the change, but just about the effect size of the change, you can just take the absolute values of the predicted stoichiometry changes.
Firstly, generate a collapsed Nanopolish event align output, by collapsing all the multiple observations for a given position from a same read.
python3 per_read_mean.py <event_align_file>
Example using test data:
python3 per_read_mean.py test_data/data1_eventalign_output.txt
Secondly, create 15-mer windows of per-read current intensities centered in positions of interest
The output of Nanopolish event align generated in the previous step is used as input in this script.
Rscript --vanilla nanopolish_window.R positions_file <input_table> <label>
Example using test data:
Rscript --vanilla nanopolish_window.R test_data/positions test_data/data1_eventalign_output.txt_processed_perpos_mean.csv data1
Rscript --vanilla density_nanopolish.R <window_file1> <window_file2> <window_file3(optional)> <window_file4(optional)>
Example using test data:
Rscript --vanilla nanopolish_density_plot.R test_data/sn34_window_file.tsv test_data/wt_window_file.tsv
Rscript --vanilla nanopolish_meanlineplot.R <window_file1> <window_file2> <window_file3(optional)> <window_file4(optional)>
Example using test data:
Rscript --vanilla nanopolish_meanlineplot.R test_data/sn34_window_file.tsv test_data/wt_window_file.tsv
Rscript --vanilla nanopolish_perreadlineplot.R <window_file1> <window_file2> <window_file3(optional)> <window_file4(optional)>
Example using test data:
Rscript --vanilla nanopolish_perreadlineplot.R test_data/sn34_window_file.tsv test_data/wt_window_file.tsv
Rscript --vanilla nanopolish_pca.R <window_file1.tsv> <window_file2.tsv> <window_file3.tsv(optional)> <window_file4.tsv(optional)>
Example using test data:
Rscript --vanilla nanopolish_pca.R test_data/sn34_window_file.tsv test_data/wt_window_file.tsv
| Software | Version |
|---|---|
| matplotlib | 3.1.2 |
| numba | 0.51.1 |
| numpy | 1.19.4 |
| ont-fast5-api | 3.1.6 |
| ont-tombo | 1.5.1 |
| openpyxl | 3.0.5 |
| pandas | 0.24.2 |
| scipy | 1.5.2 |
| seaborn | 0.11.0 |
| sklearn | 0.23.1 |
If you encounter cannot convert float NAN to integer error,
make sure to downgrade numpy to version below 1.20
pip install "numpy<1.20"
Begik O*, Lucas MC*, Pryszcz LP, Ramirez JM, Medina R, Milenkovic I, Cruciani S, Vieira HGS, Liu H, Sas-Chen A, Mattick JS, Schwartz S and Novoa EM. Quantitative profiling of pseudouridylation dynamics in native RNAs with nanopore sequencing. Nat Biotechnol 39, 1278–1291 (2021). https://doi.org/10.1038/s41587-021-00915-6
Please open an issue in the GitHub repo if you have any questions/doubts/suggestions about how to use this software. Thanks!

