A small DPDK telemetry exporter
The recommended way when running locally. Remember to mount the dpdk run dir as a volume and add extra options to the command line, e.g.:
$ docker run --rm --name exporter -p 8000:8000 -v /var/run/dpdk/:/var/run/dpdk/ nfvri/dpdk-telemetry-exporter:0.1 dpdkTelemetryExporter -vvv -T 5To run as a sidecar, add the exporter container to your Deployment/Statefulset/Daemonset definition with mount access to the dpdk run directory (usually /var/run/dpdk) as follows:
apiVersion: apps/v1
kind: Deployment
...
spec:
  template:
    spec:
      containers:
      - name: telemetry-exporter
        imagePullPolicy: Always
        image: nfvri/dpdk-telemetry-exporter:0.1
        command: ["dpdkTelemetryExporter"]
        args: ["-vvv"]
        volumeMounts:
           - mountPath: /var/run/dpdk/
             name: dpdkrun-volume
        resources:
          requests:
            memory: "1Gi"
            cpu: "1000m"
          limits:
            memory: "1Gi"
            cpu: "1000m"
        ports:
          - containerPort: 8000
...
Then assuming you have a Prometheus-operator deployment, use a Service and ServiceMonitor to specify a target to the exporter (be careful to match the appropriate labels/namespaces for your case):
---
apiVersion: monitoring.coreos.com/v1
kind: ServiceMonitor
metadata:
  name: dpdk-deployment-monitor
  namespace: monitoring
  labels:
    app: dpdk
    release: k8s-prom
spec:
  endpoints:
  - port: metrics
    path: /
    interval: "5s"
    scrapeTimeout: "5s"
  namespaceSelector:
    matchNames:
      - dpdk
  selector:
    matchLabels:
      app: dpdk

---
apiVersion: v1
kind: Service
metadata:
  name: dpdk-deployment-svc
  namespace: dpdk
  labels:
    app: dpdk
spec:
  ports:
  - name: metrics
    port: 8000
    protocol: TCP
  selector:
app: dpdkPlease prefer to run from the docker image. If local installation is absolutely necessary, you can install the exporter with:
$ sudo apt-get update && sudo apt-get install -y python3 python3-pip

$ python3 setup.py install
You can then run it with:
$ dpdkTelemetryExporter -h
usage: DPDKTelemetryExporter [-h] [-t THREADS] [-p PORT] [-T TIMEOUT] [-v]

optional arguments:
  -h, --help            show this help message and exit
  -t THREADS, --threads THREADS
                        DPDKTelemetryExporter parallel threads (default: 8)
  -p PORT, --port PORT  DPDKTelemetryExporter port (default: 8000)
  -T TIMEOUT, --timeout TIMEOUT
                        The update interval in seconds (default 5)
  -v, --verbose         Set output verbosity (default: -vv = INFO)
| Short | Long | Arguments | Description |
|---|---|---|---|
| -h | help | None | Show usage and exit. |
| -t | threads | Number of threads (int) | The number of parallel threads. This will impact the collection speed when there are many sockets from which the exporter has to gather metrics in parallel. |
| -p | port | Port number (int) | The port number on which to expose metrics (default 8000). |
| -T | timeout | Number of seconds (int) | The number of seconds between collections (i.e. the update interval). Default is 5 (seconds) but you can modify it to your needs. |
| -v | verbose | None | Specify multiple times to set log level (default is -vv=INFO, use -vvv for DEBUG). |
If you have set the dpdk run directory to an "odd" (i.e. not /var/run/dpdk) location, you can specify it by setting the DPDK_RUN_DIR environment variable to make the telemetry socket discoverable by the exporter.
The exporter understands (and re-wraps to proper Prometheus types) the following metrics (if available):
| Metric name | Type | Label names | Description |
|---|---|---|---|
| dpdk_telemetry_busy_percent | Gauge | 'socket', 'port', 'aggregate' | A business percentage, i.e. an indication of the amount of work the dpdk application performs. |
| dpdk_telemetry_idle_status | Gauge | 'socket', 'type', 'direction', 'port', 'aggregate' | Idle status as collected (0,1). |
| dpdk_telemetry_polls_total | Counter | 'socket', 'type', 'port', 'aggregate' | The amount of polls per type (empty, full) performed. |
| dpdk_telemetry_packets_total | Counter | 'socket', 'type', 'direction', 'priority', 'port', 'aggregate' | The amount of packets based on different labels that have been processed. |
| dpdk_telemetry_bytes_total | Counter | 'socket', 'type', 'direction', 'port', 'aggregate' | The amount of bytes that have been processed. |
| dpdk_telemetry_errors_total | Counter | 'socket', 'type', 'direction', 'port', 'aggregate' | The amount of errors encountered. |
| dpdk_telemetry_idle_total | Counter | 'socket', 'type', 'direction', 'port', 'aggregate' | The amount of idle status counts. |
| dpdk_telemetry_packets_size | Histogram | 'socket', 'direction', 'port', 'aggregate' | The amount of packets per packet size. The individually reported statistics are wrapped to a Histogram type with bins=(64, 128, 256, 512, 1024, 1522, float("inf")). |
A description of the meaning of label names follows. All label values as per the Prometheus spec are strings.
| Label name | Description |
|---|---|
| socket | The absolute socket path from which the metric was collected. Useful in the multi-threaded case to separate specific apps. |
| port | The dpdk port number (as string). Note that for v1 telemetry global stats the uint max port number is used (4294967295). |
| aggregate | Whether the metric is a global statistic (string "1") or not (string "0). This is provided to easily select aggregate stats when querying and the per-port stats are not required (or vice versa). |
| type | This has a specific meaning per metric. For example, in dpdk_telemetry_polls_total it has the poll type (empty or full), in dpdk_telemetry_errors_total the error type (e.g. missed). Generally, it collects the number of dimensions encountered in distinct dpdk stats for easy querying. |
| direction | The flow direction (e.g. rx, tx) or mac where applicable. |
| priority | This is specific to dpdk_telemetry_packets_total where the packet priority dimension is explicitly defined. |
In the example above for Kubernetes pod sidecar run, the Prometheus target is set automatically by prometheus-operator. If you have to manually create a target, locate your prometheus.yml file and add a scrape config for the exporter target, using the proper ip and port where Prometheus can contact the exporter:
  - job_name: 'dpdk-telemetry-exporter'
    scrape_interval: 5s
    scrape_timeout: 5s
    static_configs:
      - targets: ['192.168.123.1:8000']
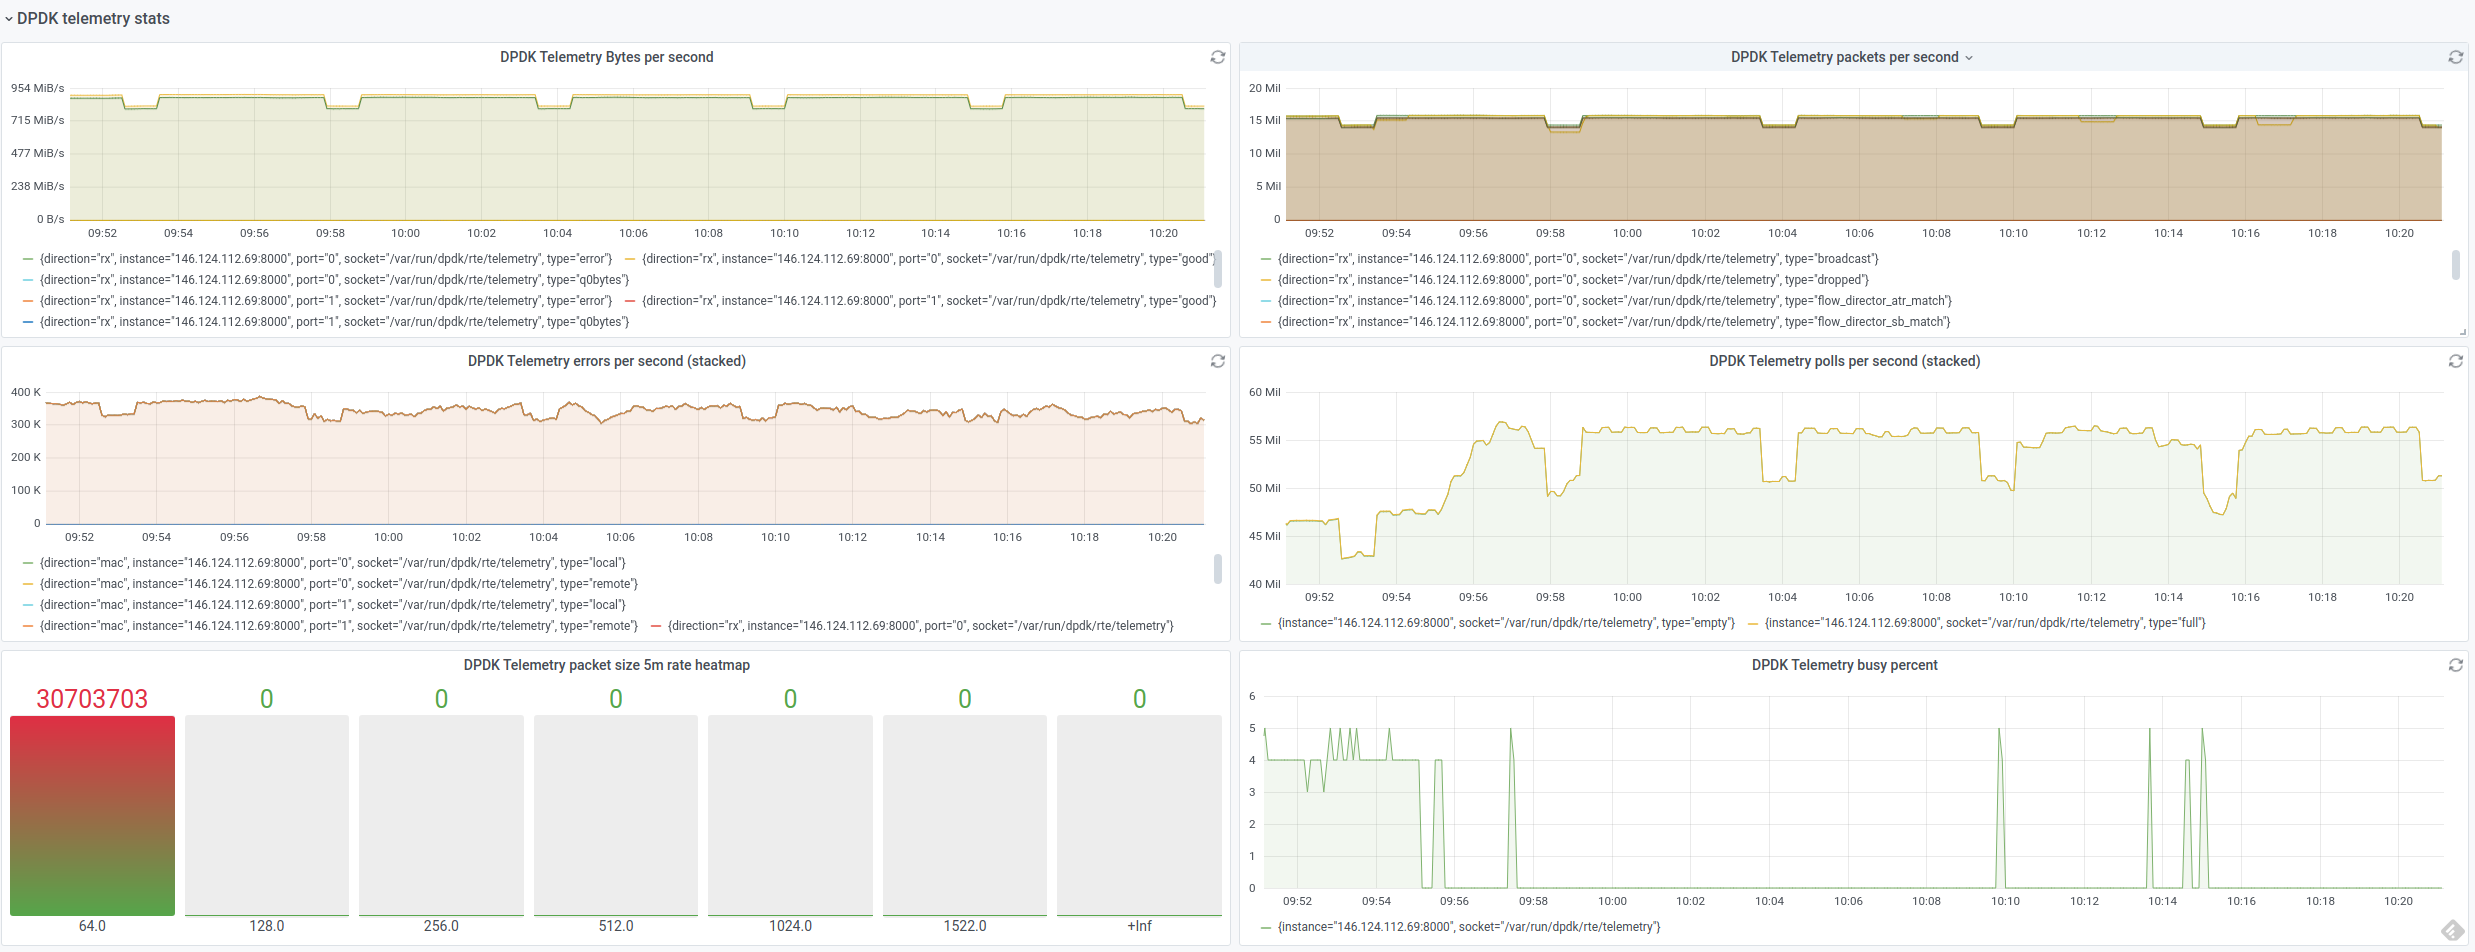
A sample grafana dashboard is provided at grafana_dashboard.json. This is primarily meant for a Kubernetes Prometheus, so it assumes that there is a pod label available in the panel queries. Feel free to change it to the instance label if not running Prometheus in Kubernetes.
