Morris Lab, University of Toronto. R package for TrackSig, and its extension TrackSigFreq.
Vignette can be viewed with vignette('TrackSig') or see the online vignette.
Make sure you have a version of R >= 3.3.3. You can install the package using devtools. Some of TrackSig's dependencies are only available via bioconductor.
devtools::install_github("morrislab/TrackSigFreq", build_vignettes = TRUE)
Expected input is a vcf file, with INFO fields containing at minimum t_alt_count and t_ref_count, the counts of altered and reference reads respectively.
See hts-specs for vcf specification details.
Treated in greater detail in the package vignette.
Using the example data provided in extdata/, the following code will plot the signature trajectory, and return the fitted mixture of signatures for each bin, the bins where changepoints were detected, and the ggplot object.
- First, restrict the list of signatures to fit exposure for. This is recommended for improving speed by making the model smaller. Here, we choose a threshold of 5%, meaning that signatures with exposure under this across all timepoints will not be fit.
library(TrackSig)
library(ggplot2)

vcfFile = system.file(package = "TrackSig", "extdata/Example.vcf")
cnaFile = system.file(package = "TrackSig", "extdata/Example_cna.txt")
purity = 1

detectedSigs <- detectActiveSignatures(vcfFile = vcfFile, cnaFile = cnaFile,
purity = purity, threshold = 0.05)- Next, we compute the trajectory for all timepoints.
set.seed(1224)

# a warning will appear about not matching the refrence genome, this is because the
# example vcf file is generated by sampling random nucleotides, not real mutations.
traj <- TrackSig(sampleID = "example", activeInSample = detectedSigs,
                 vcfFile = vcfFile, cnaFile = cnaFile, purity = purity)
The function TrackSig has three available methods for segmentation, controlled by the parameter scoreMethod. These are:
Signature(described in the TrackSig paper)SigFreq(described in the TrackSigFreq paper)Frequency(not explicitly described, but corresponds to the frequency likelihood in the TrackSigFreq paper).
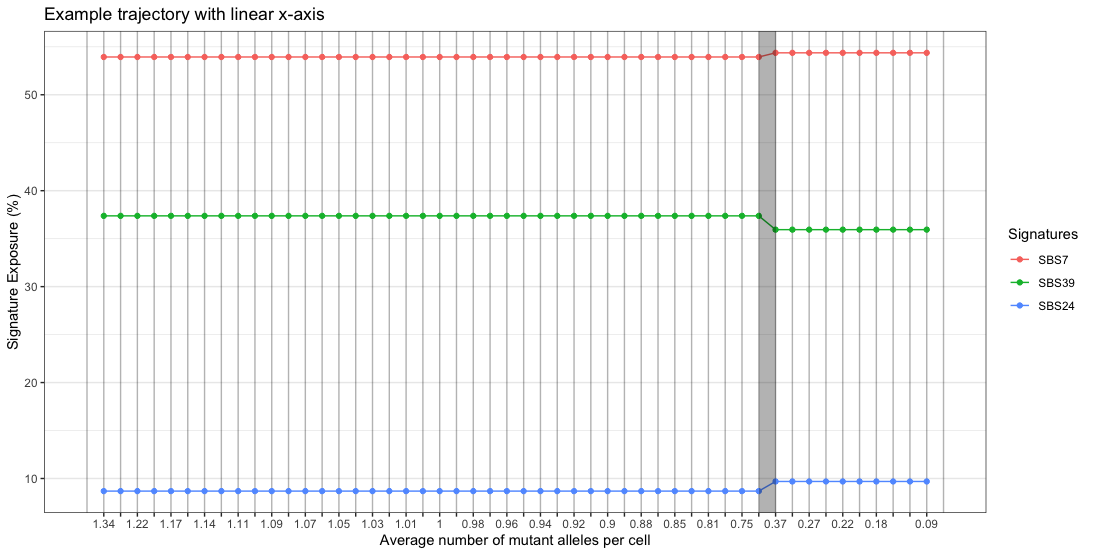
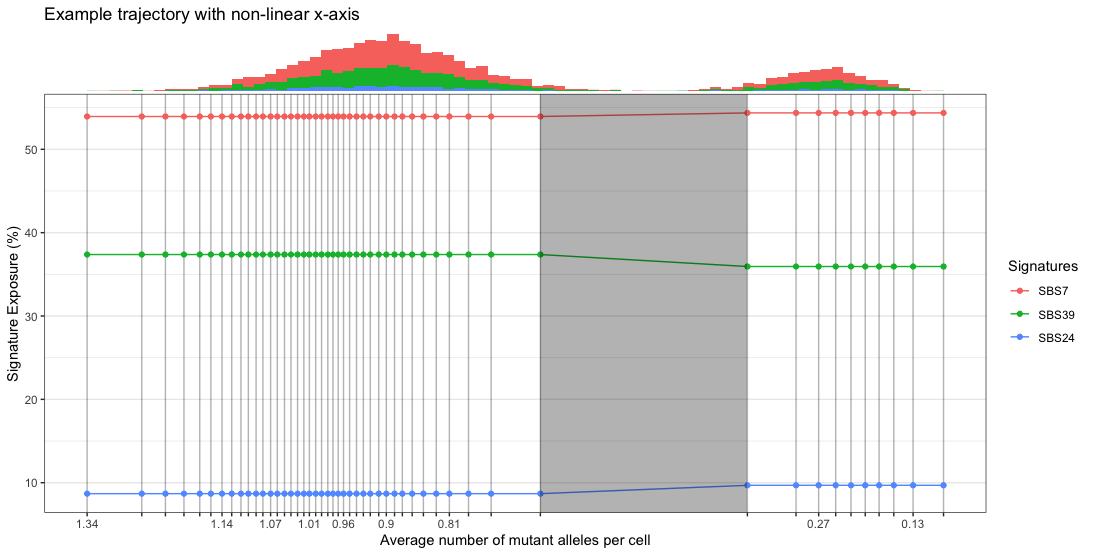
- Plot the trajectory. If we plot with non-linear x-axis, then we can use the funciton
addPhiHist()
plotTrajectory(traj, linearX = T) + labs(title = "Example trajectory with linear x-axis")

nonLinPlot <- plotTrajectory(traj, linearX = F, anmac = T) + labs(title = "Example trajectory with non-linear x-axis")
addPhiHist(traj, nonLinPlot)
Rubanova, Y., Shi, R., Harrigan, C.F. et al. Reconstructing evolutionary trajectories of mutation signature activities in cancer using TrackSig. Nat Commun 11, 731 (2020). https://doi.org/10.1038/s41467-020-14352-7
Harrigan, C.F., Rubanova, Y., Morris, Q. & Selega, A. TrackSigFreq: subclonal reconstructions based on mutation signatures and allele frequencies. Pac Symp Biocomput 25, 238–249 (2020).https://doi.org/10.1142/9789811215636_0022
Some users may have plotting issues with TrackSig if ggplot2 is not explicitly loaded with library(ggplot2). This may be related to a bug that has been previously described for ggplot2.

