Retebuonvivere: meshwork d3 visualization
This repository is a workshop for the creation of a d3.js meshwok visualization to be used in retebuonvivere project. See fonzy85vr/retebuonvivere#74 for the original issue.
See the meshwork graph in retebuonvivere website at https://www.retebuonvivere.org/rete/meshwork
This repository is a submodule of retebuonvivere
We want to:
-
Create a meshwork visualization for retevuonvivere project
-
Create a general meshwork visualization algoritm for displaying dynamic networks (We want to make the meshwork algorithm open, in order to be implemented in other network apps such as gephi).
The "traditional" way to visualize dynamic networks - which are networks changing through time - is to add a timeline object (a slide) by which the user can limit the time range of data. A remarkable example is the immersion web app created by Daniel Smilkov, Deepak Jagdish, and César Hidalgo at Mit Media Lab, which displays collaborators through emails. A similar solution is used in the wellknown desktop app Gephi (for details see this tutorial by Gephi community supporter Clement Levallois).
We want to display a dynamic network in a different way, one that can show time without the need to change the graph. In order to do it we propose to follow the meshwork idea explained by anthropologist Tim Ingold in his 2011 book Being Alive: Essays on Movement, Knowledge and Description.
Have some quotes (p. 63):
Imagine two intersecting lines, A and B. Their intersection defines a point, P. What difference would it make if we depicted A and B as points, and P as the line of their connection? Mathematically, these alternatives might be regarded as simple transforms of one another. As such, they would be equivalent ways of positing a relation between A and B: either as intersection or as connection.
[...] revealing, behind the conventional image of a network of interacting entities, what I call the meshwork of entangled lines of life, growth and movement. This is the world we inhabit. My contention, throughout, is that what is commonly known as the ‘web of life’ is precisely that: not a network of connected points, but a meshwork of interwoven lines.
The idea is fairly simple: invert nodes with edges! Traditionally network graphs display data subjects as nodes-circles (eg. people as nodes-circles) and data relations as edges-lines (e.g. "friends with" relations as edges-lines). The resulting graph is a timeless visualization of interconnected nodes, and focuses on nodes, hence on subjects.
In the meshwork visualization we want to assign data subject to lines, and data relations to circles. This way a node-line can be displayed in a temporal way, starting from one side of the screen, extending to the other. And when that node-line has a relation to another node-line, they intersect together. This visualization focuses more on interweaving, intertwining, entanglement. The meshwork, by incorporating time in the visualization, doesn't need a timeline to be scrolled or a movie to be played.
On the internet there are some examples of meshwork type visualizations:
| Example | Author | Description | JS library used / Technology |
|---|---|---|---|
| 1# Comic Book Narrative Charts | by Nancy Iskander, Matthew Thorne, Craig Kaplan. | It's a specialized instance of a Sankey Diagram. | d3.js / svg |
| 2# Software Evolution Storylines | by Michael Ogawa | As #1 is ispired by XKCD Comic, movie narrative chart | Processing.js / HTML5 svg |
| 3# Network Graph Visualizer | by Tom Preston-Werner | It shows collaboration code | Don't know / HTML5 canvas. |
We are going to export data from a Drupal MySQL database via json, import them into a d3 javascript library and visualize them on the browser.
| Data Object / Drupal content type | SVG Object / d3 object | Description |
|---|---|---|
| Organization nodes | Paths (lines) | |
| Projects nodes | Paths (lines) | |
| Events nodes | Circles | Circles as milestones in organization lines. |
| Collaborations nodes | Intersections | Not visible. Two organizations-lines intersect each other if there is a collaboration between them, and in the intersection point there is the project line. |
Each content type has a compound date field, with start and end dates.
This is a sample json file to highlight data structure. Important: we want to develop on top of the standard "nodes table + edges table" format to maintain compatibility with traditional network graph data.
{
    "nodes": [
        {
            "nid": 1,
            "label": "Organization 1 name",
            "nodeType": "organization",
            "startDate": "2014-02-01T09:00",
            "endDate": null,
            "url": "https://www.retebuonvivere.org/node/1"
        },
        {
            "nid": 2,
            "label": "Organization 2 name",
            "nodeType": "project",
            "startDate": "2014-03-15T10:00",
            "endDate": "2014-07-15T18:00",
            "url": "https://www.retebuonvivere.org/node/2"
        }
    ],
    "edges": [
        {
            "nid": 3,
            "source": 1,
            "target": 2,
            "weight": 1,
            "label": "Collaboration 1 label",
            "url": "https://www.retebuonvivere.org/node/3"
        }
    ],
    "events": [
        {
            "nid": 4,
            "nodeId": 1,
            "label": "Event 1 name",
            "startDate": "2014-04-19T18:00",
            "endDate": "2014-04-19T22:30",
            "url": "https://www.retebuonvivere.org/node/4"
        }
    ]
}| Event | Behavior |
|---|---|
| OnMouseOver over circles | show event preview |
| OnMouseOver over lines | show organization or project preview |
| OnClick over lines | highlight ego-meshork of that organization or project → all neighbors lines |
| OnDrag over lines | move dragged lines to allow self adjustment of visualization |
| OnDoubleClick over lines | go to node url |
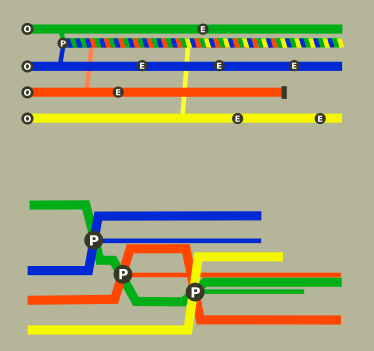
You can find some sketches in sketches.md.
I put here just one:
Legend:
O: Organization line
P: project line
E: Event (displayed as a milestone)
The algorithm should reposition lines in order to reduce line overlapping. After each project starting point, calculate, and reposition of the remaining lines lenght.
