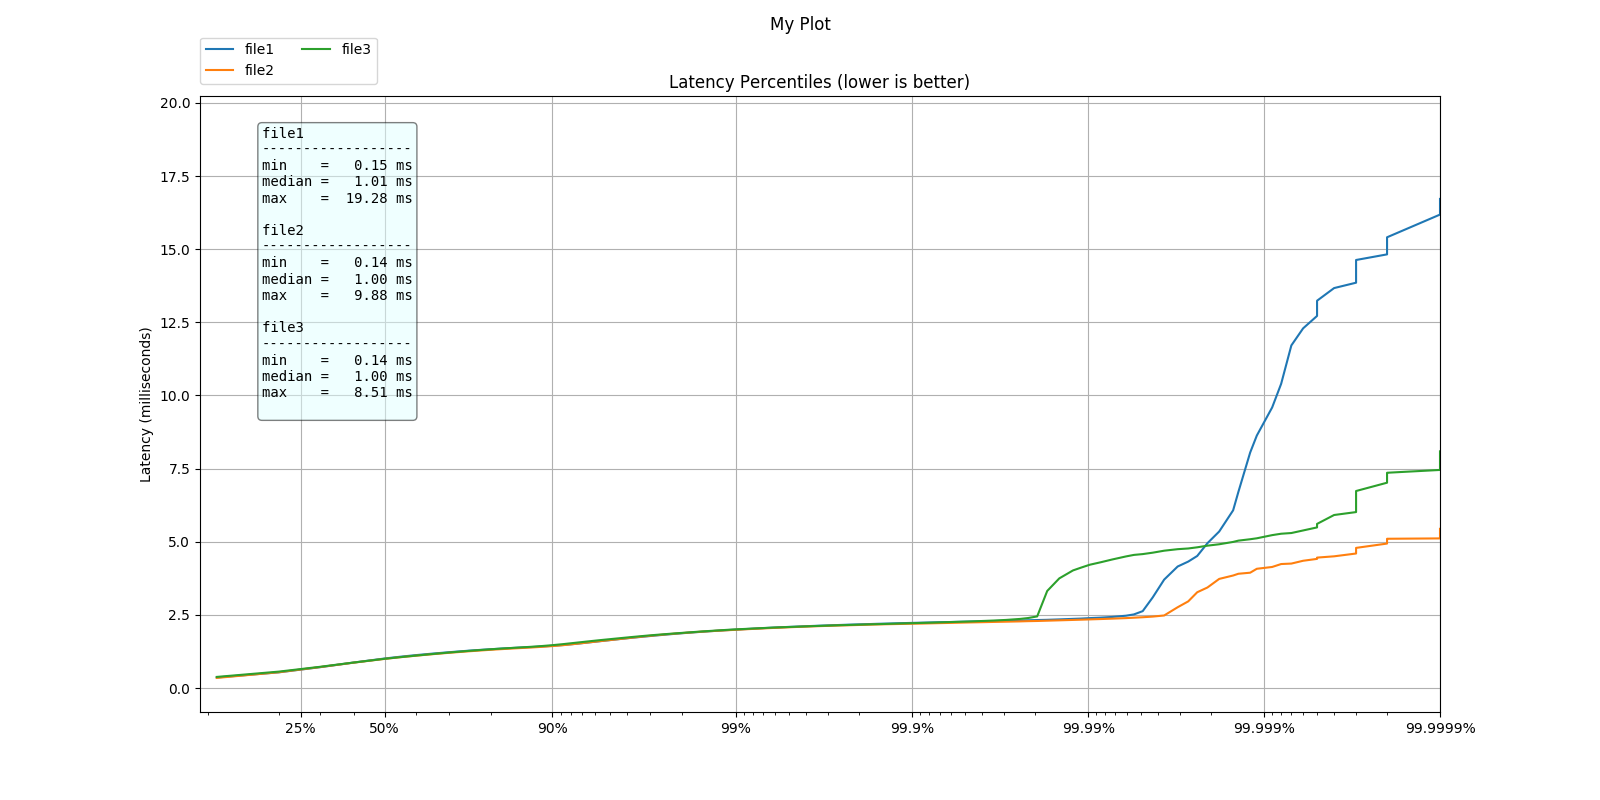
A standalone plotting script for https://github.com/giltene/wrk2 and https://github.com/HdrHistogram/HdrHistogram.
This is just a quick and unsophisticated script to quickly plot the
HdrHistograms directly from the output of wkr2 benchmarks.
For example:
installation:
pip3 install --user --upgrade hdr-plot
usage:
usage: hdr-plot [-h] [--output OUTPUT] [--title TITLE] [--nobox] files [files ...]
Then run wrk with the -L option and store the output into a file, like:
wrk -t2 -c100 -d30s -R2000 -L https://127.0.0.1:8080/index.html &> result.out
Finally plot the percentile distribution:
hdr-plot --output myplot.png --title "My plot" ./result.out [...]
You can provide more files to be plotted on the same graph:
hdr-plot --output myplot.png --title "My plot" ./sample/file1.out ./sample/file2.out ./sample/file3.out
Copyright © 2018 Bruno Bonacci - Distributed under the Apache License v 2.0
