-
Notifications
You must be signed in to change notification settings - Fork 8.3k
Troubleshooting Tips
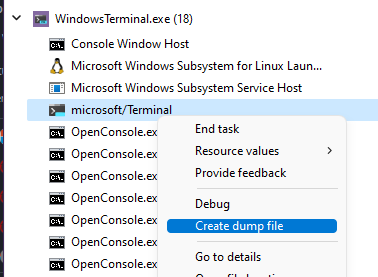
When the Terminal is frozen like this, could you grab a dump with Task Manager and send it to us?

In Windows, you can configure Windows Error Reporting (WER) to generate a dump when an application crashes.
- Open
regedit.exe - Open the key
HKEY_LOCAL_MACHINE\SOFTWARE\Microsoft\Windows\Windows Error Reporting\LocalDumps - Set the value
DumpFolder(REG_EXPAND_SZ) to the directory you want the dump to be created -
IMPORTANT: set
DumpType(DWORD) to2. We might not get all the relevant info without full dumps. - Optionally, you can prevent WER to keep lots of crash dumps by setting
DumpCount(DWORD) to a low number
(For more info, see this link).
Or, you could just run the following in PowerShell:
New-Item -Path "HKLM:\SOFTWARE\Microsoft\Windows\Windows Error Reporting" -Name "LocalDumps"
New-ItemProperty -Path "HKLM:\SOFTWARE\Microsoft\Windows\Windows Error Reporting\LocalDumps" -Name "DumpFolder" -Value "%LOCALAPPDATA%\CrashDumps" -PropertyType ExpandString
New-ItemProperty -Path "HKLM:\SOFTWARE\Microsoft\Windows\Windows Error Reporting\LocalDumps" -Name "DumpCount" -Value 10 -PropertyType DWord
New-ItemProperty -Path "HKLM:\SOFTWARE\Microsoft\Windows\Windows Error Reporting\LocalDumps" -Name "DumpType" -Value 2 -PropertyType DWord
This should get you a .dmp of the terminal whenever it crashes. You can zip the dump(s) up and send it to us, so we can investigate.
Once you're done you can delete the 3 values again:
Remove-ItemProperty -Path "HKLM:\SOFTWARE\Microsoft\Windows\Windows Error Reporting\LocalDumps" -Name "DumpFolder"
Remove-ItemProperty -Path "HKLM:\SOFTWARE\Microsoft\Windows\Windows Error Reporting\LocalDumps" -Name "DumpCount"
Remove-ItemProperty -Path "HKLM:\SOFTWARE\Microsoft\Windows\Windows Error Reporting\LocalDumps" -Name "DumpType"
(thanks to this post)
This kinda depends how you're comfortable sharing. It might have PII in it, definitely including whatever output was in the Terminal at the time. There's a little tradeoff between "how easy it is to share" vs "how private I want to be"
You can email it to @zadjii-msft (email address is in his profile), with the usual caveats of security that accompany email. If you're cool with that, ping him in the thread when you send it. A OneDrive (or similar) link would also work about the same.
For the more secure option: you can upload a .dmp to Feedback Hub, without making FH try to take the dump itself. If you just drag/drop the dmp to the "Attached" section of FH, it should upload it.

Make sure to share the aka.ms link that Feedback Hub generates with the "Share" button - it's impossible to find without that.
Admittedly, I've never had anyone try the "manually attach to feedback hub" option yet, so idk if that'll actually work 😅 Pick your poison!
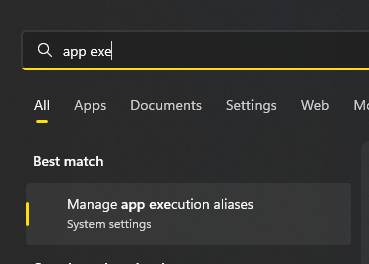
From Start menu search, look for "App execution alias", which should take you to the Settings app:


If that's enabled, then try running where wt. If that can't find it, then either the wt App Execution Alias isn't enabled, or your %PATH% is messed up.
First try toggling the App Execution Alias for WT off then in the Settings app.
If that doesn't work, then make sure C:\Users\<your user>\AppData\Local\Microsoft\WindowsApps\ is on your PATH.
Still doesn't work? Run reg query "HKCU\Software\Microsoft\Windows\CurrentVersion\App Paths\wt.exe" /s in a Command Prompt. The output should look like:
HKEY_CURRENT_USER\Software\Microsoft\Windows\CurrentVersion\App Paths\wt.exe
    (Default)    REG_SZ    C:\Program Files\WindowsApps\Microsoft.WindowsTerminalCanary_1.20.3391.0_x64__8wekyb3d8bbwe\wt.exe
    Path    REG_SZ    C:\Program Files\WindowsApps\Microsoft.WindowsTerminalCanary_1.20.3391.0_x64__8wekyb3d8bbwe
(depending on version and branding).
If it doesn't, then something's really messed up.
- Download the
Terminal.wprpfile from this repository somewhere on your PC. For example, let's put the file atC:\path\to\Terminal.wprp - From an elevated commandline, run:
wpr -start GeneralProfile -start C:\path\to\Terminal.wprp!DefTerm.Verbose
- Reproduce the error.
- Go back to the elevated commandline window and run:
wpr -stop terminal-trace.etl
- Take the
terminal-trace.etlfile and send it to the person who requested that you follow this guide.
The "debug tap" is a special mode that lets you see exactly which characters are being sent to the terminal, and exactly what input the Terminal is sending to the client application. This is particularly helpful for debugging rendering and input issues.

To enable the debug tap:
- Enable debug features by adding
"debugFeatures": true,to the global settings - Hold both the left and right alt keys, and open a new tab. What you should see is a tab with two panes in it, and the second one will have the "debug tap", showing all the input and output sent to the Terminal.
At this point, you should repro your issue, and be able to see everything that's in/output to the Terminal. If you've been asked to use the debug tap to repro your issue, please copy the output in the second pane to your reply. If your issue has anything to do with input, then maybe also share a screenshot, so we can differentiate between the output and input (the red text).
It's dangerous to go alone, take this: win32-input-decoder.py (gist).
That's a simple python script to try and decode debug tap output to something human-readable
This ony really applies for WSL bugs.
Run script, and then reproduce the issue. It should produce a document named typescript that contains the raw output from the application that we're receiving in the Terminal. Share that typescript file with us.
This should break into the debugger when there's a DX error
d3dconfig apps --add WindowsTerminal.exe
d3dconfig debug-layer debug-layer-mode=force-on
d3dconfig message-break allow-debug-breaks=true
Then to reset:
d3dconfig --reset