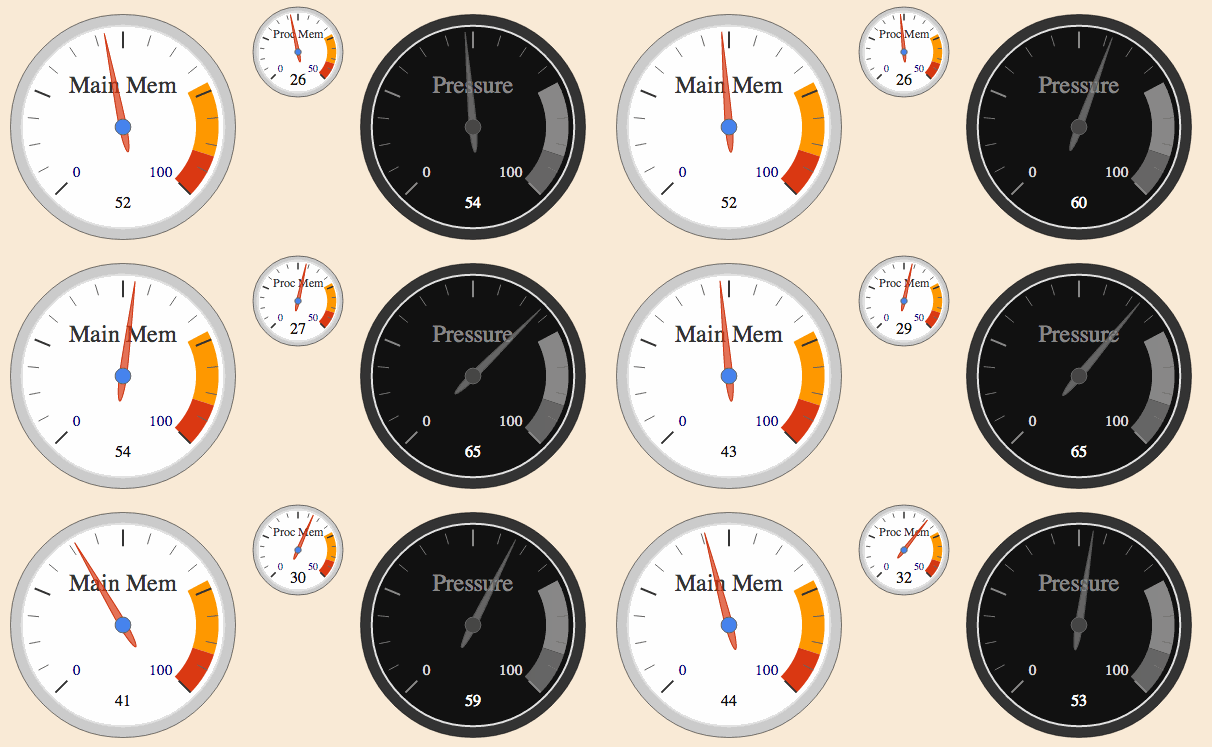
Gauge visualization built on top of d3.
var d3gauge = require('d3-gauge');

var gauge = d3gauge(document.getElementById('simple-gauge'));
gauge.write(39);
Note: please make sure to include the appropriate css in your page, otherwise all you'll see is a big black
circle.
npm install d3-gauge
npm explore d3-gauge
npm run demo####gauge (el[, opts])*
Creates a gauge appended to the given DOM element.
@name Gauge @function params:
- el DOMElement to which the gauge is appended
- opts Object gauge configuration with the following properties all of which have sensible defaults:
- label {String} that appears in the top portion of the gauge
- clazz {String} class to apply to the gauge element in order to support custom styling
- size {Number} the over all size (radius) of the gauge
- min {Number} the minimum value that the gauge measures
- max {Number} the maximum value that the gauge measures
- majorTicks {Number} the number of major ticks to draw
- minorTicks {Number} the number of minor ticks to draw in between two major ticks
- needleWidthRatio {Number} tweaks the gauge's needle width
- needleConatinerRadiusRatio {Number} tweaks the gauge's needle container circumference
- transitionDuration {Number} the time in ms it takes for the needle to move to a new position
- zones {Array[Object]} each with the following properties
- clazz {String} class to apply to the zone element in order to style its fill
- from {Number} between 0 and 1 to determine zone's start
- to {Number} between 0 and 1 to determine zone's end
returns:
Object the gauge with a write method
Note: have a look at the default opts
###gauge.write = function(value, transitionDuration)
Writes a value to the gauge and updates its state, i.e. needle position, accordingly. @name write @function params:
- value Number the new gauge value, should be in between min and max
- transitionDuration Number (optional) transition duration, if not supplied the configured duration is used
d3-gauge can be custom styled and none of the features are visible if no style is included at all.
Please have a look at the styles included here in order to get an idea of what parts you can tweak to your liking.
This implementation was highly inspired by this post.
Although lots of work went into cleaning the code up and making the gauge configurable and stylable, the main idea came from there.
MIT

