The Tableau statistical analysis and visualizations can be found by clicking here.
The purpose of this analysis of the NYC Citi Bike Dataset is to convey readable and digestible data to convince investors that a bike-sharing idea could work in Des Moines, Iowa. The idea is to persuade the investors by sequencing visualizations to help them understand the bigger picture.
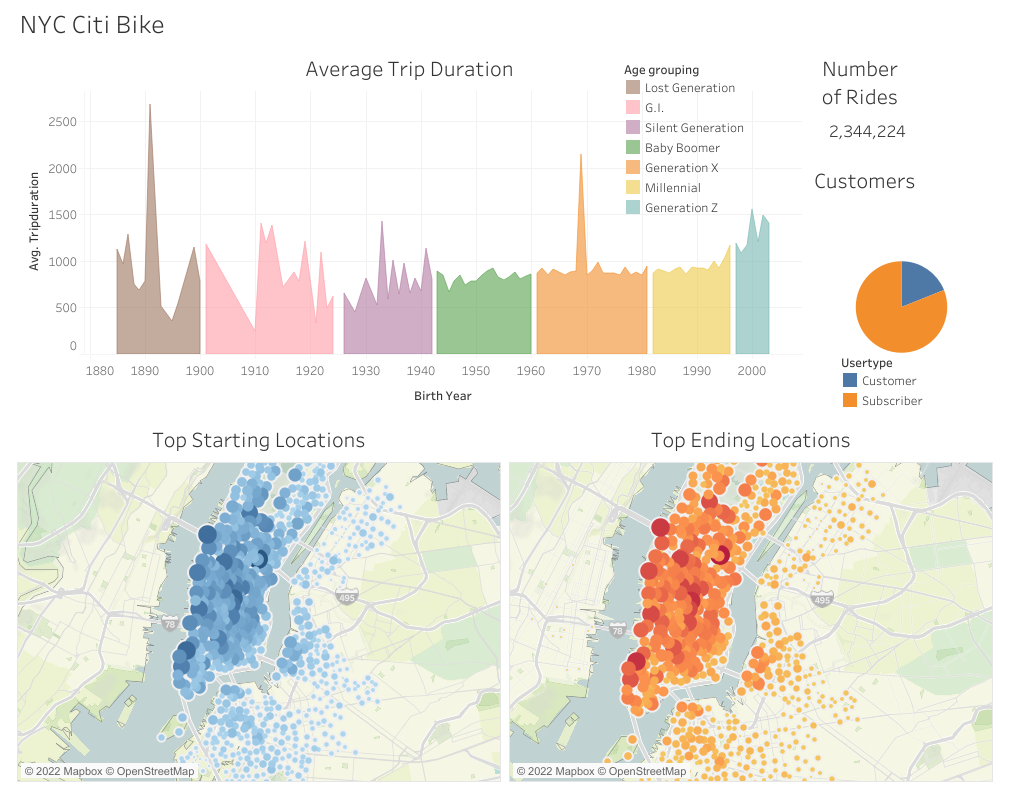
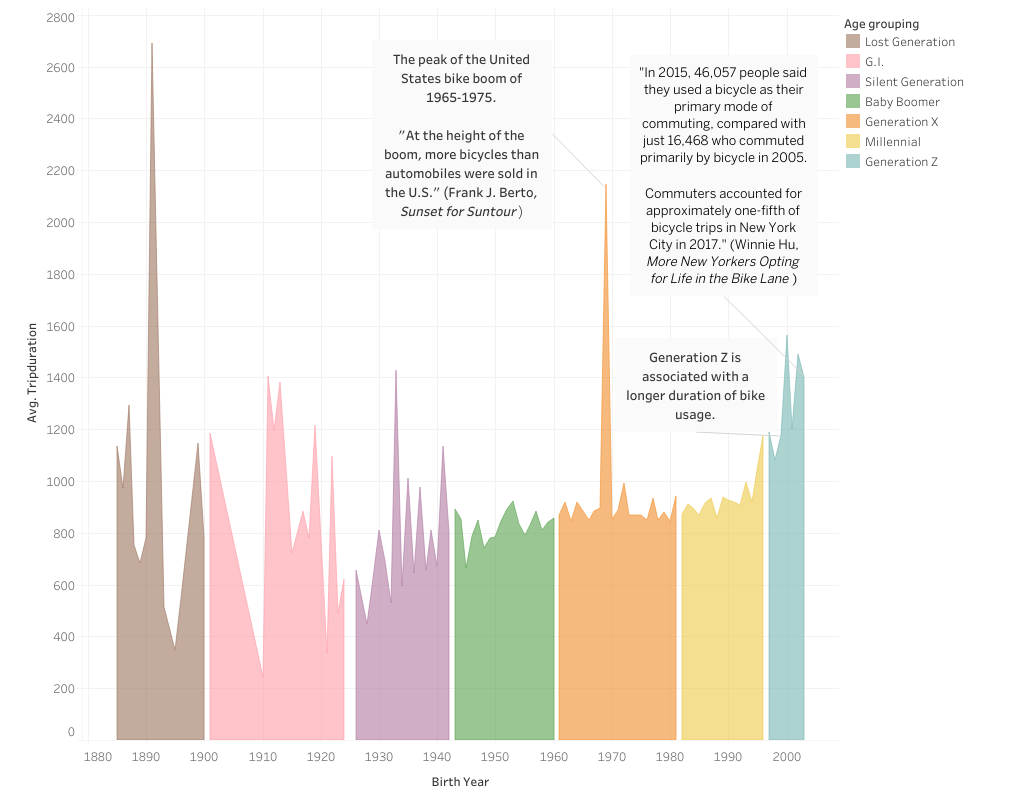
- Generation Z is using the bike share for a longer duration
- The duration of bike share usage is about the same for Baby Boomers, Generation X, and Millennials
- Subscriber is the majority of the user type
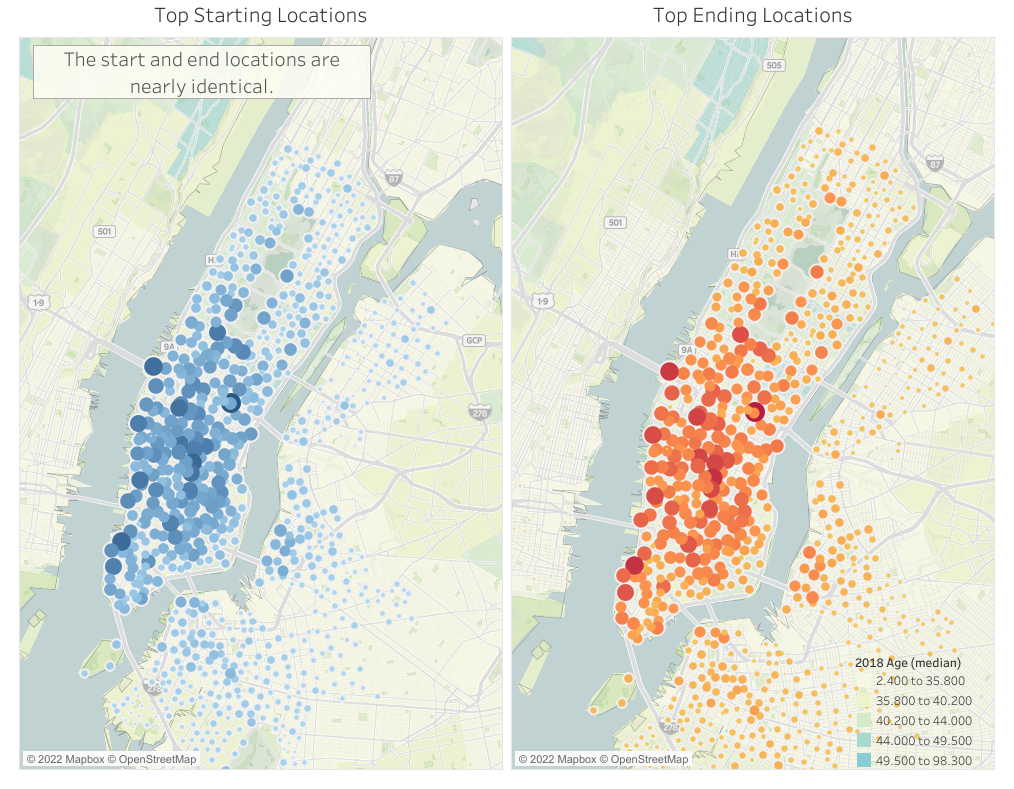
- Manhattan is a dense location with many individuals who can commute to work or school with a bike
- Manhattan is a heavy tourism area where customers can utilize the bike sharing
We can infer that since the start and end locations of the bike drop-offs are nearly identical, the majority of the users are using the bikes for commuting to work or school
- The average trip duration of Generation Z is significantly higher than the previous generations
- The percentage of individuals under the age of 18 years old according to the 2020 Census:
- Manhattan, New York: 14.3%
- Des Moines, Iowa: 23.8%
Generation Z individuals have high demand for bike-sharing. Therefore, a bike-sharing business in De Moines provides an excellent business opportunity due to the higher rate of individuals under 18 years old in Des Moines, Iowa.
The 1969 average trip duration is an outlier case and may be associated with the United States bike boom, where more bicycles than cars were sold in the United States. One speculation is that these individuals have a passion for bike riding; however, further data is necessary to analyze this outlier case
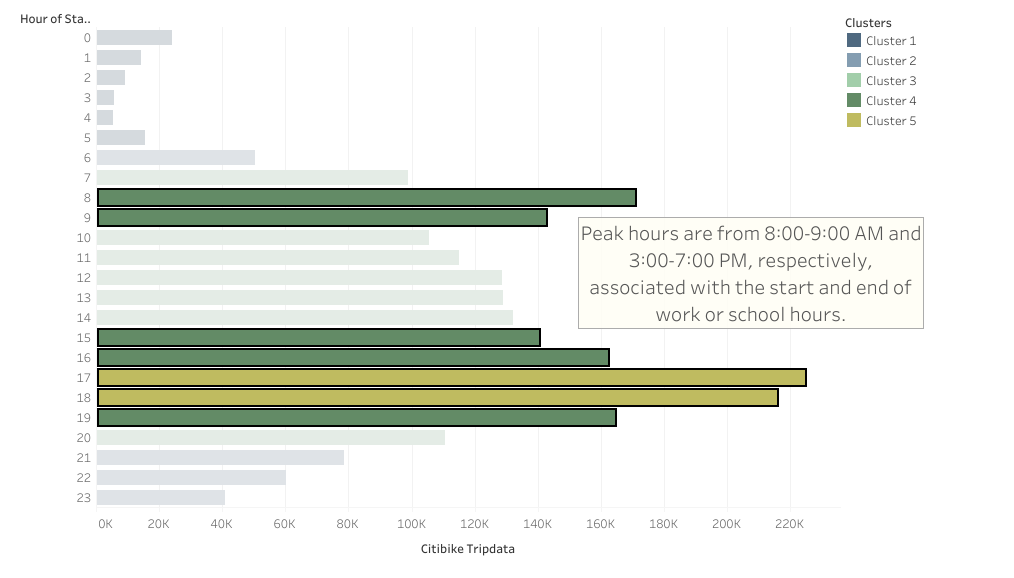
- Peak hours:
- Morning: 8:00 AM - 9:00 AM
- Afternoon: 3:00 PM - 7:00 PM
- Off hours:
- Nighttime: 1:00 AM - 4:00 AM
The peak bike usage hours are associated with a range of hours of which individuals start and end work or school.
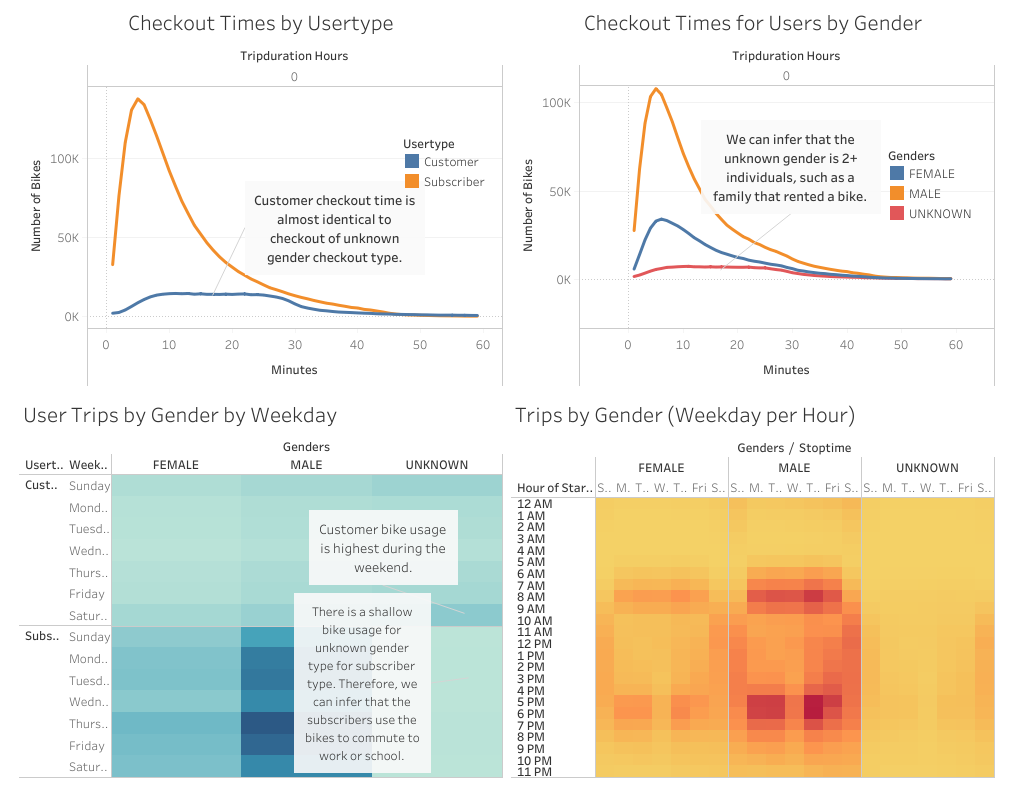
The line chart of Checkout Times by Usertype and Checkout Times for Users by Gender indicates that the primary user type of customer is the unknown gender type. Additionally, the unknown gender category primarily falls under customer user type. Therefore, we can speculate that the unknown category is two or more individuals, such as a family who rented bikes.
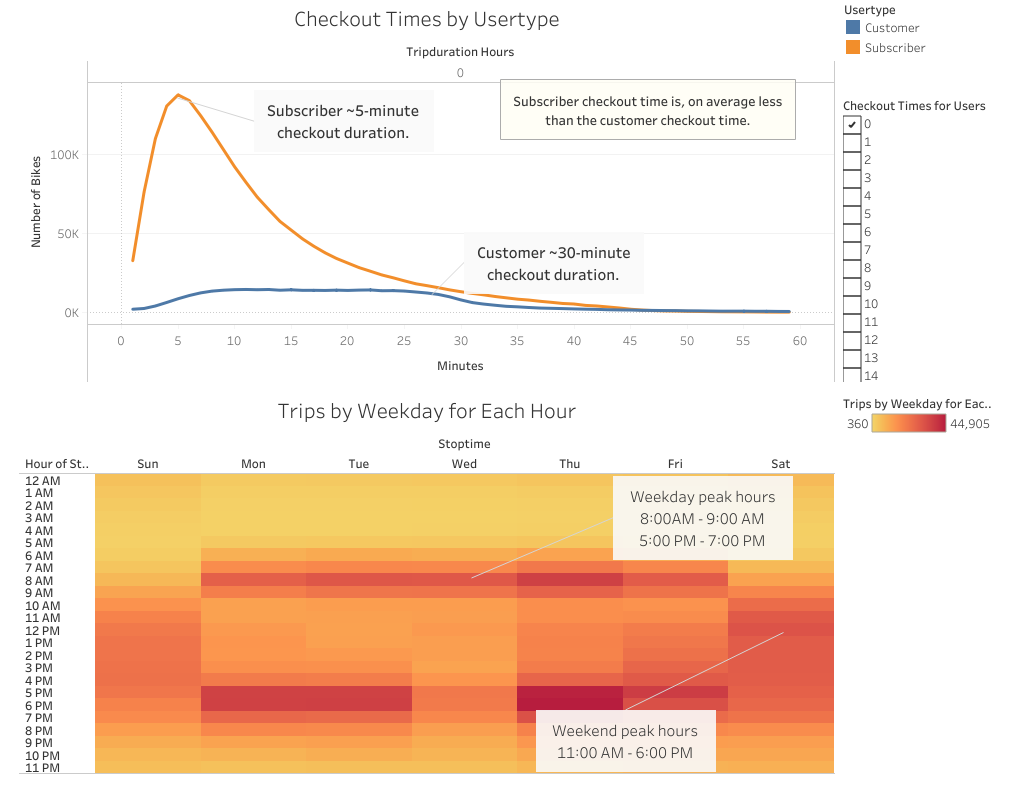
- Checkout duration:
- Subscriber: ~5 minute duration
- Customer: ~30 minute duration
- Peak hours:
- Weekdays: 8:00 AM - 9:00 AM and 5:00 PM - 7:00 PM
- Weekends: 11:00 AM - 6:00 PM
Subscribers' short bike checkout duration supports the speculation that these bikes are primarily used during the weekday for commuting to work or school. Conversely, bikes with a lengthy checkout time are used on weekends for recreation.
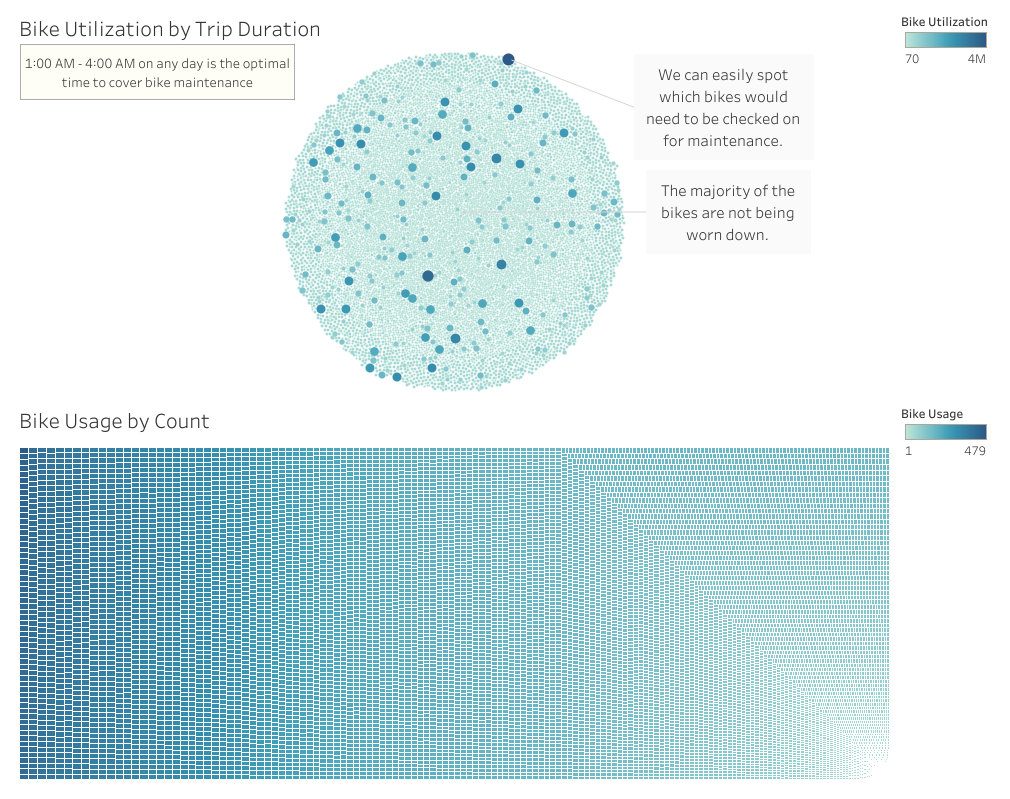
As seen on the previous charts, bikes' hours are not being used are from 1:00 AM - 4:00 AM. This timeframe provides an opportunity for a night crew to conduct bike maintenance and repairs. In addition, the bikes used most often can easily be spotted and prioritized for maintenance with ease.
In Des Moines, Iowa, a bike-sharing business could be a profitable venture. The analyzed data suggest that individuals are likely to subscribe to a bike-sharing service and use bicycle sharing to commute to work or school. The benefits for the users of bicycle-sharing are reduced costs (compared to automobile or maintenance costs), ease of bike access within the city, improving physical and mental health, and being environmentally friendly by reducing carbon emissions. Additionally, Des Moines, Iowa, has an established trail system that allows effortless navigation.
Future analysis could include visualizations of weather data to determine the impact of weather conditions on bicycle usage. Additionally, mapping locations of schools, universities, and significant businesses can aid in deciding where to place bicycles strategically.
- Data Source:
201908-citibike-tripdata.csv.zip - Source Code:
NYC_CitiBike_Challenge.py - Tableau Analysis:
NYC Citi Bike Analysis - Software:
Python 3.8.8,DataSpell 2021.3,Tableau Desktop Public 2021.4.3
