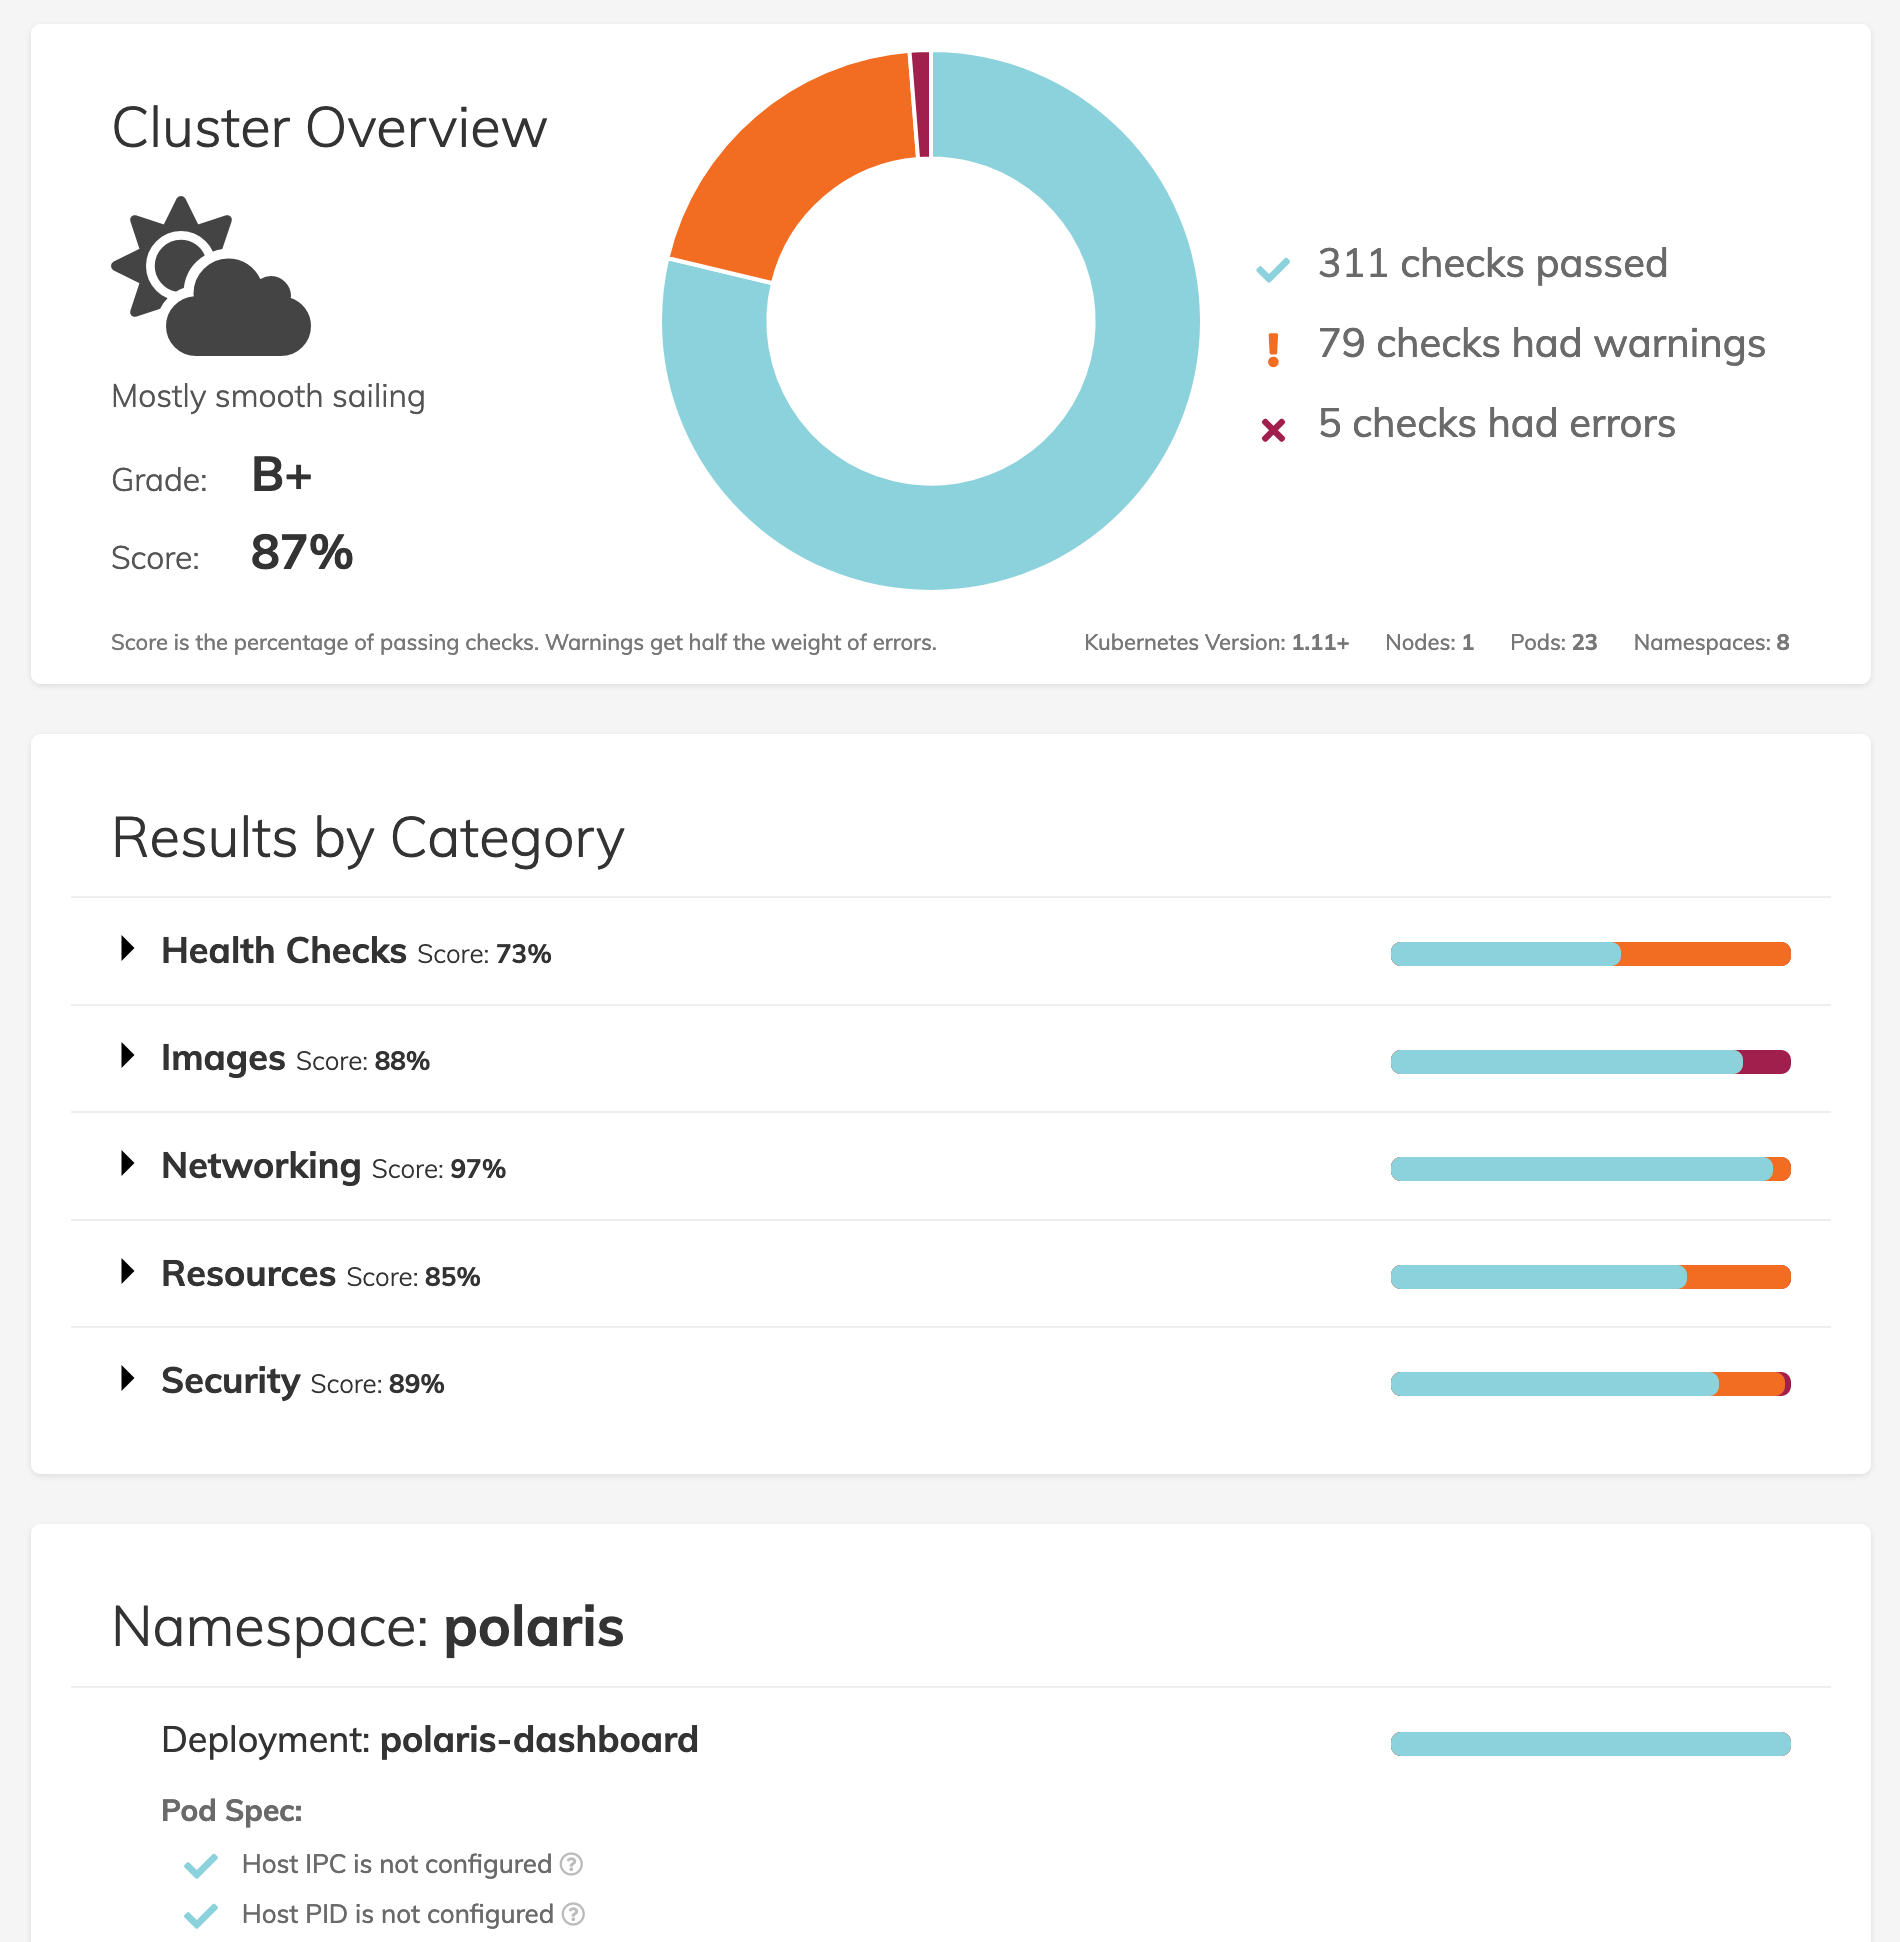
Polaris helps keep your cluster healthy. It runs a variety of checks to ensure that Kubernetes deployments are configured using best practices that will avoid potential problems in the future. The project includes two primary components:
- A dashboard that provides an overview of how well current deployments are configured within a cluster.
- An experimental validating webhook that can prevent any future deployments that do not live up to a configured standard.
Want to learn more? ReactiveOps holds office hours on Zoom the first Friday of every month, at 12pm Eastern. You can also reach out via email at [email protected]
kubectl apply -f https://github.com/reactiveops/polaris/releases/latest/download/dashboard.yaml
kubectl port-forward --namespace polaris svc/polaris-dashboard 8080:80
With the port forwarding in place, you can open https://localhost:8080 in your browser to view the dashboard.
The Polaris dashboard is a way to get a simple visual overview of the current state of your Kubernetes deployments as well as a roadmap for what can be improved. The dashboard provides a cluster wide overview as well as breaking out results by category, namespace, and deployment.
Our default standards in Polaris are rather high, so don’t be surprised if your score is lower than you might expect. A key goal for Polaris was to set a high standard and aim for great configuration by default. If the defaults we’ve included are too strict, it’s easy to adjust the configuration as part of the deployment configuration to better suit your workloads.
Polaris includes experimental support for an optional validating webhook. This accepts the same configuration as the dashboard, and can run the same validations. This webhook will reject any deployments that trigger a validation error. This is indicative of the greater goal of Polaris, not just to encourage better configuration through dashboard visibility, but to actually enforce it with this webhook. Although we are working towards greater stability and better test coverage, we do not currently consider this webhook component production ready.
Unfortunately we have not found a way to display warnings as part of kubectl output unless we are rejecting a deployment altogether. That means that any checks with a severity of warning will still pass webhook validation, and the only evidence of that warning will either be in the Polaris dashboard or the Polaris webhook logs.
Polaris can be installed on your cluster using kubectl or Helm. It can also be run as a local binary, which will use your kubeconfig to connect to the cluster or run against local YAML files.
kubectl apply -f https://github.com/reactiveops/polaris/releases/latest/download/dashboard.yaml
kubectl port-forward --namespace polaris svc/polaris-dashboard 8080:80
kubectl apply -f https://github.com/reactiveops/polaris/releases/latest/download/webhook.yaml
Start by adding the ReactiveOps Helm repo:
helm repo add reactiveops-stable https://charts.reactiveops.com/stable
helm upgrade --install polaris reactiveops-stable/polaris --namespace polaris
kubectl port-forward --namespace polaris svc/polaris-dashboard 8080:80
helm upgrade --install polaris reactiveops-stable/polaris --namespace polaris \
  --set webhook.enable=true --set dashboard.enable=false
Binary releases are available on the releases page or can be installed with Homebrew:
brew tap reactiveops/tap
brew install reactiveops/tap/polaris
polaris --version
You can run polaris --help to see a full list of options.
The dashboard can be run on your local machine, without installing anything on the cluster. Polaris will use your local kubeconfig to connect to the cluster.
polaris --dashboard --dashboard-port 8080
You can also run audits on the command line and see the output as JSON, YAML, or a raw score:
polaris --audit --output-format yaml > report.yaml
polaris --audit --output-format score
# 92
Both the dashboard and audits can run against a local directory or YAML file rather than a cluster:
polaris --audit --audit-path ./deploy/
You can integrate Polaris into CI/CD for repositories containing infrastructure-as-code. For example, to fail whenever the Polaris score drops below 90%:
score=`polaris --audit --audit-path ./deploy/ --output-format score`
if [[ $score -lt 90 ]]; then
  exit 1
else
  exit 0
fiPolaris supports a wide range of validations covering a number of Kubernetes best practices. Here's a sample configuration file that includes all currently supported checks. The default configuration contains a number of those checks. This repository also includes a sample full configuration file that enables all available checks.
Each check can be assigned a severity. Only checks with a severity of error or warning will be validated. The results of these validations are visible on the dashboard. In the case of the validating webhook, only failures with a severity of error will result in a change being rejected.
Polaris validation checks fall into several different categories:
config: Specify a location for the Polaris configdashboard: Runs the webserver for Polaris dashboard.dashboard-port: Port for the dashboard webserver (default8080)dashboard-base-path: Path on which the dashboard is being served (default/)webhook: Runs the webhook webserver.webhook-port: Port for the webhook webserver (default9876)disable-webhook-config-installer: disable the installer in the webhook server, so it won't install webhook configuration resources during bootstrappingkubeconfig: Paths to a kubeconfig. Only required if out-of-cluster.
PRs welcome! Check out the Contributing Guidelines, Code of Conduct, and Roadmap for more information.
A history of changes to this project can be viewed in the Changelog
If you'd like to learn more about Polaris, or if you'd like to speak with
a Kubernetes expert, you can contact [email protected] or visit our website
Apache License 2.0

