Assessing genome assemblies by comparing k-mer copies in assemblies and k-mer abundance in reads
See a case run at case_Ecoli
C He, G Lin, H Wei, H Tang, FF White, B Valent, S Liu. (2020). Factorial estimating assembly base errors using k-mer abundance difference (KAD) between short reads and genome assembled sequences, NAR Genomics and Bioinformatics, 2:lqaa075 link
KAD is designed for evaluating the accuracy of nucleotide base quality of genome assemblies. Briefly, abundance of k-mers are quantified for both sequencing reads and assembly sequences. Comparison of the two values results in a single value per k-mer, K-mer Abundance Difference (KAD), which indicates how well the assembly matches read data for each k-mer.
where, c is the count of a k-mer from reads, m is the mode of counts of read k-mers, and n is the copy of the k-mer in the assembly.
The script was written with Perl and R is invoked. Both Perl and R are generally installed. If needed, please refer to Perl and R for installation guides. To generate reports, pandoc and R packages knitr and rmarkdown are needed to be installed.
Jellyfish is used to generate k-mers by using either FASTA or FASTQ data. The binary Jellyfish executable is included in the bin directory of the KAD package.
To run KADdist.pl, bowtie and bedtools are required.
Aternatively, all required packages can be installed through conda
conda create -n kad
conda activate kad
conda install -c anaconda perl
conda install -c r r-base r-knitr r-rmarkdown
conda install -c bioconda pandoc bowtie bedtools
Basically, the installation is just to copy all KAD files in a directory. KAD can be directly used afterwards.
git clone https://github.com/liu3zhenlab/KAD.git
perl ./KAD/KADprofile.pl
1. Read data
Illumina sequencing reads with 40x or higher sequence depth. Trimmed clean reads or error corrected reads are preferred. Raw data without trimming are not recommended.
2. Assembly data
Assembly sequencing data in FASTA format. Each assembly is in a single FASTA file.
-
KADprofile.pl: producing KAD profiles for input assemblies.
Usage: perl KADprofile.pl [options]
[Options]
--read <file>: *FASTQ/A file of reads (required)
the parameter can be used multiple times; zip files with the suffix of .gz are allowed. required.
--asm <file>: *FASTA file of the assembly (required)
the parameter can be used multiple times to allow using multiple FASTA file;
each file is considered an indepedent assembly.
--threads <num>:number of cpus (1)
--minc <num>: minimal number of counts per k-mer from reads (5)
k-mers with counts smaller than <num> are not output.
--rid <str>: ID used in the header of the k-mer table generated from reads.
--aid <str>: ID used in the header of the k-mer table generated from an assembly;
the parameter can be used multiple times to match --asm inputs.
By default, a header ID is generated from the file name of each assembly
by removing PATH and the suffix of .fa, .fas, or .fasta.
IMPORTANT: If multiple --aid parameters are specified, their order must match corresponding --asm order.
--prefix <str>: the output directory and the prefix for output files (kad).
--klen <num>: length of k-mers (25).
--kadcutoff : a set of numbers to define k-mer categories; default="-1 -0.5, 0.5, 0.75, 2".
This parameter is used to categorize k-mers into:
1.OverRep: over-represented k-mers (KAD<-1; higher abundance in the assembly than indicated by reads);
2.Good: correct k-mer (-0.5 <= KAD <= 0.5; relatively equal abundance);
3.LowUnderRep: a low-level of under-represented k-mers (0.75 <= KAD < 2; lower abundance in the assembly);
4.HighUnderRep: a high-level of under-represented k-mers (KAD >= 2; lower abundance in the assembly).
Note: error k-mers (Error) are k-mers with KADs equaling -1, which is unrelated to this parameter.
--readdepth : estimated depth of reads; not required; if specified, it will be used to evaluate the accuracy of "cmode".
--binlen : length of KAD interval for KAD statistics; similar to bin size for determining KAD histogram (0.05)
--version: version information
--help: help information -
KADdist.pl: generating distributions of error and other k-mers on contigs or chromosomes.
Usage KADdist.pl [options]
[Options]
--kad|k : KAD output file from KADprofile.pl (required).
--aid|i : assembly ID in the header of KAD file (required).
--asm|a : assembly FASTA file, including path (required).
--mincopy|m : k-mers with at least --mincopy in the assembly will be aligned to the assembly (1).
--maxcopy|i : k-mers with at most --maxcopy in the assembly will be aligned to the assembly (100).
--winsize|w : window size on which the number of each KAD type is counted (50000).
--kadcutoff|s : same to --kadcutoff in the KADprofile.pl ("-1 -0.5 0.5 0.75 2").
This parameter is used to categorize k-mers into:
1.OverRep: over-represented k-mers (KAD <= -1; higher abundance in the assembly than indicated by reads);
2.Good: correct k-mer (-0.5 <= KAD <= 0.5; relatively equal abundance);
3. LowUnderRep: a low-level of under-represented k-mers (0.75 <= KAD < 2; lower abundance in the assembly);
4. HighUnderRep: a high-level of under-represented k-mers (KAD >= 2; lower abundance in the assembly).
Note: error k-mers (Error) are k-mers with KADs equaling -1, which is unrelated to this parameter.
--prefix|p : the output directory and the prefix for output files (KADdist).
--minwin4plot|n : contigs or chromosomes with minimum window number (--minwin4plot) will be plotted (10).
--pdfoutdir|o : the subdirectory under --prefix directory for PDF outputs (pdf).
--help: help information. -
KADcompare.pl: comparing k-mers with unequal KADs between two assemblies.
Usage: perl KADcompare.pl [options] <kad>
note: <kad> is the output generated by KADprofile.pl, which containing KAD values of k-mers.
[Options]
--set1: *assembly ID 1 in the <kad> file (required).
--set2: *assembly ID 2 in the <kad> file (required).
--prefix: the output directory and the prefix for output filess (KC).
--binlen: bin length to count KAD (0.05).
--force: overwrite the existing directory if specified; if not, quit if the output directory exists.
--help: help information
Analysis 1. KAD profiling
This analysis will generate KAD profiles for each input assembly. You will see numbers of total k-mers, good k-mers, error k-mers, and k-mers of other groups of each assembly.
how to run
Let us say you have three assembly versions, as shown in the data directory:
- asm0.fas
- asm1.fas
- asm2.fas
You also have a read set:
- read1.fq.gz
- read2.fq.gz
Data note: These are 2x150bp paired-end reads with 0.2% errors simulated from asm0.fas. The simulated assembly data asm1 and asm2 contain ~1% and ~5% differences from asm0, respectively.
Assuming the Perl script was in the directory of scriptpath, run the following script to generate KAD profiles for all three assemblies.
perl <scriptpath>/KADprofile.pl --read read1.fq.gz --read read2.fq.gz \
                              --asm asm0.fas --asm asm1.fas --asm asm2.fas
You might want to assign names of all three assemblies with new names different from file names, such as a0, a1, and a2.
perl <scriptpath>/KADprofile.pl --read read1.fq --read read2.fq \
                              --asm asm0.fas --asm asm1.fas --asm asm2.fas \
                              --aid a0 --aid a1 --aid a2
The number and order of --aid inputs MUST match with --asm inputs.
The parameter --minc might need to change to avoid the interference from a great number of low counts (e.g. 1-3) from error sequences. By default, it is set to 5. However, if high-depth data (e.g., >100x) are generated, the number needs to be increased. Approximately 1/10 of the estimated depth might be a reasonable cutoff.
If corrected reads are used, --minc can be set to a small number (e.g., 3).
perl <scriptpath>/KADprofile.pl --read read1.fq.gz --read read2.fq.gz \
                              --asm asm0.fas --asm asm1.fas --asm asm2.fas \
                              --aid a0 --aid a1 --aid a2 \
			      --prefix 1-KADprofile
A html report in the report subdirectory is generated from each run. Check the report.
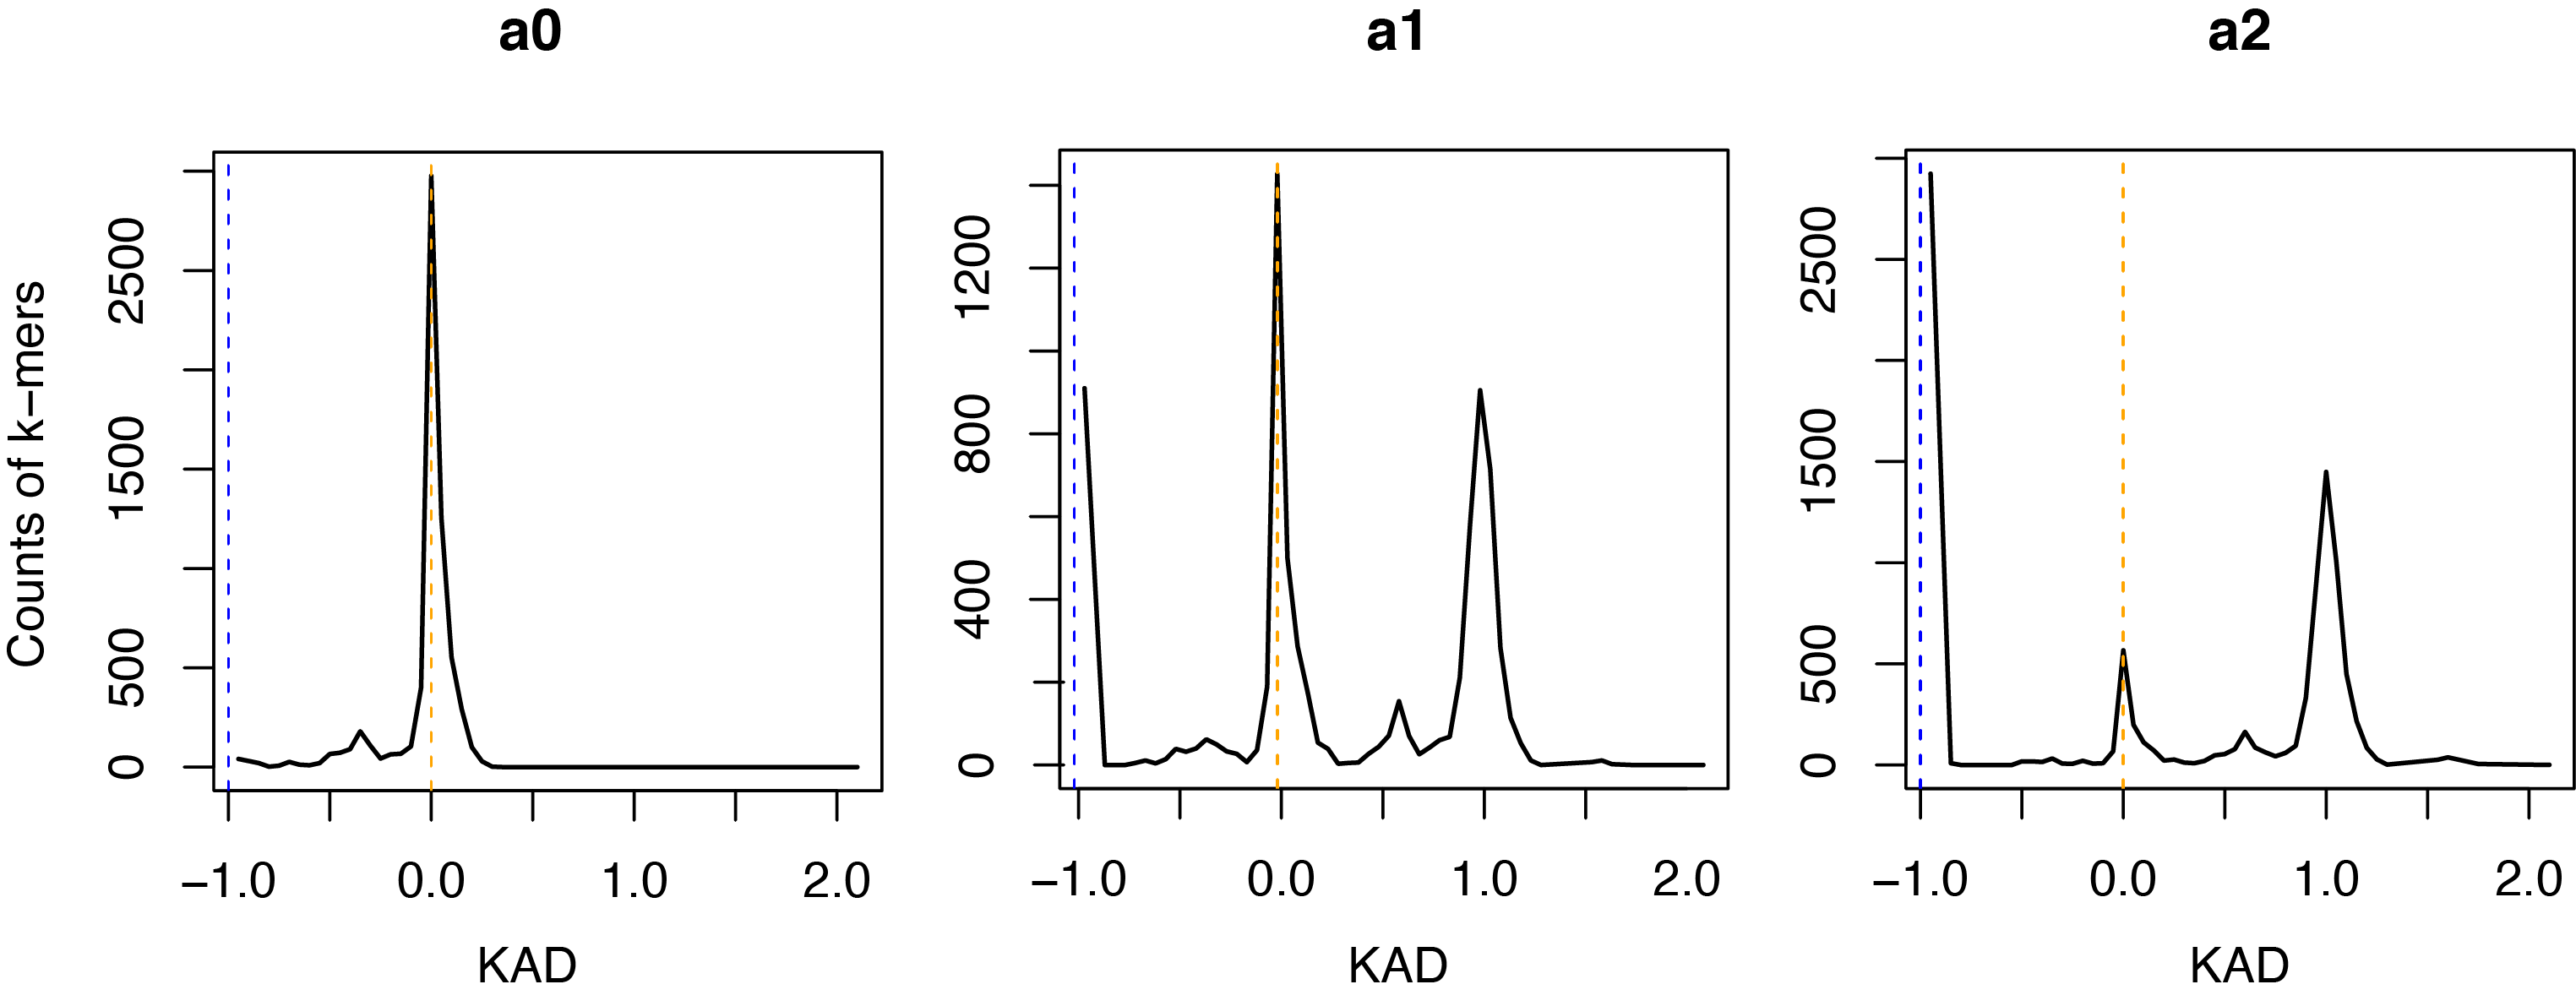
A KAD profile plot was generated for each assembly. Here are three KAD profile plots:
Analysis 2. k-mer distribution on contigs or chromosomes of an assembly
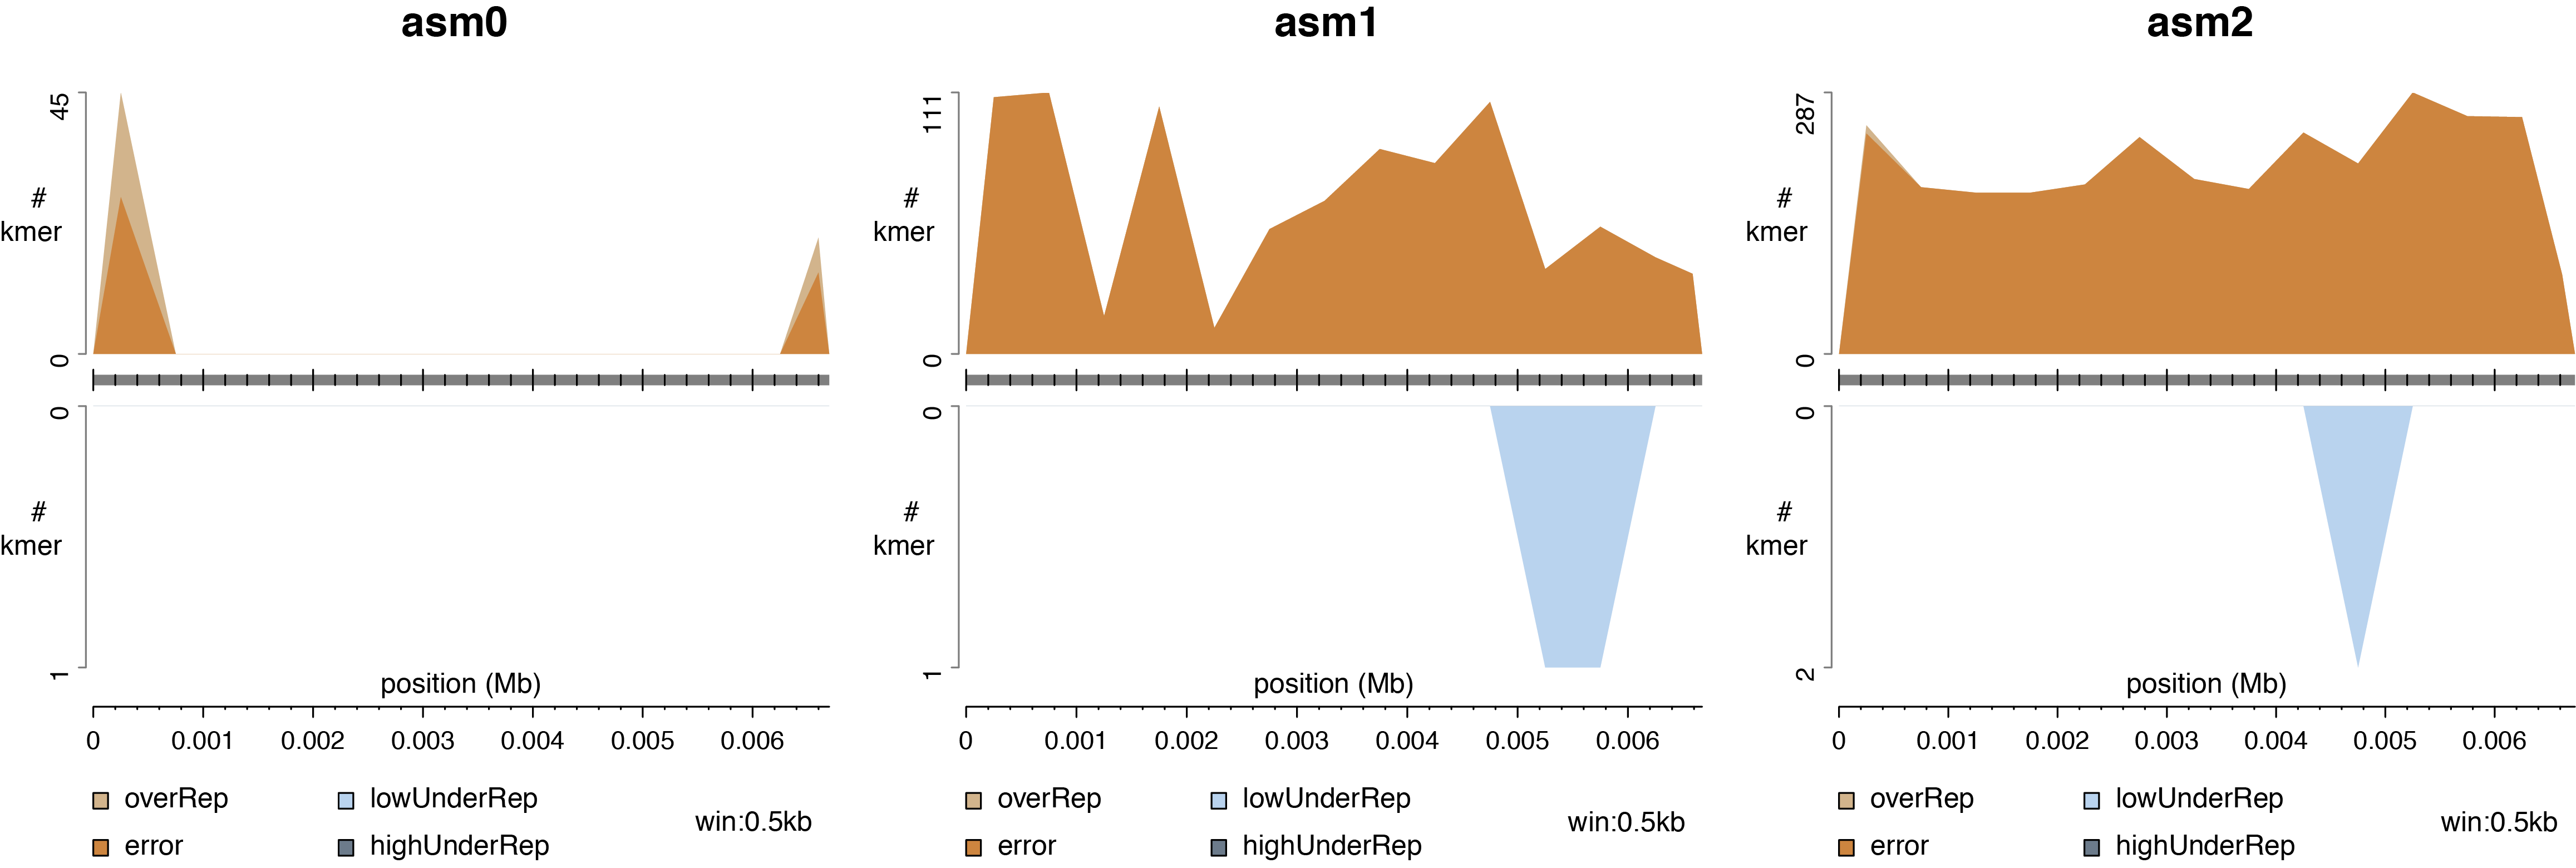
Based on KAD values of k-mers from Analysis 1, problematic k-mers can be categorized into "error", "overRep", "lowUnderRep", and "highUnderRep", representing k-mers with errors, over-represention, low levels of under-representation, and high levels of under-representation in the assembly. The script KADdist.pl maps these k-mers to the assembly and combines the KAD value each k-mer to produce:
- a wiggle track format (wig) file
- a bigwig file for visualization
- mapping location of error k-mers
- plots of distributions of problematic k-mers
how to run
For example, from Analysis 1, the assembly a0 (asm0.fas) was KAD profiled. With the ouput file suffixed with "kad.txt" from Analysis 1, distributions of problematic k-mers can be further analyzed. Below is the example script:
perl <scriptpath>/KADdist.pl \
--kad 1-KADprofile/1-KADprofile_4_kad.txt \
--prefix a0_dist \
--aid a0 --asm asm0.fas \
--winsize 500  # 500 minimum window size; added becaused this example has a small contig
Analysis 3. KAD comparison between two assemblies
This analysis will directly compare two assemblies based on KADs of the subset of k-mers that have unequal KADs.
After running the analysis using KADprofile.pl, KAD values are generated. In the examples directory, the file result_4_kad.txt contains KAD values. We now can select any two assemblies in this file to compare.
how to run
Assuming again the Perl script was in the directory of scriptpath, the following run compares a0 with a1. Note that the input --set1 and --set2 should match the assembly names used in the KAD file.
perl scriptpath/KADcompare.pl --set1 a0 --set2 a1 --prefix a0_a1 1-KADprofile/1-KADprofile_4_kad.txt
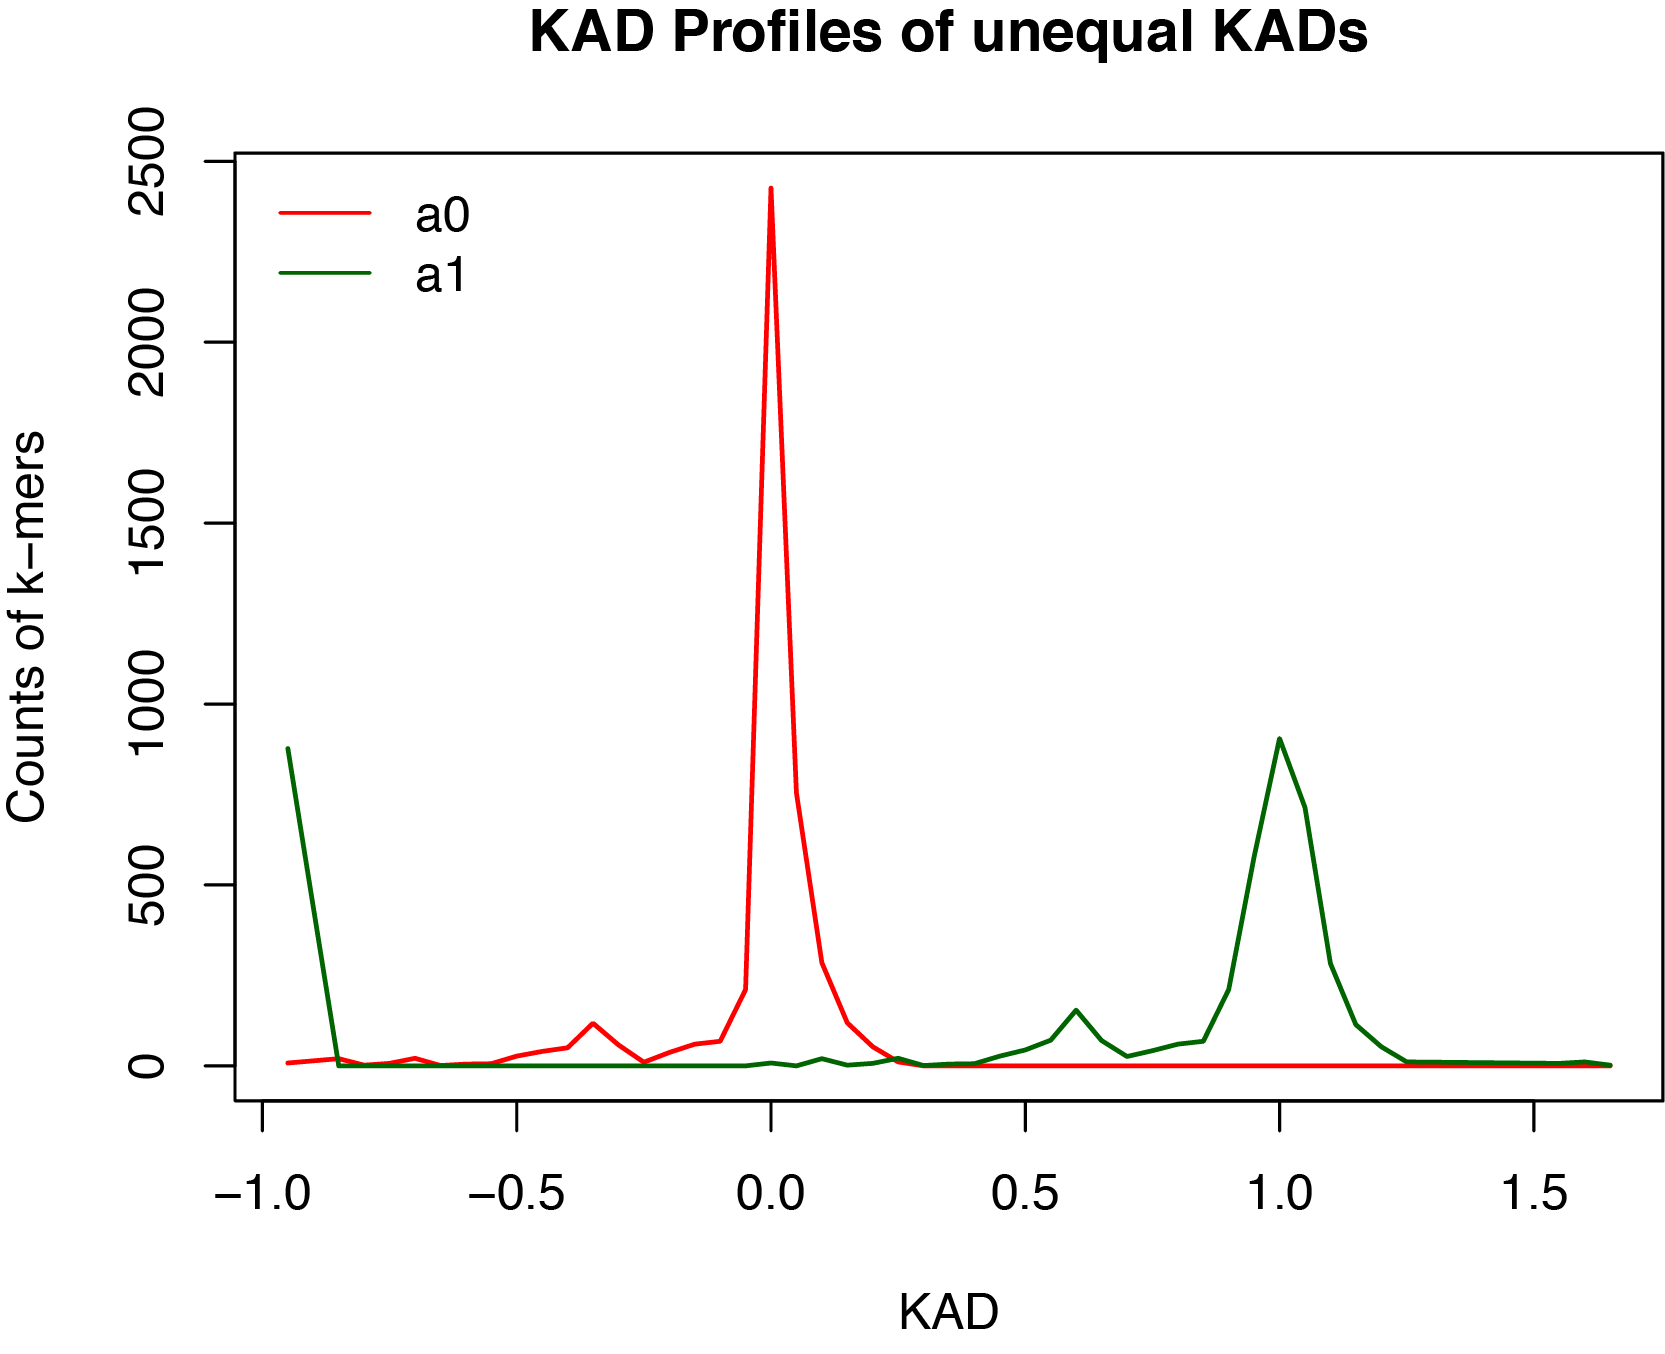
Here shows the comparison plot for the comparison between a1 and a0.
Notes: Here are what analysis 3 does:
First, the script extracts k-mers with unequal copies in the two assemblies. Two KADs per k-mer of the two assemblies are therefore different. Of two KADs per k-mer, one KAD may be NA because zero count of the k-mer from both reads and the assembly. These NAs are converted to 0 due to the agreement between reads and assembly data.
Second, the script counts KAD per defined bin, which, by default, is 0.05. Separate counts per bin of two assemblies are used for visualizing the two KAD profiles of k-mers with unequal KADs.
The result from three analyses indicates that ends of the sequence (a0) were not well sampled in reads. And most "LowUnderRef" k-mers of a1 and a2 assemblies are true k-mers found in reads but not identified in each assembly, which are replaced by actually error k-mers in the assemblies.


