Constructing an uncertainty index for Spain and assessing the predictive value on economic activity.
We construct an economic uncertainty index (EU) and an economic policy uncertainty (EPU) index for Spain following the policyuncertainty.com methodology exploited in Baker, Bloom and Davis [BBD].
We base the index on the archives of El Pais and Cinco Días.
Following BBD, we conduct two different exercises to explore the impact of policy uncertainty on economic activity.
First, we run a Vector Autoregression containing indicators for activity, inflation, sovereign spreads and European EPU index for the period 1987-2015. We see that uncertainty has a negative effect on activity. A one standard deviation shock in EPU decreases GDP growth by 0.18 points after 12 months. Uncertainty related to regulatory and fiscal policy has the largest impact.
Second, in a panel of stock quoted firm data from 2005 to 2016 companies in sectors exposed to public contracting suffer increased correlation between stock volatility and the EPU index, and also between volatility and government expenditure. More exposed companies show less wage expenses growth when uncertainty increases, although this effect is not signifficant. IBEX 35 volatility decreases wage growth more in sectors exposed to public contracting.
- How to replicate
- Presenting results
-
Python 2.7
-
Libraries
- bs4
- lxml
- selenium
- numpy
- pandas
- statsmodels
- matplotlib
- arch
- inquisitor
- python-levenshtein
- chromedriver.
- Inquirim API token
Create token. Used to retrieve macro data for the VAR estimation.
$ git clone https://github.com/OriolAndres/news_risk
Create settings.py file in top directory ("news_risk/settings.py") and define the following lines:
import os
token = '<inquirim_api_token>' ## https://www.inquirim.com/account/api/
chromedriver = r"<path_to_chromedriver>\chromedriver.exe"
download_dir = r'<download_directory_chrome_and_firefox>'
rootdir = os.path.abspath(os.path.dirname(__file__))Caveat: Downloading the full archive generates 60 GB of files and may take several days depending on your internet connection and the behavior of the servers of elpais. It is recommended to split the job in parallel instances.
from news_risk.elpais import start_from_scratch
start_from_scratch() # downloads full economy archive from El Pais (1976-2016), matches articles against conditionsfrom news_risk.cincodias import main
main() # downloads full economy archive from Cinco Dias (2001-2016), matches articles against conditionsfrom news_risk.accounts import fetch_folder, fetch_list_by_sector, unzip, parse_xml
fetch_folder() # selenium (firefox) iterates over all companies to get all their reports
unzip() # zip to plain text
parse_xml() # extract company name, sales and salary expenses
fetch_list_by_sector() # list companies in each sectorWrite regular expressions for each company to match the company strings extracted from BOE. Patterns have been stored already in biz_meta_regex.csv.
from news_risk.boe import download_boe, catch_entities
download_boe() # download raw files containing awarded public works. Starts at 2005, ends at 2016.
catch_contractor_money() # extract who are awarded and how much they are paidfrom news_risk.stocks import fetch_folder
fetch_folder() ## selenium (chrome) to fetch stock price data for all components of Mercado Continuo
calculate_cv() ## Uses GARCH(1,1) to get semi-annual conditional daily volatilitiesfrom news_risk.elpais import estimate_VAR
estimate_VAR()European uncertainty index has previously been saved in euro_news.csv. Original xlsx file (policyuncertainty.com).
from news_risk.elpais import get_quarterly_regressors
get_quarterly_regressors() ## get macro data from Inquirim, load European uncertainty index / build Spain indices (EPU & EU)
from news_risk.accounts import run_regressions
run_regressions() ## Counts the projects each entity is awarded. Loads entity accounts data. Loads macro data. Runs firm level regressionsWe write a script to download the archive of El Pais, that runs from 4th May 1976 to today. The archive is split in two parts. The first system (May 4th 1976 to February 7th 2012) divides the daily editions into a handful of sections, including Economía, España and International. We focus on Economía. 71% of the editions contain between 10 and 30 articles in this section. In the second system (February 7th 2012 to today) sections do not exist and instead they carry a number of tags, which we can easily use to filter the archive, and in particular we can filter the articles tagged with "Economía". In 70% of the days between 20 and 60 articles have the tag. We cannot assume that all the articles in the old Economía section would be tagged with "Economía" and that all the tagged articles with "Economía" would be filed in the Economía section. If the propensity to show uncertainty changed the index would be distorted.
We run a similar script for Cinco Días by querying all articles tagged as "Economía". The Cinco Días archives start the 1st January of 2001 and end today. Both Cinco Días and El País belong to Prisa and share a similar digital newspaper classification.
We identify an article as showing economic uncertainty (EU) if it matches both of the following two conditions:
- Contains either one of the regular expressions 'incertidumbre' and '\binciert'.
- Contains the regular expression 'econ(o|ó)m(i|í)'
We identify an article as showing economic policy uncertainty (EPU) if it matches both of the conditions above and it satisfies this condition:
- Contains either of '\bimp(uesto|ositiv|onib)', '\btarifa', '\bregula(ci|ti|to)', '\bpol(i|í)tica', '\bgast(ar|o|a|os)\b', '\bpresupuest', '\bd(e|é)ficit', '\bbanc(o|a)[s]?[\s]*central', '\bbanco de españa', '\btribut'.
Then for both indices (EU and EPU) we sum all the matched articles in the month and divide by total number of articles in the month and escale the result to average 100. To rescale we use the mean value from May 1976 to January 2016.
The EPU has a monthly standard deviation of 62.6, the EU standard deviation is 61.4 and the correlation between both is 0.963.
The maximum of EPU was attained in March 2003 at 424. In January 2016, the index stands at 408, the second largest value in the historical series.
Check for instance 18th January 2016 for example of current hysteria.
“El auge del Black Friday en noviembre, que desincentivó las compras en diciembre, y la incertidumbre generada por la inestabilidad política, que afecta a la confianza del consumidor”

Articles from El Pais and Cinco Días are treated indifferently, the index will be built by aggregating articles from both sources.
In the figure below we display the EPU index of Spain and of Europe.

We create a number of categories to divide the uncertainty. These require the fulfilment of the EPU and the additional constraints that follow:
- Ingreso público; '\bimp(uesto|ositiv|onib)','\btarifa','\brecauda','\btribut','\biva\b','\birpf\b'
- Gasto público; '\bgast(ar|o|a|os)\b', '\bpresupuest', '(deuda|d(é|e)ficit) p(u|ú)blic', '\berario', 'pacto de estabilidad'
- Política monetaria; '\bbanc(o|a)[s]?[\s]*central', '\bbce\b', '\bbde\b', '\bbanco de españa', 'pol(i|í)tica monetaria'
- Política sanidad; '\bsani(tari|dad)', '\bhospital', '\bfarmac(ia|eu)', '\bm(e|é)dic(o|in)'
- Seguridad; 'seguridad nacional', '\bmilitar', '\bterrorismo', '\beta\b', 'minist(erio|ro) de defensa', 'fuerzas armadas'
- Regulación bancaria; 'supervis(ión|or) bancar', 'reformas? financiera', 'tests? de estrés', 'stress test', 'comisi(o|ó)n nacional', 'cnmv', 'fondo de (garant(i|í)a de )?dep(o|ó)sito', 'basilea'
- Regulación no bancaria; '\bregula(ci|ti|to)', 'convenio', '\blegisla', '\bley(es)?\b', 'monopol', '\bc(a|á)rtel', '\bderecho'
- Sostenibilidad deuda; 'deuda (sobera|p(ú|u)blic)', 'crisis de deuda', '\bdevalu', 'tipos? de cambio', '\bcambiari', '\beuro.?zona', '\brublo'
- Estado bienestar; 'seguridad social', 'asuntos? social', 'estado del bienestar', 'subsidi(o|a)', 'fondos? estructural'
- Política comercial; '\barancel', '\baduan(a|e)', 'tarifas?.{1,6}\b(expor|impor)', 'tratados?.{1,6}(libre.{1,6})?\bcomerc'
- Territorial; '\bdescentraliz', '\bindependent', '\bseparati', '\bsecesi(o|ó)n', '\bibarretx', '\bnacionalis', '\bterritorial'
- Política fiscal; Match if Ingreso público and/or Gasto público are a match.
- Regulación; Match if Regulación bancaria and/or Regulación no bancaria are a match.

The objective of this section is evaluating the impact of uncertainty on activity. There are threats on the validity of our analysis if the uncertainty index is an endogenous variable like in these scenarios:
1 Lower GDP increases uncertainty. Lower gdp increases variance due to market discontinuities (sticky prices, debt and bankruptcy). In addition negative outcomes are psychologically difficult to assess.
2 Could it be that variance increasing policies are correlated with other policy features? Bad politicians are unpredictable.
We address the endogeneity challenges by including in the analysis variables that would largely overshadow the uncertainty index if the hypothesis were correct. If hypothesis 1 is correct then the uncertainty effect would be reduced by adding stock index volatility. We see that the effect of the uncertainty index remains stable across specifications.
We collect the European EPU from the web of the authors. Also data on long term government bonds rates for Spain and Germany assembled by Banco de España, we find the premium of spanish bonds and obtain the monthly change. Then we get from Base de datos de Series de Indicadores de Coyuntura Económica the producer price index for Spain and get monthly log changes. And finally we fetch the FEDEA index of the business cycle as a proxy for activity, and take the monthly change. The time series vector runs from September 1987 to December 2015.
We run a VAR with these 4 components and the EPU for Spain, adding 6 lags of data in the equation. Finally we make use of linear algebra to calculate the orthogonalized impulse response function, which describes the path of the system in response to an exogenous shock in a variable. That is accomplished by inverting the autoregressive system into a moving average representation. In the figure below we plot the results of a standard deviation shock in the EPU in the ensuing 12 months. Values refer to monthly changes.

An increase in uncertainty of a standard deviation decreases the FEDEA index by 0.0328 after 12 months, a level which projected on real gdp would decrease growth by 0.0328*0.043*100 = 0.1424%. (4.3% is the cumulative effect of a full point shock in FEDEA on quarterly growth, estimated by VAR too.) The estimated impact the shock of uncertainty in January 2016 will have in gdp growth is hence 0.698 %. ( (408 - 100) / 62.6 = 4.92; 4.92 * 0.1424 = 0.698 ).
In the same setting we find that a 1 std negative shock in uncertainty increases the bond spread by 8.1 basis points and increases inflation by 0.05%, both 12 months after the shock.
We run the same specification for the EPU, EU, and each of the uncertainty variants. In the next table we display the effects on GDP of an uncertainty shock, and also the number of articles containing the particular terms. We find that regulatory and fiscal related uncertainty have the largest impact on GDP.
| Concept | Count | Effect on GDP (1 std negative shock) |
|---|---|---|
| Econ policy | 11043 | -0.1424 |
| Econ general | 14572 | -0.1806 |
| ingreso | 3148 | -0.0376 |
| gasto | 5389 | -0.1758 |
| money | 4737 | -0.1069 |
| sanidad | 757 | 0.0303 |
| seguridad | 548 | -0.0309 |
| banca | 664 | -0.0892 |
| othregula | 3786 | -0.1679 |
| deuda | 2938 | -0.0392 |
| bienestar | 1024 | -0.1153 |
| arancel | 199 | -0.0949 |
| autonomia | 652 | -0.0113 |
| fiscal | 6617 | -0.1775 |
| regula | 4114 | -0.1476 |

Given the complexity of any propositions based on VAR results, we set out to test the uncertainty implications on firm level data. We ask whether sectors that are more exposed to public contracts reduce activity more in the wake of policy uncertainty. A company profit function may not be a linear function of sales, because of rigities in investment and labor, hence companies facing an increase in uncertainty scale back operations.
We are going to assemble a panel data for stock quoted companies in the Mercado Continuo of Bolsa de Madrid. We assign them to a sector and find the relevance of public contracts in the sector. We find stock volatility, salary expenses and revenues for each company. We include in some regressions government final consumption expenditure over gdp from BDSICE-Ministerio de Economía.
We download H1 and FY accounts from CNMV and for each company we extract the salary expenses and sales in the semester. We use the sector classifications of CNMV. The resulting panel has 345 companies, where many do not have a figure for wages and will be excluded. The earliest accounts included are from 2005 and the latest from 2015. Companies reporting usually does not span the full interval.
We look for consolidated accounts and if absent for individual accounts. We identify wage expenses by the tags EmployeeExpensesByNature or GastoPersonalNIIF in this order and company sales by the tags RevenueTotalByNature or ImporteNetoCifraNegocio for non banking companies and OtherOperatingIncomeTotalFinancialInstitutions for banking institutions.
We remove Ferrovial data prior to 2010 as reports refer to CINTRA accounts and likewise for Caixabank prior to 2011 as they describe CRITERIA.
We remove Reig Jofre starting the second semester of 2014 as it results from the merger with NATRACEUTICAL and introduces an important outlier in wage growth.
We download BOE from 2005 to 2015 and find data on public work contracts. We use text mining to extract the value of the contract and the contractor name. Then we write regular expressions for the list of companies in the previous section and add up the volume of public work for each semester and company. Then we calculate the public work awards for each sector, and the fraction that represent over sales for the full time interval.
We manage to match the list of regular expressions against the BOE 9536 times for a sum of contracts worth 56.6 billion euro from 2005 to 2015. The largest contractor-year datum detected is Ferrovial in 2005. It received 37 contracts valued at 9 billion, which is probably biased upwards since some works may be split within coalitions of bidders.
We find that real estate development has the largest public work weight (6.9% of sales) followed by construction sector (4.7%), communication and transports 2.5% and chemicals 0.8%. On the other end, insurance and trade companies have negligible figures. Numbers are likely to be significantly biased downwards due to the difficulty of extracting company names from unstructured BOE documents, but this bias occurs in all sectors. It will be important to keep in mind that median sectoral public work accounts for 0.25% of total sales.

Finally, we get stock market returns for all quoted companies in the Mercado Continuo, and the IBEX 35. We do not have data on unlisted stocks. For each stock we calculate conditional volatility of each semester by estimating a GARCH(1,1) model on daily returns and averaging over the period.
First we use volatility as a dependent variable. As regressors we will choose among the logarithm of the EPU index, the logarithm of the EPU index weighted by sectoral public work, the volatility of the IBEX 35 (period average of a daily GARCH(1,1)), the volatility of the IBEX 35 weighted by sectoral public work, public spending over GDP, and public spending over GDP weighted by sectoral public work.
The sample period is H12005 to H220015, and it contains data for 114 companies and a total of 1981 firm-semester data points.
If the EPU index increases, companies more exposed to public contracting should experience a larger increase in stock volatility, reflecting the concern that public contracting may decrease.
We report coefficient estimates and p-values right below.
First we see that increases in the uncertainty index correlate with increases in volatility. An increase of 1 standard deviation in the EPU increases daily volatility by 0.112 percent points (std of EPU is 62.6 and log(1.62)*0.234 = 0.112).
Second, in a regression with time and firm level effects, we see that EPU causes more volatility the higher the public sector weight. An increase of 1 standard deviation in EPU (62 points), evaluated at the median sector weight(0.00251), increases daily volatility by 0.0044 points (log(1.62)*3.66*0.00251).
Contemporaneous increases in public expenditure increase volatility in all sectors and increasingly in sectors exposed to public contracing.
| Daily volatility | (1) | (2) | (3) | (4) |
|---|---|---|---|---|
| log_EPU | 0.234 | 0.052 | ||
| 0.004 | 0.523 | |||
| log_EPU_weighted | 3.661 | 4.417 | ||
| 0.114 | 0.064 | |||
| ibex35 | 0.583 | |||
| 0.000 | ||||
| ibex35_weighted | -2.213 | |||
| 0.187 | ||||
| spending | 14.984 | 1.948 | ||
| 0.000 | 0.458 | |||
| spending_weighted | 211.485 | 258.530 | ||
| 0.003 | 0.001 | |||
| r2 | 0.053 | 0.251 | 0.103 | 0.252 |
| N | 1906 | 1906 | 1906 | 1906 |
| Time&firm eff. | False | True | False | True |


In the second set of regressions, we will look at the evolution of variables in time. We use as dependent variable the firm semiannual log change in salary expenses. As regressors we modify slightly the previous variables. We use the first lag of log EPU (therefore assuming that salary expenses react with 6 months of delay), the first lag of log EPU weighted by sectorial public work, and the first lag of the change in public expenditure over gdp weighted by sector public work.
Given that we include a first lag of the difference in weighted public spending, the panel spans from the first semester of 2006 to the second semester of 2015.
We do not find a significative association between exposure to public sector and sensitivity to uncertainty. We do find an association between wage growth and increased sensitivity of public dependent companies to IBEX 35 volatility. A one point increase in IBEX 35 daily volatility reduces wage growth by 0.2% at the median (0.00251*0.829).
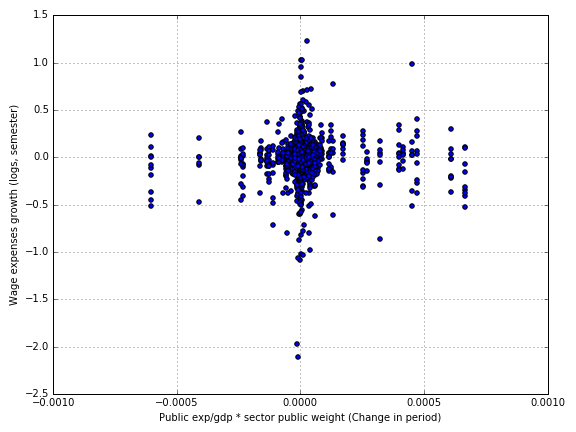
Increases in government purchases predict decreases in wage growth as public exposure increases, perhaps as a result of counter-cyclical spending policies during the crisis.
| Log salary expense | (1) | (2) | (3) | (4) |
|---|---|---|---|---|
| log_epu | -0.065 | -0.065 | ||
| 0.000 | 0.000 | |||
| log_epu_weighted | -0.596 | -0.148 | ||
| 0.367 | 0.834 | |||
| ibex35 | 0.001 | |||
| 0.926 | ||||
| ibex35_weighted | -0.829 | |||
| 0.093 | ||||
| spending | -0.939 | -0.966 | ||
| 0.078 | 0.111 | |||
| spending_weighted | 68.530 | 87.956 | ||
| 0.215 | 0.115 | |||
| lag_spending_we | -88.569 | -124.603 | -88.890 | -100.216 |
| 0.042 | 0.034 | 0.042 | 0.098 | |
| r2 | 0.025 | 0.039 | 0.025 | 0.041 |
| N | 1696 | 1696 | 1696 | 1696 |
| Time&firm eff. | False | True | False | True |