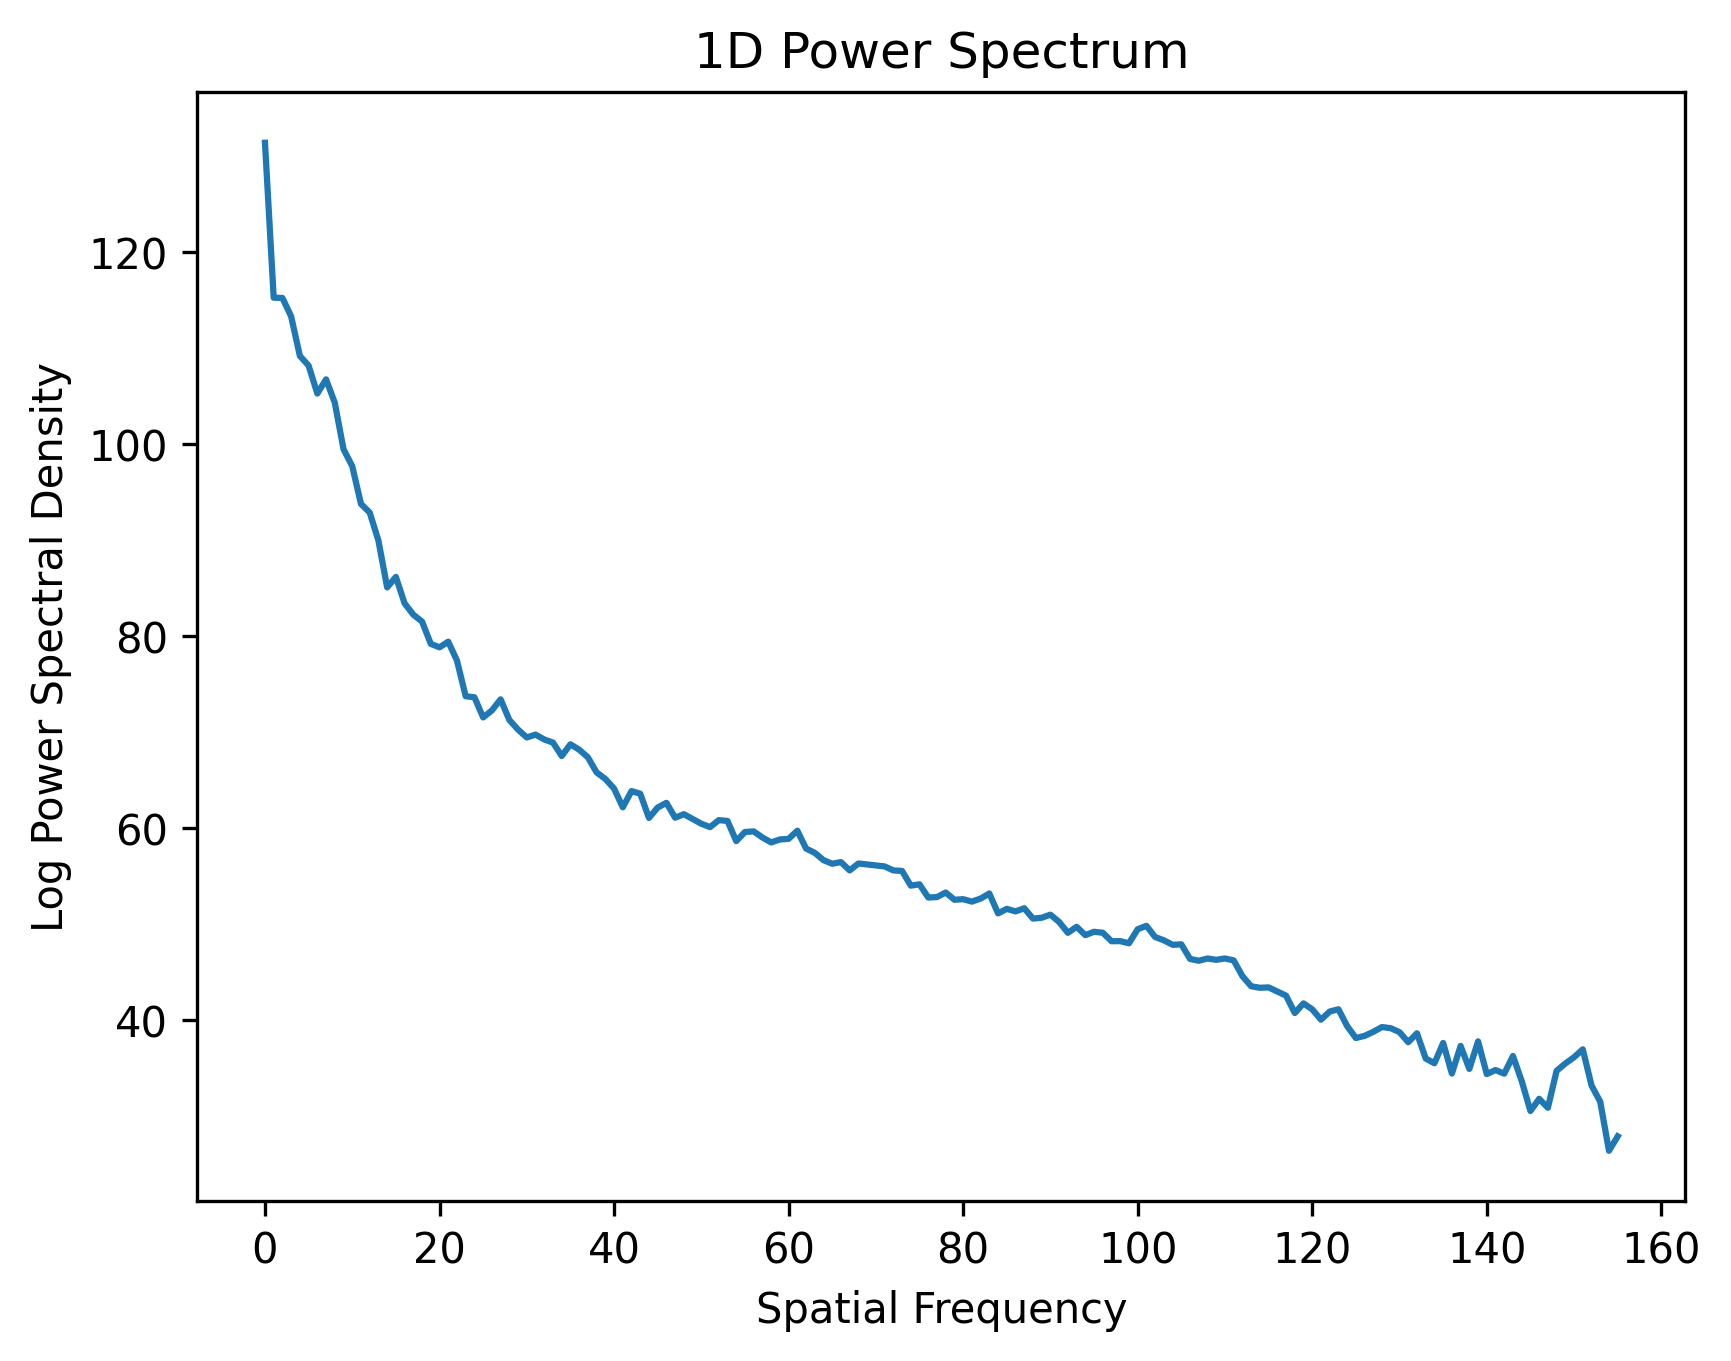
This little script can be easily used on your PyTorch project to visualize the spectral profile of a generated (or any) image (either 2D or 3D).
The program is an unofficial PyTorch implementation of UpConv which is originally written using Numpy. In addition to the original implementation, this program can also be used on 3D images, e.g. MRI or CT volumes.
Also see frequency_bias which is another PyTorch implementation but with only 2D-support and with obsolete PyTorch syntax.
- PyTorch
- PIL (only for the example data)
- Numpy (only for the example data)
- Matplotlib
- Nibabel (optional, only for loading NiFTI files)
To get the spectral profile of an image loaded as a tensor img,
simply call the function get_spectrum as follows:
psd1D = get_spectrum(img)
which returns a 1D power spectral density (PSD) of the image.
Given this following cute cat picture, we first convert it to grayscale, then to a PyTorch tensor.
Finally, we apply get_spectrum to get the 1D PSD of the image and plot the PSD using matplotlib.pyplot.
import torch
import numpy as np
from PIL import Image
import matplotlib.pyplot as plt
from SpectralProfile import get_spectrum

# Read image, convert to grayscale, then to PyTorch tensor
img = Image.open("./cat.jpg").convert('L')
arr = np.array(img.getdata(), dtype=np.float32)
arr = arr.reshape(img.size[1], img.size[0])
arr = arr / 255.0
arr = torch.tensor(arr)

# Get 1D PSD of the image
psd1D = get_spectrum(arr)

# Plot the PSD
plt.plot(psd1D)
plt.xlabel('Spatial Frequency')
plt.ylabel('Log Power Spectral Density')
plt.title('1D Power Spectrum')
plt.savefig('./psd1D.png', dpi=300, bbox_inches='tight')
plt.show()
Let's say you want to look at the power spectrum of a NiFTI file. You can use NiBabel to load the file and convert it to a PyTorch tensor. Here is an example:
import torch
import numpy as np
from PIL import Image
import matplotlib.pyplot as plt
from SpectralProfile import get_spectrum
import nibabel as nib

# Read NiFTI file and convert to PyTorch tensor
img = nib.load('./example.nii.gz')
arr = img.get_fdata()
arr = torch.tensor(arr).float()
arr = arr.squeeze()

# Get 1D PSD of the image
psd1D = get_spectrum(arr)

# Plot the PSD
plt.plot(psd1D)
plt.xlabel('Spatial Frequency')
plt.ylabel('Log Power Spectral Density')
plt.title('1D Power Spectrum')
plt.savefig('./psd1D.png', dpi=300, bbox_inches='tight')
plt.show()
