The end users of this applicaiton are technicians who acquire the instrument specifications testing data.
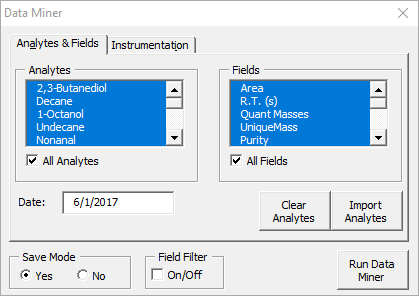
Analyte & Fields Selection Tab
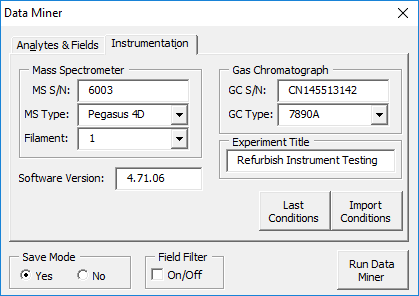
Instrumentation & Analysis Description Tab
Sample Raw Data: (To maintain confidentiality the data examples shown are not “real” and are simulated data sets.)
This file, GROB Z-Test EG1@1600_60.csv, contains the processed data exported from the software interfaced to our Time of Flight Mass Spectrometer. Within this file is every chemical the instrument found within a single sample along with each user defined metrics. Every sample measurement would generate a single *.csv file. For a single experiment it was not uncommon to generate hundreds of *.csv files.
Sample Output: (To maintain confidentiality the data examples shown are not “real” and are simulated data sets.)
Only a tiny fraction of the data can reasonably be shown here, due to the sheer volume that is generated. To summarize…
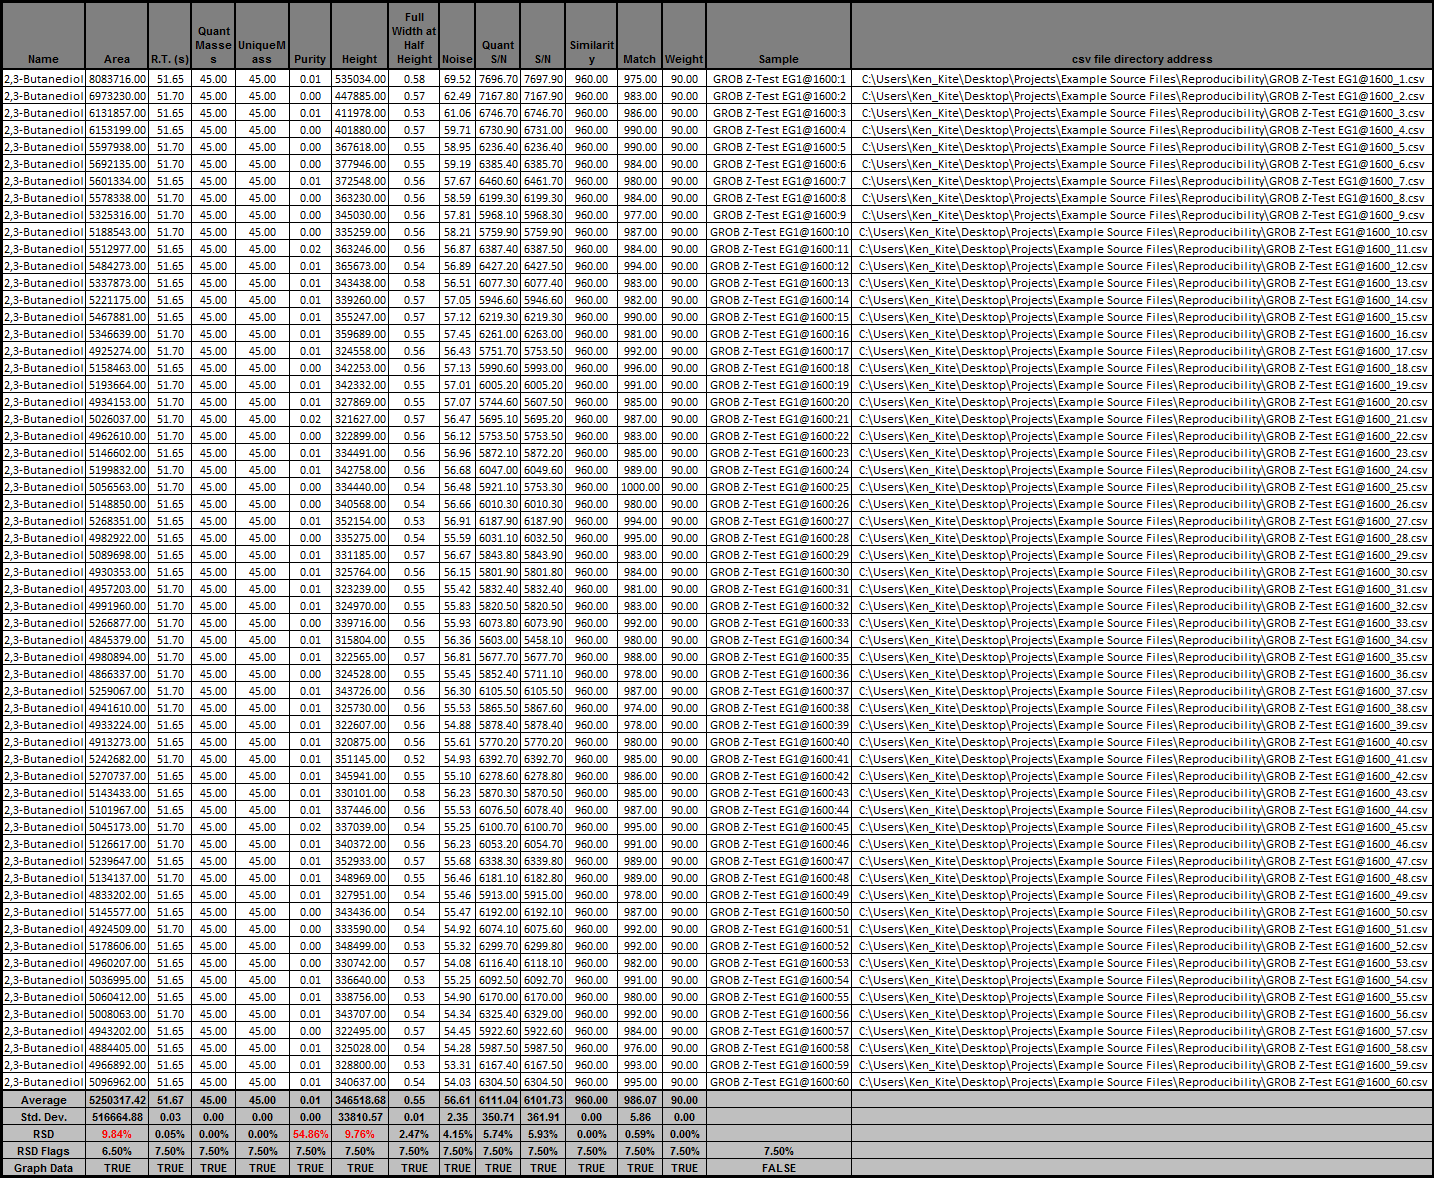
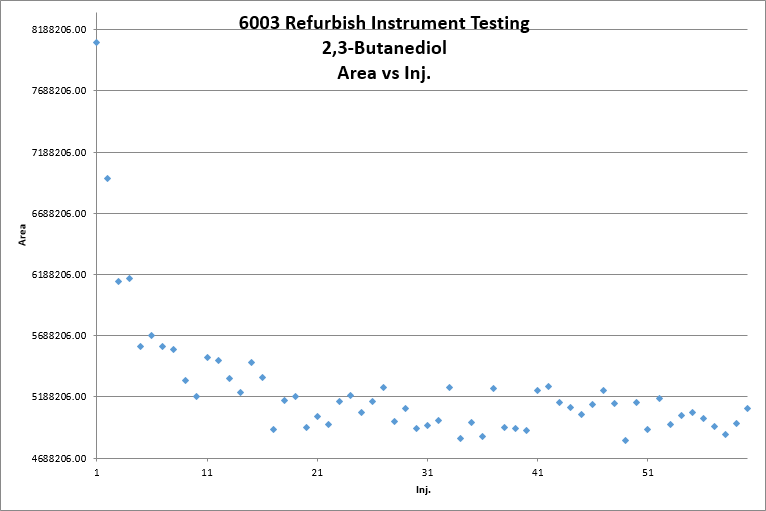
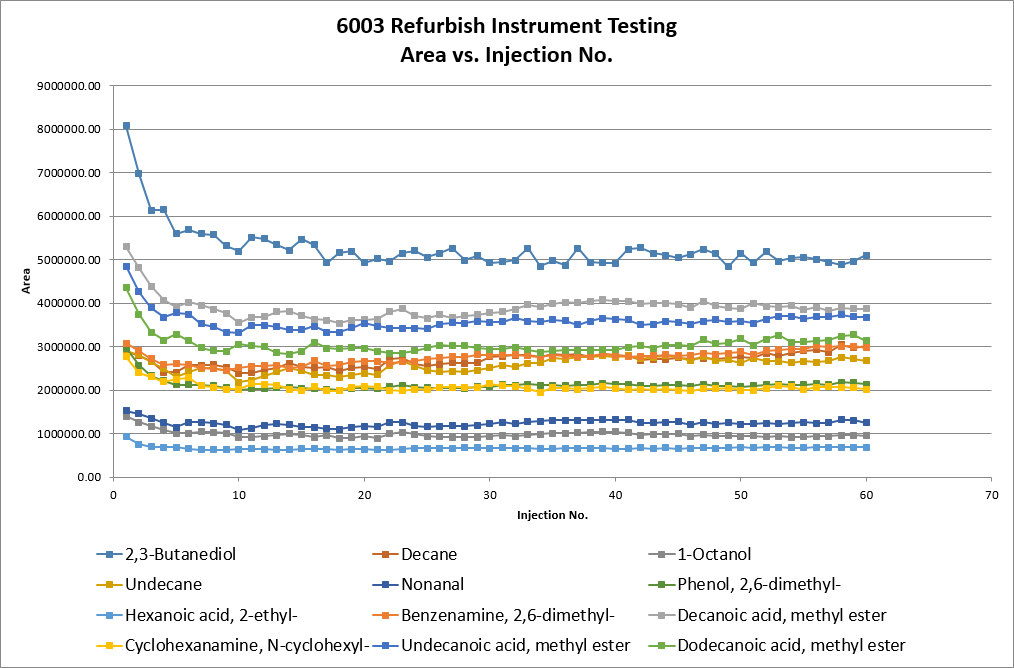
For each chemical included in the analysis an excel worksheet is added to the excel file generated by this application. The chemical worksheet contains all of the data from each field (metric) in tabular form as well as shown graphically:
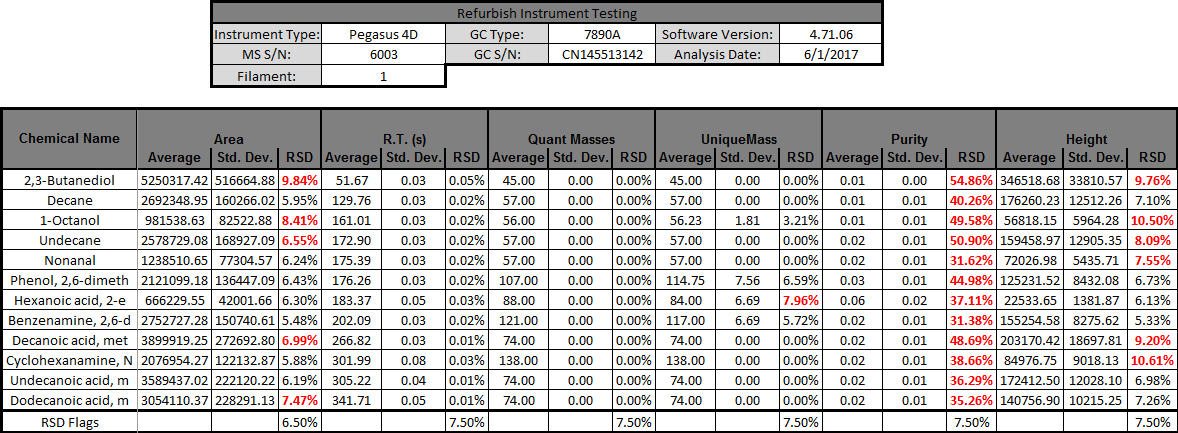
Additionally, there is also a summary worksheet generated that calculates an average, standard deviation, and relative standard deviation for each metric.
The summary worksheet also plots each metric, with all chemicals on a single plot.
Each of the aforementioned worksheets are contained within a single excel file.
When executed, the GUI will prompt the user to select a single representative *.csv file from the population of files a given study or experiment generated. The single *.csv file is scanned to see what chemicals and fields (metrics) it contains. The chemicals found within the *.csv file will then populate the Analytes list box and the fields found will populate the Fields list box on the Analytes & Fields tab of the GUI. The user can then select the desired chemicals and fields to include in the analysis. Optionally, the user can input Metadata on the Instrumentation tab of the GUI. When the user is satisfied with the inputs and elects to run the data miner, the user is prompted with a multi-selection file open dialog, where the entire population of *.csv files is defined by the user.
The application starts the data mining for loop which inteates through each *.csv file. Each *.csv file is opened and is mined for the user defined chemicals and the corresponding fields. This data is appended to a dynamic multi-dimensional array. Finally, the *.csv file is closed. Once the entire population of *.csv files are mined a new excel workbook is created.
Next, the data dumping for loop interates through each chemical within the array. First a new worksheet for the chemical is added to the excel file, and the corresponding data is dumped into a table. The table is formatted to maximize the aesthetics and therefore readability of the table. Each chemical field is plotted, which is added to the chemical worksheet. The process is repeated for each chemical defined by the user which is found in the *.csv files. After the data dumping loop is complete a summary worksheet is added to the excel file. On the summary sheet a table is created and again formatted to maximize the aesthetics and readability. The summary table contains averages, standard deviations, and relative standard deviations (RSD) for each analyte and each field. The RSD cells are conditionally formatted and linked to the corresponding RSD flags cell. If a given RSD value is > the RSD flag, the font for the “failing” RSD value will change to red. Lastly, a plot is generated for each metric, and all the chemicals in the analysis are overlaid on the plot for easy comparison.
Finally, the user is prompted with a file save dialogue, with a default file name composed of the user defined Metadata entered in the Instrumentation tab of the GUI.
